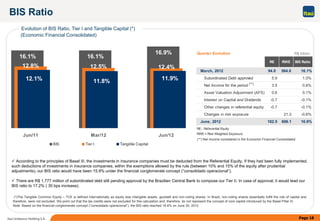
VIP Call Girl Jamshedpur Aashi 8250192130 Independent Escort Service Jamshedpur
Ccal 2 q12_ing
1.
2. Page 2
1. Results:
Recurring net income reached R$ 3.6 billion in the 2ndQ/12 (19.4% ROE), an increase of 8.1% compared to the 2ndQ/11.
In the 1stH/12, the recurring net income reached R$ 7.1 billion (19.7% ROE) increasing 2.5% from the same period of the prior year.
2. Loan Portfolio Growth:
The loan portfolio (including endorsements, sureties and private securities) reached R$ 432,7 billion on June 30, 2012, a 3.6% growth from March 31, 2012
and 15,2% from June 30, 2011.
3. Financial Margin with Clients:
Financial Margin with Clients remained stable in the quarter, at R$ 12.3 billion.
Net Interest Margin with Clients decreased 30 basis points in the 2ndQ/12 to10.9%, mainly because of the fall in the SELIC rate.
The Credit Spread remained almost flat in the quarter, with a reduction of 10 basis points to 13.4%. The Risk adjusted Credit Spread (Net Spread) presented
a 10 basis point increase in the 2ndQ/12, to 7.5%.
Highlights
(*) Includes Debentures, CRI and Commercial Paper
Jun 30, 12 Mar 31, 12 Jun 30, 11
Jun/12–
Mar/11
Jun/12–
Jun/11
Individuals - Brazil 147,331 147,570 135,942 -0.2% 8.4%
Companies - Brazil 241,145 231,232 208,668 4.3% 15.6%
Argentina/Chile/Uruguay/Paraguay 24,923 21,717 15,497 14.8% 60.8%
Total with endorsements and sureties 413,399 400,519 360,107 3.2% 14.8%
Private Securities (*) 19,339 17,067 15,598 13.3% 24.0%
Adjusted Total Risk 432,738 417,586 375,705 3.6% 15.2%
Variation
R$ million
3. Page 3
4. Banking Service Fees and Result from Insurance, Pension Plans and Capitalization:
Banking service fees plus result from insurance, pension plans and capitalization operations grew 0.6% in the 2ndQ/12 compared to the prior quarter,
totaling R$ 5.8 billion. In the 1stH/12, these revenues increased 11.5% compared to the same period of the prior year and reached R$ 11.5 billion.
5. Non-Performing Loans Ratio and Loan Losses:
Expenses for allowance for loan and lease losses, net of credit recovery, totaled R$ 4.9 billion in the 2ndQ/12. The expenses for allowance for loan and
lease losses decreased 0.7% compared to the 1stQ/12 and reached R$ 6.0 billion.
The 90-day NPL ratio reached 5.2% in the 2ndQ/12, a 10 basis point growth compared to the previous quarter and a 70 basis point increase compared to
June 2011.
6. Non-Interest Expenses:
Non-interest expenses increased 3.2% compared to last quarter, totaling R$ 8.4 billion in the 2ndQ/12. In the 1stH/12, compared to the same period of the
prior year, the growth was 5.8%.
7. Efficiency Ratio:
Efficiency ratio in the 2ndQ/12 reached 45.0%, increasing 50 basis points compared to the previous quarter. In the semester, this ratio reached 44.8%, a
280 basis point decrease compared to the 1stH/11.
During the past 12 months the efficiency ratio reached 45.9%, improving 330 basis points compared to the same period of 2011.
8. Unrealized Gains
Unrealized Gains reached R$ 5.8 billion, an increase of 40.5% in the quarter, mainly due to higher values from our securities and credit portfolio. The
balance of unrealized gains from our available for sale portfolio totaled R$ 1.5 billion on June, 2012.
Highlights
4. Page 4
2
nd
Q/12 1
st
Q/12 2
nd
Q/11 1
st
H/12 1
st
H/11
2nd
Q/12 -
1st
Q/12
2nd
Q/12 -
2nd
Q/11
1st
H/12 -
1st
H/11
Operating Revenues 20,268 19,914 18,147 40,183 35,821 1.8% 11.7% 12.2%
Financial Margin with Clients 12,340 12,352 11,231 24,692 22,010 -0.1% 9.9% 12.2%
Financial Margin with Market 1,129 954 690 2,084 1,625 18.4% 63.7% 28.3%
Banking Service Fees and Income from Banking Charges 5,078 5,003 4,672 10,082 9,140 1.5% 8.7% 10.3%
Result from Insurance, Pension Plans and Capit. Operations
before Retained Claims and Selling Expenses
1,466 1,461 1,279 2,927 2,503 0.3% 14.6% 16.9%
Other Operating Income 84 57 95 141 223 46.6% -11.3% -36.5%
Equity in Earnings of Affiliates and Other Investments 151 81 96 233 193 85.8% 58.3% 20.5%
Non-operating Income 19 4 84 24 127 - - -
Loan Losses and Retained Claims (5,374) (5,304) (4,118) (10,678) (7,693) 1.3% 30.5% 38.8%
Expense for Allowance for Loan Losses (5,988) (6,031) (5,107) (12,020) (9,487) -0.7% 17.3% 26.7%
Recovery of Credits Written Off as Losses 1,126 1,192 1,393 2,318 2,600 -5.6% -19.1% -10.8%
Retained Claims (511) (465) (403) (976) (805) 10.1% 26.8% 21.2%
Other Operating Expenses (9,964) (9,659) (9,457) (19,623) (18,526) 3.2% 5.4% 5.9%
Non-interest Expenses (8,411) (8,153) (7,971) (16,564) (15,657) 3.2% 5.5% 5.8%
Tax Expenses for ISS, PIS, Cofins and Other Taxes (1,050) (1,041) (983) (2,091) (1,918) 0.8% 6.8% 9.0%
Other Results (*) (503) (464) (503) (968) (952) 8.4% 0.0% 1.7%
Income Before Tax on Income 4,930 4,952 4,573 9,882 9,603 -0.4% 7.8% 2.9%
Income Tax and Social Contribution (1,345) (1,408) (1,256) (2,753) (2,648) -4.4% 7.1% 4.0%
Recurring Net Income 3,585 3,544 3,317 7,129 6,955 1.2% 8.1% 2.5%
Non-recurring Events (281) (118) 286 (399) 178 - - -
Net Income 3,304 3,426 3,603 6,730 7,133 -3.5% -8.3% -5.6%
Results
R$ million
(*) Includes selling expenses with insurance, profit sharing (management members) and minority interest. In the 2ndQ/12 these expenses represented R$ 245 million, R$ 52 million and R$ 207 million,
respectively.
5. Page 5
(5,107)
(6,031) (5,988)
(9,487)
(12,020)
2ndQ/11 1stQ/12 2ndQ/12 1stH/11 1stH/12
3,317 3,544 3,585
6,955 7,129
2ndQ/11 1stQ/12 2ndQ/12 1stH/11 1stH/12
18,147 19,914 20,268
35,821
40,183
2ndQ/11 1stQ/12 2ndQ/12 1stH/11 1stH/12
Highlights
Non-interest Expenses Recurring Net Income
Operating Revenues Loan Losses Provision Expenses
(Financial Margin, Banking Service Fees, Result from Insurance, Pension Plans and
Capitalization before Retained Claims, Other Income, Equity in Earnings of Affiliates
and Non-Operating Income)
(Personnel, Administrative, Operating and Other Tax Expenses)
R$ million
(7,971) (8,153) (8,411)
(15,657) (16,564)
2ndQ/11 1stQ/12 2ndQ/12 1stH/11 1stH/12
+ 11.7%
+ 1.8%
+ 17.3%
- 0.7%
+ 12.2% + 26.7%
+ 5.5%
+ 3.2%
+ 8.1%
+ 1.2%
+ 5.8%
+ 2.5%
6. Page 6
11.6% 11.2% 10.9% 11.5% 11.0%
2ndQ/11 1stQ/12 2ndQ/12 1stH/11 1stH/12
5,309 5,754 5,788
10,354
11,542
2ndQ/11 1stQ/12 2ndQ/12 1stH/11 1stH/12
Highlights
Recurring ROE (average) Earnings per Share
Net Interest Margin (with Clients) Banking Service Fees and Result from Insurance
( Banking Service Fees and Result from Insurance, Pension Plans and
Capitalization after Retained Claims and selling expenses)
28.6%28.9%29.3%
Participation over Operating Revenues
R$ million
R$
28.7%28.9%
20.4% 20.0% 19.4%
21.9%
19.7%
2ndQ/11 1stQ/12 2ndQ/12 1stH/11 1stH/12
0.70
0.75
0.83
0.78 0.79
0.67
0.82
0.76 0.730.73
0.80
0.87
0.79
0.86
0.84
0.78
3rdQ/10 4thQ/10 1stQ/11 2ndQ/11 3rdQ/11 4thQ/11 1stQ/12 2ndQ/12
Recurring Net Income per share Net Income per share
- 70 bps
- 30 bps
+ 9.0%
+ 0.6%
- 50 bps + 11.5%
- 100 bps
- 60 bps
- 220 bps
7. Page 7
13.8% 13.8%
12.9% 12.8%
13.2% 13.0%
13.5% 13.4%
12.2% 12.2%
11.5% 11.6%
11.0% 11.2%
9.1%
8.3% 8.0%
7.4%8.7%
9.3%
7.4%
6.8% 6.6%
10.3%
12.0%
8.3%
10.9%
11.7%
7.6%
8.3%
7.5%
9.8%
7.8%
8.1%8.1%
10.4%
10.7% 9.8%
10.6% 11.2%
3rdQ/10 4thQ/10 1stQ/11 2ndQ/11 3rdQ/11 4thQ/11 1stQ/12 2ndQ/12
Gross Credit Spread NIM with clients
Net Credit Spread Risk adjusted NIM with clients
CDI
Financial Margin
(after loan losses provision expenses net of the recovery)
8. Page 8
823,763
926,062 942,300
Jun 30, 11 Mar 31, 12 Jun 30, 12
Highlights
Assets Stockholders' Equity
R$ million
+ 14.8%
+ 3.2%
+ 14.4%
+ 1.8%
Loan Portfolio (Includes Endorsements and Sureties) Total Funding with clients (Includes AuA)
793,679
896,842 888,809
Jun 30, 11 Mar 31, 12 Jun 30, 12
+ 12.0%
- 0.9%
+ 14.5%
+ 4.3%
66,083
72,484
75,636
Jun 30, 11 Mar 31, 12 Jun 30, 12
360,107
400,519 413,399
Jun 30, 11 Mar 31, 12 Jun 30, 12
9. Page 9
Variation
Jun 30, 12 Mar 31, 12 Dec 30, 11 Jun 30, 11
Jun/12–
Mar/11
Jun/12–
Dec/11
Jun/12–
Jun/11
Individuals - Brazil 147,331 147,570 147,573 135,942 -0.2% -0.2% 8.4%
Credit Card 36,777 36,574 38,961 34,555 0.6% -5.6% 6.4%
Personal Loans 38,243 37,351 35,069 30,262 2.4% 9.1% 26.4%
Vehicles 56,575 59,054 60,093 60,141 -4.2% -5.9% -5.9%
Mortgage Loans 15,736 14,591 13,450 10,984 7.8% 17.0% 43.3%
Companies - Brazil 241,145 231,232 228,761 208,668 4.3% 5.4% 15.6%
Corporate 149,487 141,253 138,384 122,453 5.8% 8.0% 22.1%
Very Small, Small and Middle Market 91,658 89,979 90,378 86,215 1.9% 1.4% 6.3%
-
Argentina/Chile/Uruguay/Paraguay 24,923 21,717 20,678 15,497 14.8% 20.5% 60.8%
Total with endorsements and sureties 413,399 400,519 397,012 360,107 3.2% 4.1% 14.8%
Total Retail - Brazil 238,989 237,549 237,950 222,157 0.6% 0.4% 7.6%
Total Retail - Brazil (ex-Vehicles) 182,414 178,495 177,857 162,016 2.2% 2.6% 12.6%
Corporate - Total Risk (*) 168,826 158,320 153,604 138,051 6.6% 9.9% 22.3%
Endorsements and Sureties 56,611 53,150 51,530 43,144 6.5% 9.9% 31.2%
1.4% 2.8% 10.4%Growth adjusted for the effects of exchange rate changes
Loans by Type of Client / Product
(*) Includes private securities (debentures, CRIs and commercial papers).
Note: The acquired payroll loan portfolio is considered as corporate risk (balance of R$ 1,883 million on Jun 30, 2012 with an increase of 8.8% compared with Mar 31, 2012 and of 18.3%
compared with Jun 30, 2011).
R$ million
10. Page 10
8.1% 8.0%
7.4%
6.7%
6.3%
6.0% 5.8% 5.7% 5.8%
6.3%
6.6% 6.7%
7.3%
5.6%
4.7%
5.7%
5.4%
4.6%
4.2% 4.2% 4.2%
4.5% 4.7% 4.9% 5.1% 5.2%
3.5% 3.5%
3.7%
3.5%
4.8%5.0%5.8% 4.5%
5.1%
5.3%
5.5%
5.1%
6.0%
5.5%
4.8%
5.6%
5.9%
3.5%
3.1%2.9%2.8%
3.2%3.3%
4.0%4.1%
3.1%
Jun/09 Sep/09 Dec/09 Mar/10 Jun/10 Sep/10 Dec/10 Mar/11 Jun/11 Sep/11 Dec/11 Mar/12 Jun/12
Individuals SFN Total Companies
9.8% 10.2% 9.8%
9.1%
8.6% 8.3%
7.5% 7.3% 7.5% 7.4% 7.5% 7.5% 7.6%
1.8% 1.8% 1.7% 1.5% 1.5% 1.5% 1.4% 1.5% 1.6% 1.5% 1.6% 1.7% 1.7%
1.6% 1.6% 1.3% 1.2% 1.2% 1.1% 0.9% 1.1% 1.2% 1.1% 1.1% 1.4% 1.4%
2ndQ/09 3rdQ/09 4thQ/09 1stQ/10 2ndQ/10 3rdQ/10 4thQ/10 1stQ/11 2ndQ/11 3rdQ/11 4thQ/11 1stQ/12 2ndQ/12
Allowance for loan losses specific + generic + additional/ Loan Portfolio
Expense for Allowance for Loan Losses/ Loan Portfolio (**)
Exp. for Allow. for Loan Losses net of Recov. of Cred. Writt.Off as Loss / Loan Portfolio (**)
Credit Ratios
90-day NPL Ratio 15 to 90-day NPL Ratio
Balance of Allowance for Loan LossesAllowance for Loan Losses
R$ billion
(*)There was an additional provision reversal in the amount of R$ 1.6 billion in the 4th quarter of 2010.
(**) Average loan portfolio balance considering two quarters.
(*) Resolution 2.682/99 CMN
(*)
(*)Source: Brazilian Central Bank (June,2012 data refers to May,2012, once June/12 data were not yet available).
(*)
7.2%
6.9%
7.9%
7.5%
5.9%
5.2%
4.7%
5.1%
4.5% 4.2%
3.9%
4.7% 4.5% 4.3% 4.4%
4.8% 4.5%
3.1%
2.3% 2.1%
2.5%
2.0% 2.2%
1.7%
2.4% 2.4%
2.1% 2.3% 2.3% 2.2%
9.3%
8.6%
7.7%
8.1%
7.5%
6.7% 6.5%
7.5% 7.2%
Jun/09 Sep/09 Dec/09 Mar/10 Jun/10 Sep/10 Dec/10 Mar/11 Jun/11 Sep/11 Dec/11 Mar/12 Jun/12
Individuals Total Companies
10.9 11.6 11.8 10.7 10.1 10.2 10.6 10.3 11.3 12.3 13.1 12.9 14.0
5.5
6.4 6.2
6.1 6.5 6.8 6.9 6.8
7.4 7.3 7.6 8.0 8.0
5.1 5.1 5.1 5.1 5.1
6.5
6.1 6.1
6.1 6.1 6.1 5.14.5
26.025.8
24.723.8
22.2
22.0
23.022.622.924.124.122.9
27.1
Jun/09 Sep/09 Dec/09 Mar/10 Jun/10 Sep/10 Dec/10 Mar/11 Jun/11 Sep/11 Dec/11 Mar/12 Jun/12
Additional provision — expected loss model + counter-cyclical provision
Complementary portion of the provision— expected loss model
Allowance for loan losses – Loan Portfolio Rating A–G (*)
Allowance for loan losses – Loan Portfolio Rating H (*)
11. Page 11
Individuals Vehicle Portfolio (Delinquency)
90-day NPL Ratio by vintage, 4 months after granting - Vehicles
0.5% 0.5%
0.8%
1.2% 1.3%
1.4%
1.2%
1.0%
0.9%
0.7%
0.5%
0.8%
1.0%
1.2%
1.4% 1.5%
0.9%
0.8%
0.7%
0.6% 0.5% 0.4%
0.3%
1.2%
0.7%
1.2%
0.5% 0.4%
0.9%
1.0% 1.0%
1.2%
1.2% 1.3%
dec/09
m
ar/10
jun/10
sept/10
dec/10
jan/11
feb/11
m
ar/11
apr/11
m
ay/11
jun/11
jul/11
ago/11
sept/11
oct/11
nov/11
dec/11
Itaú Unibanco Market without Itaú Unibanco
Month of
Granting
(*) Source: Brazilian Central Bank and Fenabrave (automotive vehicles distribution national federation).
(*)
12. Page 12
Individuals Vehicle Portfolio
Decrease in loan terms and increase in average down payments
There was no origination of loans 60-month term and no down payment in June, 2012
20.1% 16.5% 13.0% 9.0%
79.9% 83.5% 87.0% 91.0% 96.7% 100.0%
3.3%
2010 1stH/11 2ndH/11 1stQ/12 2ndQ/12 jun/12
60-month term no down payment Other plans
28 24 28 31 32 33 35
50 53 50 48 47 44
2009 2010 1stH/11 2ndH/11 1stQ12 2ndQ/12 jun/12
% Average down payment Term (months)
Loan average term and down payment
Itaú Unibanco’s Origination
Vehicles Loan Losses Provision Expenses
705
857
958992
607
2011 quarterly
average
1stQ/12 2ndQ/12 3rdQ/12
Estimated
4thQ/12
Estimated
R$ 1.1 billion
R$ millionItaú Unibanco
42
-
13. Page 13
Jun 30, 12 Mar 31, 12 Jun 30, 11
Jun/12–
Mar/11
Jun/12–
Dec/11
Demand Deposits 31,361 26,903 24,463 16.6% 28.2%
Savings Deposits 73,056 68,488 60,008 6.7% 21.7%
Time Deposits 120,872 127,385 121,641 -5.1% -0.6%
Debentures (Repurchase Agreements) 115,724 110,480 103,222 4.7% 12.1%
Funds from Bills (1) 38,757 37,318 19,519 3.9% 98.6%
(1) Total - Funding from Institucional Clients and Account Holders
(*) 379,770 370,574 328,853 2.5% 15.5%
Onlending 34,694 34,932 34,277 -0.7% 1.2%
(2) Total – Funding from Institutional & Account Holders 414,464 405,505 363,130 2.2% 14.1%
Assets Under Administration 422,623 423,205 379,392 -0.1% 11.4%
Technical Provisions for Insurance, Pension Plan and Capitalization 82,553 77,830 66,703 6.1% 23.8%
(3) Total – Clients 919,641 906,540 809,225 1.4% 13.6%
Deposits from Banks 9,686 8,569 2,802 13.0% 245.6%
Funds from Acceptance and Issuance of Securities Abroad 12,973 10,953 11,736 18.4% 10.5%
Total Funds from Clients + Banks 942,300 926,062 823,763 1.8% 14.4%
Repurchase Agreements (2) 81,941 103,253 95,684 -20.6% -14.4%
Borrow ings 20,885 17,142 18,670 21.8% 11.9%
Foreign Exchange Portfolio 36,775 49,364 25,458 -25.5% 44.5%
Subordinated Debt 42,948 44,984 37,210 -4.5% 15.4%
Collection and payment of Taxes and Contributions 4,238 5,837 9,385 -27.4% -54.8%
Free Assets (3) 64,608 62,579 57,897 3.2% 11.6%
Free Assets and Other 251,395 283,159 244,306 -11.2% 2.9%
Total Funds (Free, Raised and Managed Assets) 1,193,695 1,209,221 1,068,068 -1.3% 11.8%
Variation
R$ million
(*) Funding from Institucional Clients reached R$ 25,365 in June, 2012, representing 6.7% of the Total Funding with clients.
(1) Includes funds from Real estate, mortgage, financial, credit and similar notes.
(2) Does not include own issued Debentures, classified as funding.
(3) Stockholders´ Equity + Minority - Permanent Assets.
Funding and Assets Under Management
14. Page 14
292 292 295 304 362 359
75 99 105 109 112
119 99 101367 391 400 414 446
481 458 465
334 364
345 347
277 295 304 317 335
357
Sep/10 Dec/10 Mar/11 Jun/11 Sep/11 Dec/11 Mar/12 Jun/12
95.1%
101.1% 102.9% 104.1% 100.5%
95.5% 96.7% 98.0%
75.6% 75.5% 75.9% 76.6% 75.2% 71.9% 75.9% 76.8%
91.5%
98.1% 95.1%
101.1% 102.9% 104.1% 100.5%
95.5%
77.7% 76.8% 75.6% 75.5% 75.9% 76.6% 75.2% 71.9%
Loan Portfolio / Funding (%) Loan Portfolio / Gross Funding(**) (%)
Ratio between Loan Portfolio and Funding
R$ billion
(*) Includes resources obtained from account holders and institutional clients, onlending, foreign borrowings and securities, borrowings and subordinated debts that are not
included in Tier II Reference Equity. Considers the deductions of compulsory deposits and cash and cash equivalents.
(**) Considers gross funding (disregarding the deductions of compulsory deposits and cash and cash equivalents).
+ 2.7%
+ 1.4%
274 267 292 292 304 334
48 74 75 99 105 109 112
119
322 341 367 391 400 414
446
481
295 362
317 335
304295
262250 277
345
Mar/10 Jun/10 Sep/10 Dec/10 Mar/11 Jun/11 Sep/11 Dec/11
Funding (*) Compulsory Deposits and Cash Loan Portfolio
15. Page 15
2
nd
Q/12 1st
Q/12 1st
H/12 1st
H/11
2
nd
Q/12 -
1st
Q/12
1
st
H/12 -
1st
H/11
Asset Management 741 707 1,447 1,275 4.9% 13.5%
Current Account Services 807 750 1,557 1,207 7.6% 29.0%
Loan Operations and Guarantees Provided 656 687 1,343 1,572 -4.5% -14.6%
Collection Services 355 345 700 631 2.9% 11.0%
Credit Cards 2,029 2,031 4,059 3,496 -0.1% 16.1%
Orbitall's Processing Service
1 34 115 149 190 -70.4% -21.6%
Other 491 484 975 959 1.4% 1.7%
Banking Service Fees Income
1 5,078 5,003 10,082 9,140 1.5% 10.3%
Result from Insurance, Pension Plans and Capitalization
2 710 750 1,460 1,214 -5.4% 20.2%
Total 5,788 5,754 11,542 10,354 0.6% 11.5%
Banking Service Fees and Result from Insurance, Pension Plans and
Capitalization
R$ million
(1) Without the impact of Orbitall’s Services, Banking Service Fees Income would have increased 3.2% in the quarter, and 11.0% over the first semester of 2011.
(2) Income from insurance, pension plan and capitalization operations (-) Expenses for claims (-) Selling expenses with insurance, pension plan and capitalization
4,784 4,911 4,950 5,045 5,309 5,502
5,906 5,754 5,788
29.2% 29.3% 27.6% 28.5% 29.3% 28.4% 30.1% 28.9% 28.6%
2ndQ/10 3rdQ/10 4thQ/10 1stQ/11 2ndQ/11 3rdQ/11 4thQ/11 1stQ/12 2ndQ/12
Banking Service Fees and Income from Banking Charges + Result from Insur., Pens. Plans and Capitalization
(Banking Service Fees and Income from Banking Charges + Result from Insur., Pens. Plans and Capit.)/Operating Revenues
16. Page 16
(*) Considers expenses for provision for contingencies, credit card selling, claims and other.
(**) Includes IPTU, IPVA, IOF and other. Does not include PIS, Cofins and ISS
Non–Interest Expenses and Efficiency Ratio
R$ million
Efficiency Ratio and Risk-Adjusted Efficiency Ratio
2
nd
Q/12 1st
Q/12 1st
H/12 1st
H/11
2nd
Q/12 -
1st
Q/12
1st
H/12 -
1st
H/11
Personnel Expenses (3,438) (3,392) (6,830) (6,578) 1.4% 3.8%
Administrative Expenses (3,659) (3,428) (7,087) (6,682) 6.7% 6.1%
Personnel Expenses and Administrative (7,098) (6,820) (13,918) (13,260) 4.1% 5.0%
Operating Expenses (*) (1,181) (1,234) (2,415) (2,235) -4.3% 8.1%
Other Tax Expenses (**) (133) (99) (232) (162) 33.3% 43.6%
Non–Interest Expenses (8,411) (8,153) (16,564) (15,657) 3.2% 5.8%
45.0
73.0
47.8 50.2 51.5 47.4 47.8 47.0 47.0 44.5
69.7 70.9 69.2 68.7 71.8 69.0 69.5 72.6
45.9
71.5 70.7 69.5 69.6 70.1 69.7 69.7 70.7 71.0
46.8 48.0 48.8 49.2 49.2 48.4 47.3 46.5
2ndQ/10 3rdQ/10 4thQ/10 1stQ/11 2ndQ/11 3rdQ/11 4thQ/11 1stQ/12 2ndQ/12
Quarter E.R. (%) Quarter R.A.E.R. (%)
E.R. Cumulative figure of the last 12 months (%) R.A.E.R. Cumulative figure of the last 12 months (%)
17. Page 17
32%
8%
17%
29%
14%
Itaú Unibanco’s Recurring Net Income Composition
2ndQ/2012
Consumer Credit
Activities with the Market + Corporation
Commercial Bank
Itaú BBA
Insurance, Pension Plans and Capitalization
2ndQ/2011 1stQ/2012
31%
10%
21%
23%
15%
39%
10%18%
20%
13%
18. Page 18
BIS Ratio
Evolution of BIS Ratio, Tier I and Tangible Capital (*)
(Economic Financial Consolidated)
(*)The Tangible Common Equity – TCE is defined internationally as equity less intangible assets, goodwill and non-voting shares. In Brazil, non-voting shares essentially fulfill the role of capital and,
therefore, were not excluded. We point out that the tax credits were not excluded for this calculation and, therefore, do not represent the concept of core capital introduced by the Basel Pillar III.
Note: Based on the financial conglomerate concept (“consolidado operacional”), the BIS ratio reached 16.6% on June 30, 2012.
According to the principles of Basel III, the investments in insurance companies must be deducted from the Referential Equity. If they had been fully implemented,
such deductions of investments in insurance companies, within the exemptions allowed by the rule (between 10% and 15% of the equity after prudential
adjustments), our BIS ratio would have been 15.9% under the financial conglomerate concept (“consolidado operacional”).
There are R$ 1,777 million of subordinated debt still pending approval by the Brazilian Central Bank to compose our Tier II. In case of approval, it would lead our
BIS ratio to 17.2% ( 30 bps increase).
16.1% 16.1%
16.9%
12.4%12.5%12.8%
11.9%11.8%12.1%
Jun/11 Mar/12 Jun/12
BIS Tier I Tangible Capital
Quarter Evolution
RE RWE BIS Ratio
March, 2012 94.0 584.8 16.1%
Subordinated Debt approved 5.9 1.0%
Net Income for the period 3.5 0.6%
Asset Valuation Adjustment (AFS) 0.6 0.1%
Interest on Capital and Dividends -0.7 -0.1%
Other changes in referential equity -0.7 -0.1%
Changes in risk exposure 21.3 -0.6%
June, 2012 102.5 606.1 16.9%
RE- Referential Equity
RWE= Risk Weighted Exposure
R$ billion
(**) Net Income considered in the Economic Financial Consolidated
(**)
19. Page 19
Market Capitalization (R$ billion)
Market Capitalization and Average Daily Trading Volume
Average Daily Trading Volume
(1)
(1) As of June 30, 2012, we were the 15th largest bank in the world in terms of market capitalization (Source: Bloomberg)
NYSE (ADR) BM&FBOVESPA (Non-voting + Common)
106
224
452
632
368
443 458 450
189
242
191
207
277 301
32 36 51
185
319
641
874
559
650
735 751
9 13 19
23 23 32
79
95
23.8
41.2
54.5
80.8
115.3
140.5
107.9
175.1 179.6
152.8
126.7
2002 2003 2004 2005 2006 2007 2008 2009 2010 2011 1stH/12
20. Page 20
Expectations for 2012
2. Stable NPL levels in the year
with possible seasonal variations
4. Non-interest expenses growth: 4% – 8%
3. Increase in banking service fees and result from insurance,
pension plan and capitalization operations (*): 10% – 12%
1. Credit growth: 14% – 17%
maintenance of market share among privately owned banks
5. Efficiency ratio improvement: 200 – 300 basis points
Conference Call of the 4thQ11 Revised
(*) Banking Service Fees (+) Income from insurance, pension plan and capitalization operations (-) Expenses for claims (-) Selling expenses with insurance, pension plan and capitalization.
Loan Loss Provision expenses:
• 3rdQ12: between R$ 6.0 billion and R$ 6.5 billion
• 4thQ12: between R$ 5.7 billion and R$ 6.2 billion
Non-interest expenses:
• Growth between 3.5% and 6.5%
Maintained
Total Credit Portfolio:
• Ex-Vehicles: growth of 13% - 15%
• Vehicles: decreasing to R$ 50 - 52 billion
Maintained
21. Page 21
Association with Banco BMG S.A.
Association’s expected Credit Portfolio within 2 years:
R$ 12 billion
=Corporate Stake
=Funding Agreement (respecting limits and conditions)
=Payroll Debit Loan Flow
70% 30%
70%
30%
BMG
Shareholders
Banco Itaú BMG
Consignado S.A.
Distribution Channels
Itaú Unibanco
Holding S.A.
Itaú Unibanco
S.A.
Banco BMG
S.A.
Structure: Creation of an association
Banco Itaú BMG Consignado S.A.
Initial capital: R$ 1 billion
Objective: Distribution and Commercialization of
payroll debit loans;
Itaú Unibanco: Economic-financial capacity,
administrative and control experience;
BMG: commercial and operational
competence and technological platform.
Obs: From now on, and for the term of 5 years, Itaú Unibanco shall provide part of the financial resources for BMG´s payroll debit loan operation in the monthly
amount of up to R$ 300 million, within limits and conditions.