Downloaded 713 times
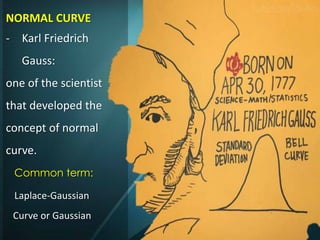

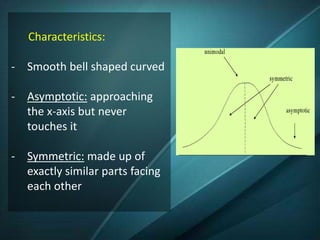
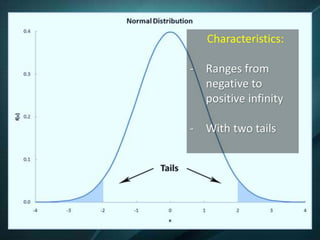
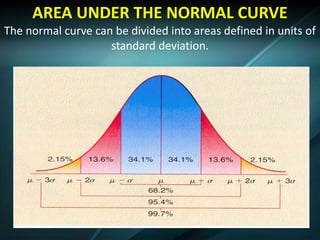


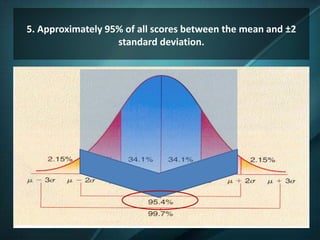
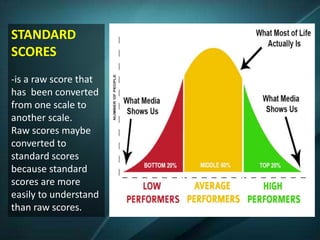

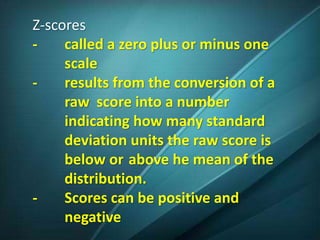

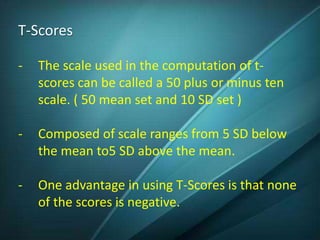

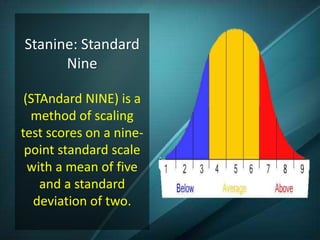
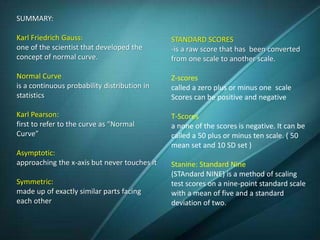


The document discusses the normal curve and standard scores. It defines the normal curve as a continuous probability distribution that is bell-shaped and symmetric. It was developed by Gauss and Pearson. The normal curve can be divided into areas defined by standard deviations from the mean. Standard scores are raw scores converted to other scales, including z-scores, t-scores, and stanines. Z-scores indicate the distance from the mean in standard deviations. T-scores are on a scale of 50 plus or minus 10. Stanines use a nine-point scale with a mean of 5 and standard deviation of 2.


