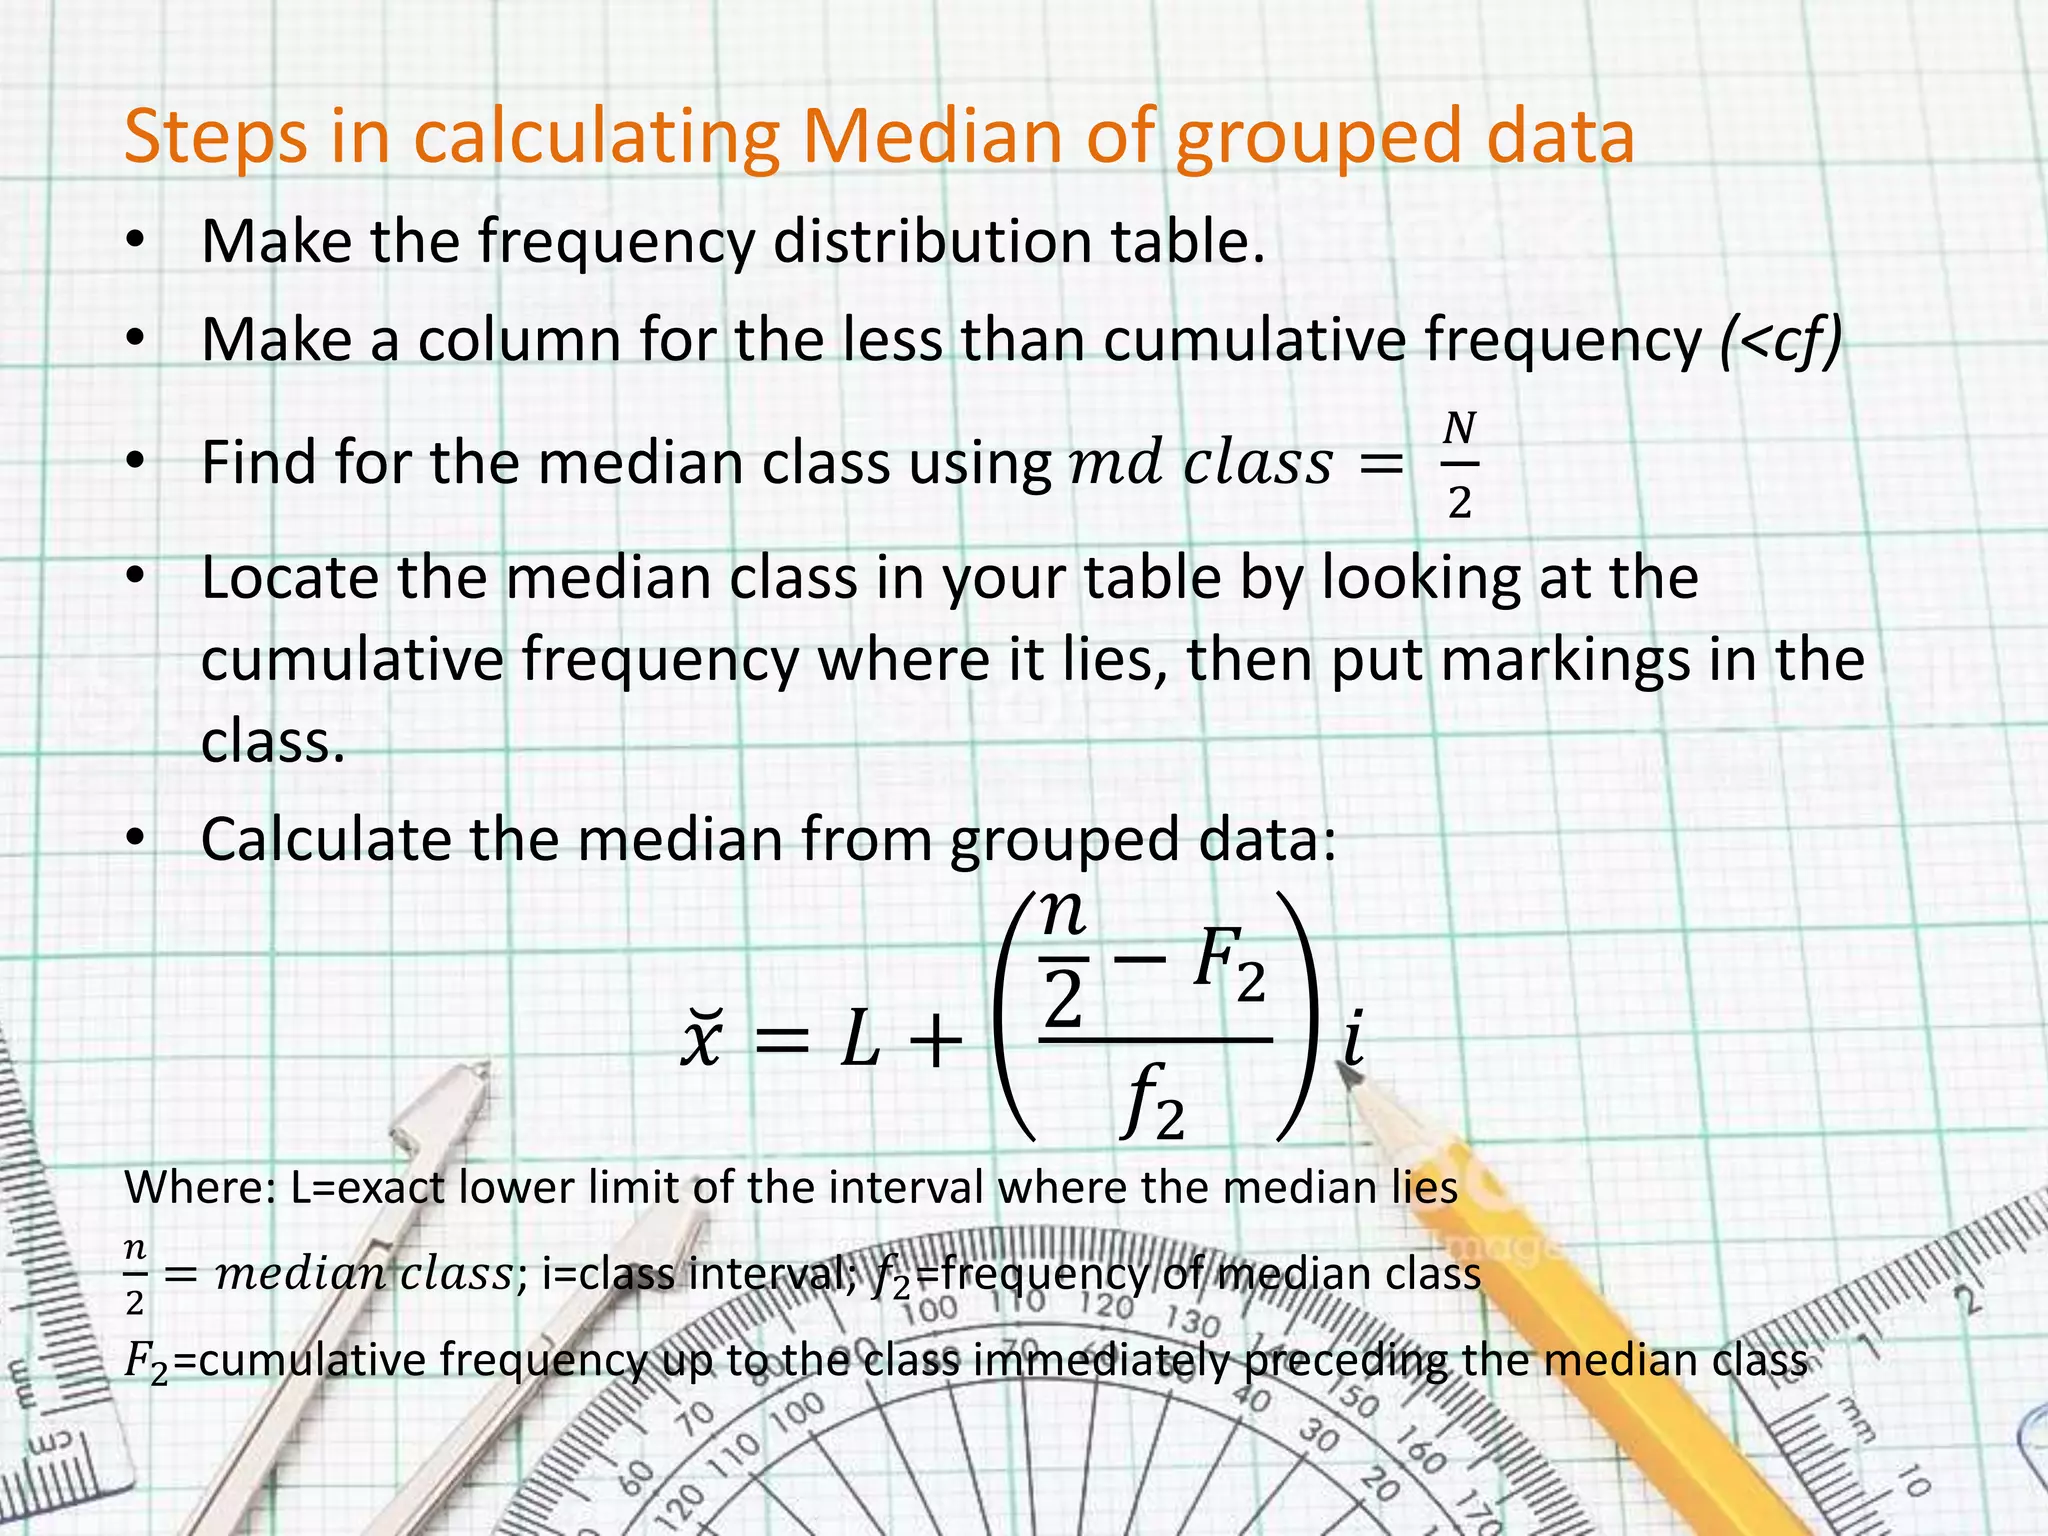
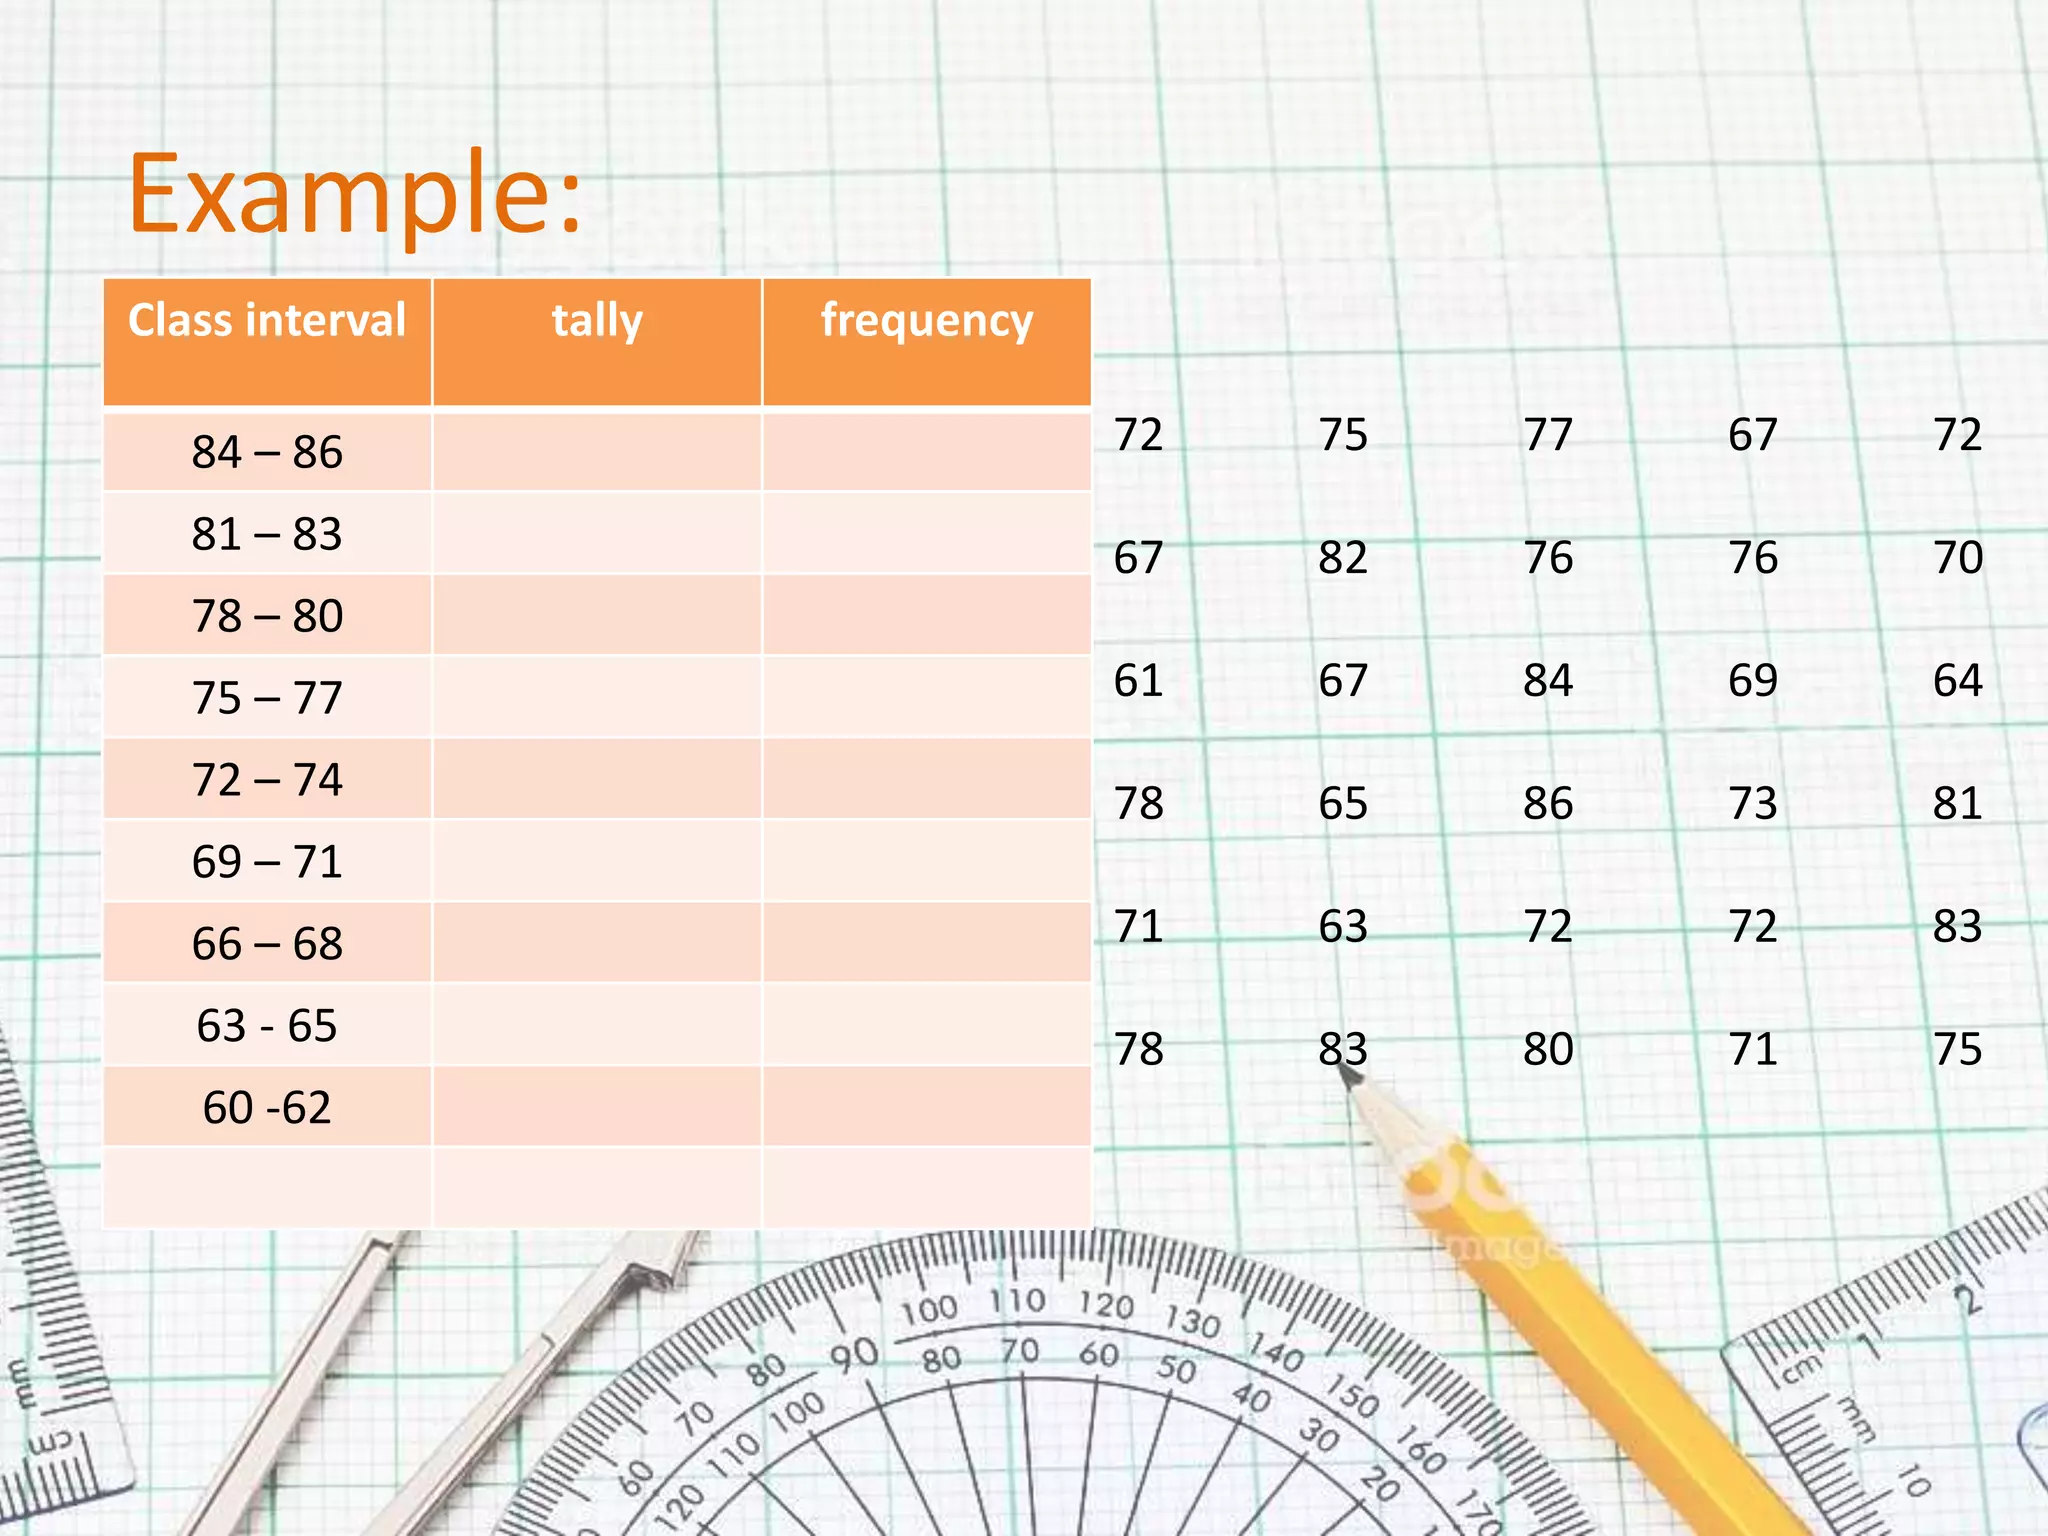
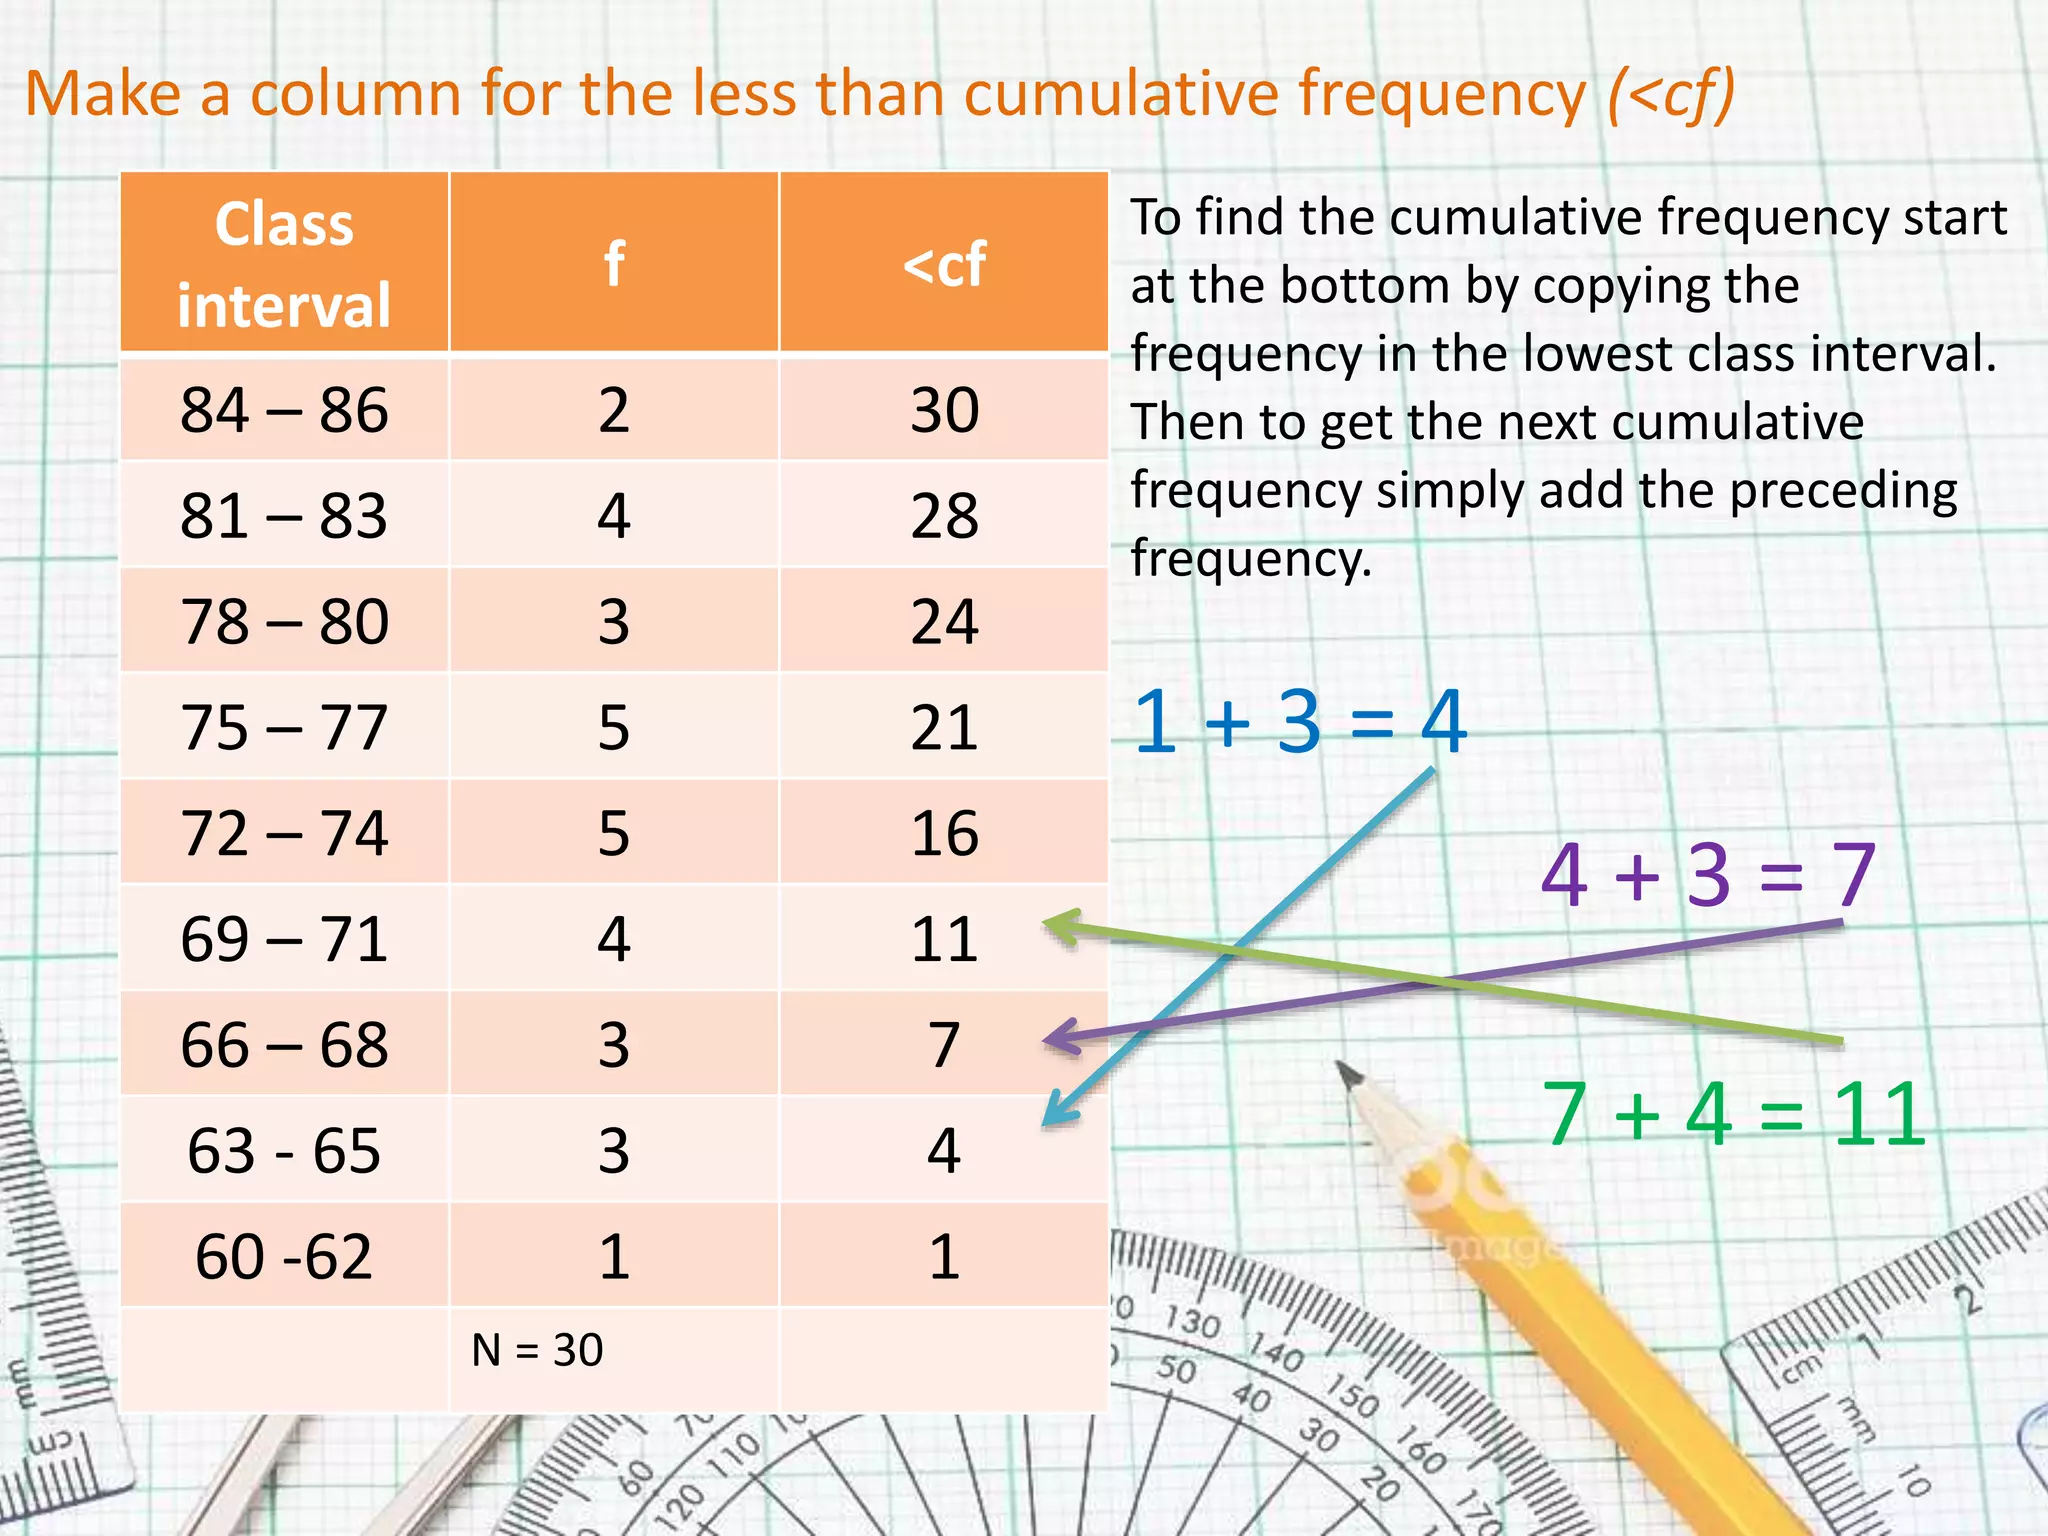
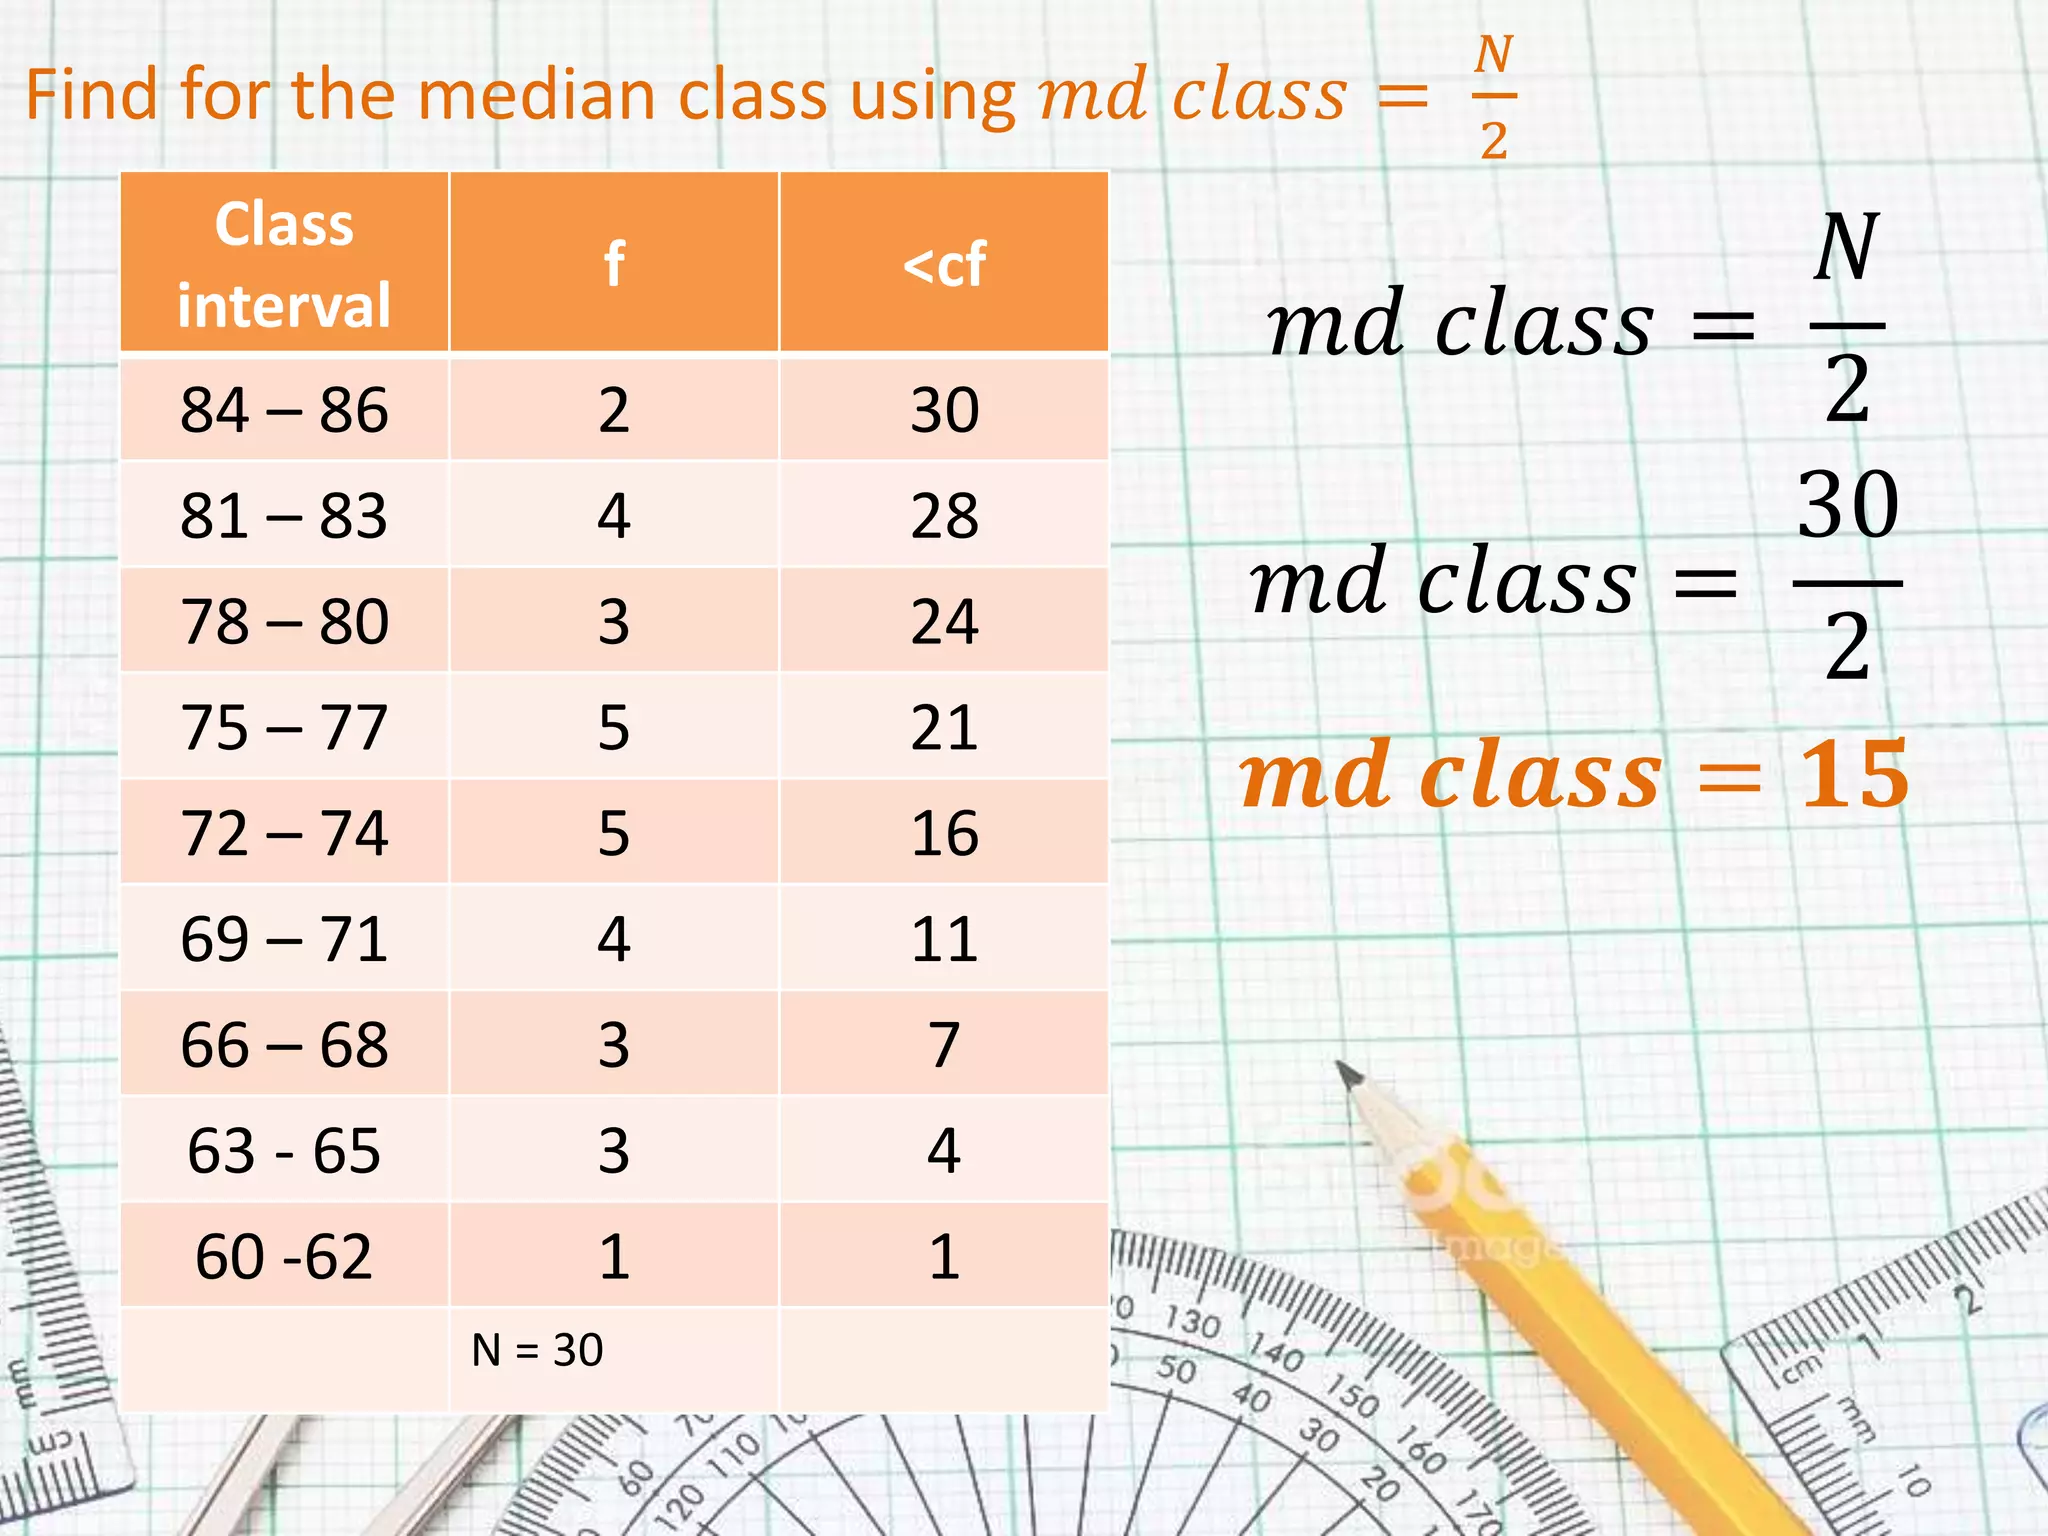
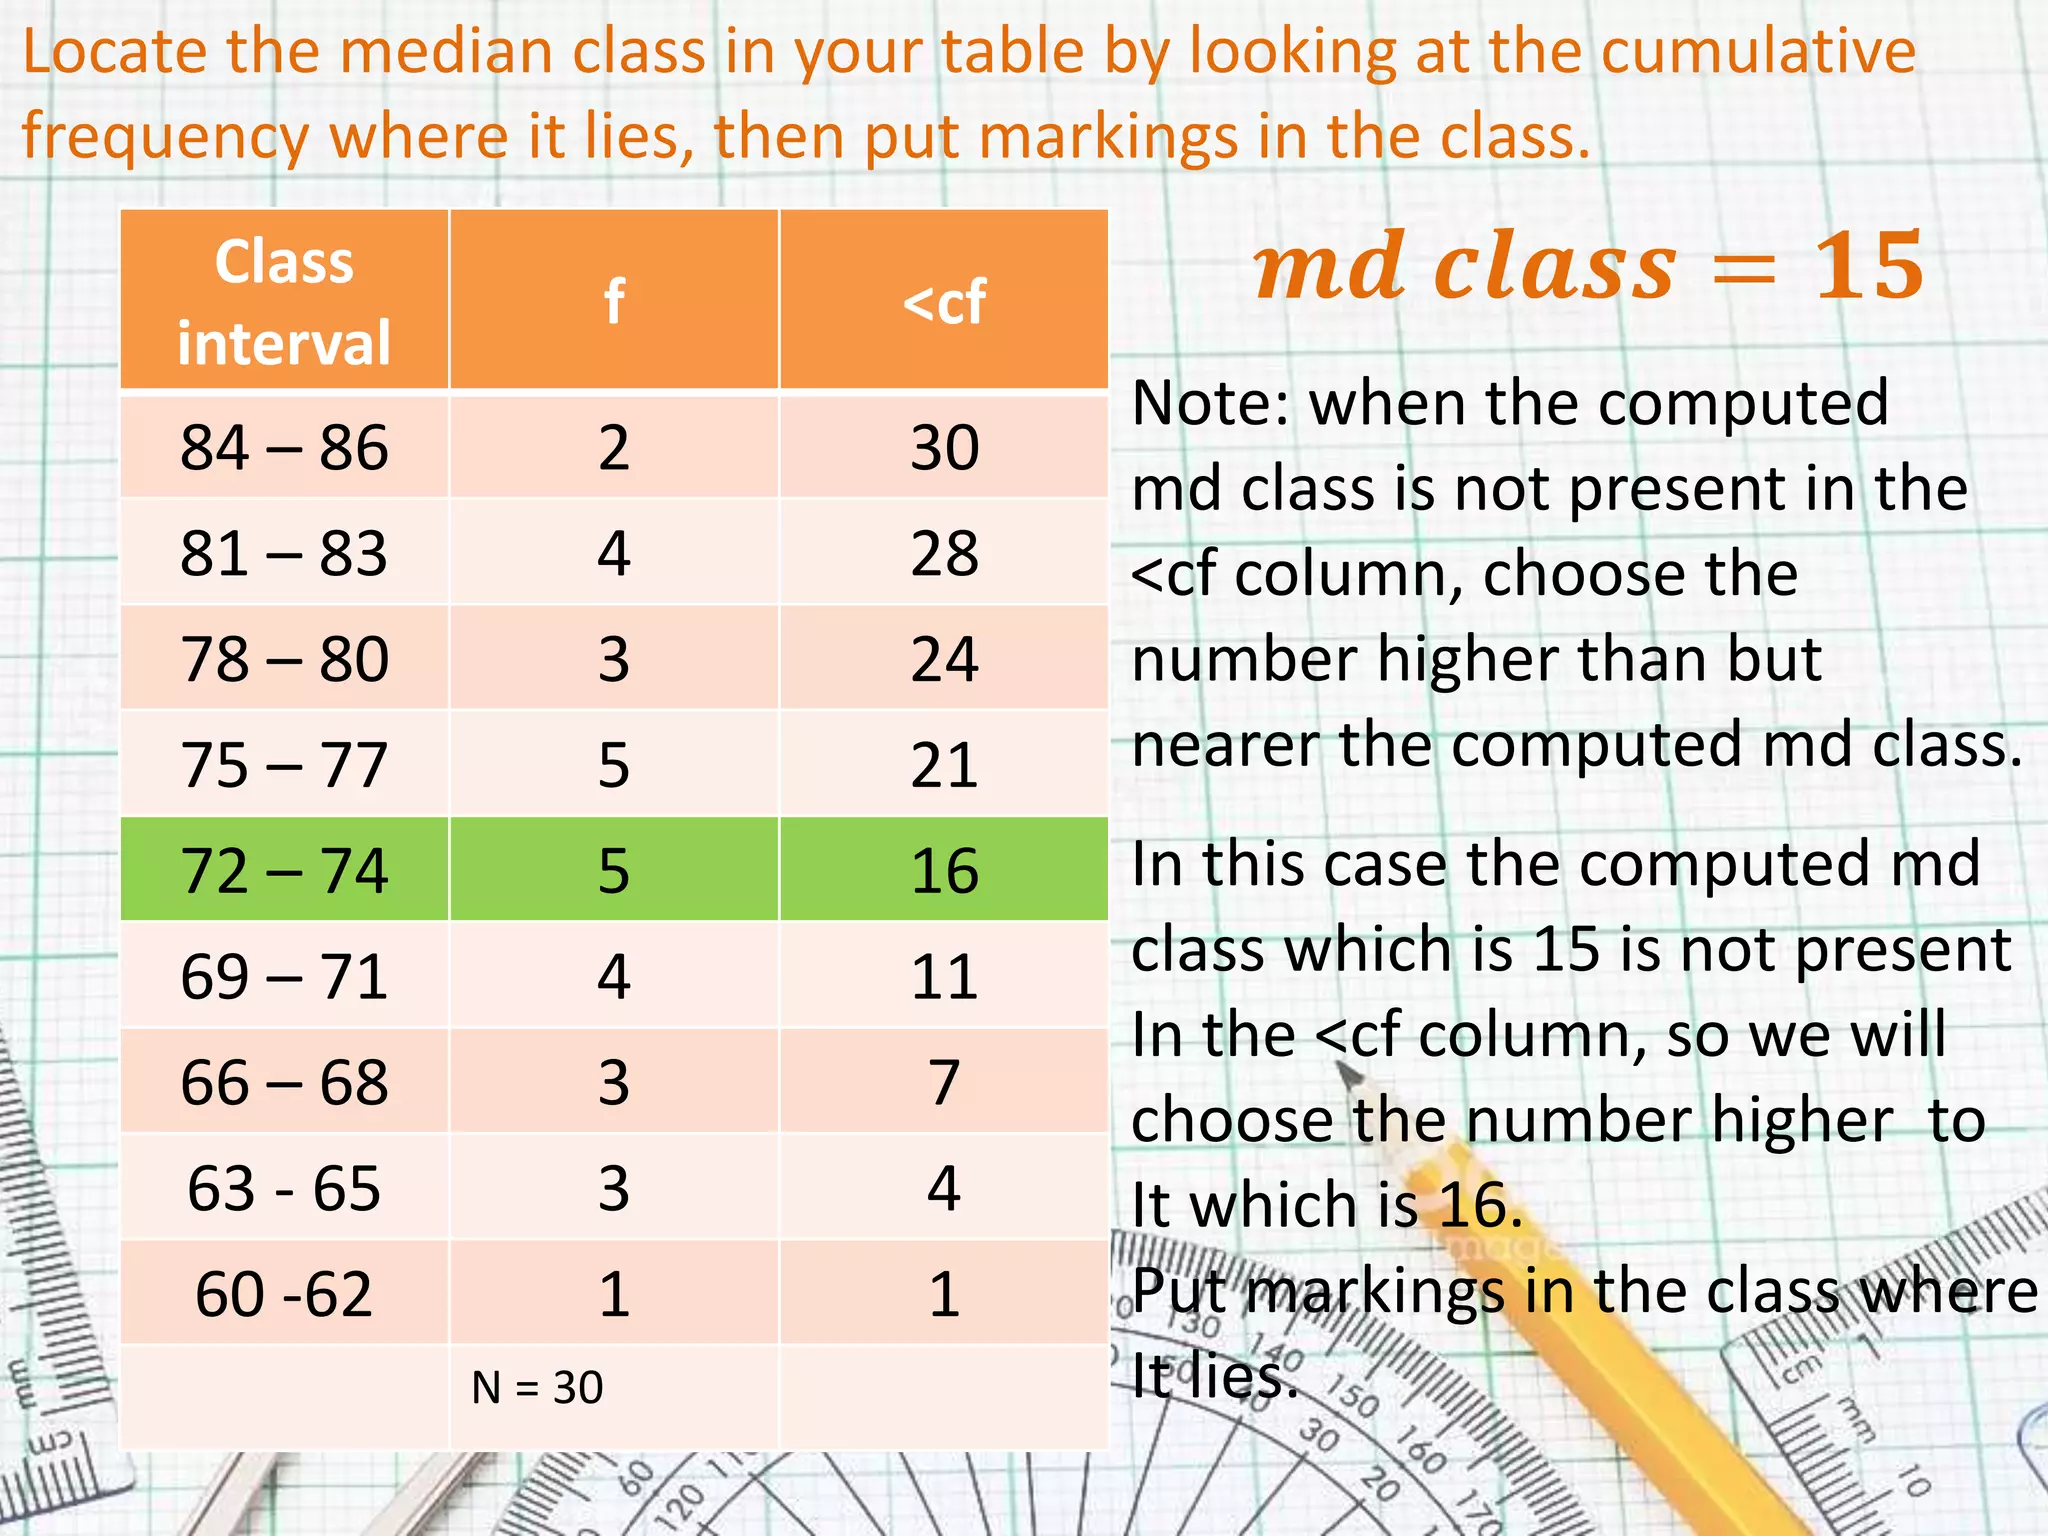
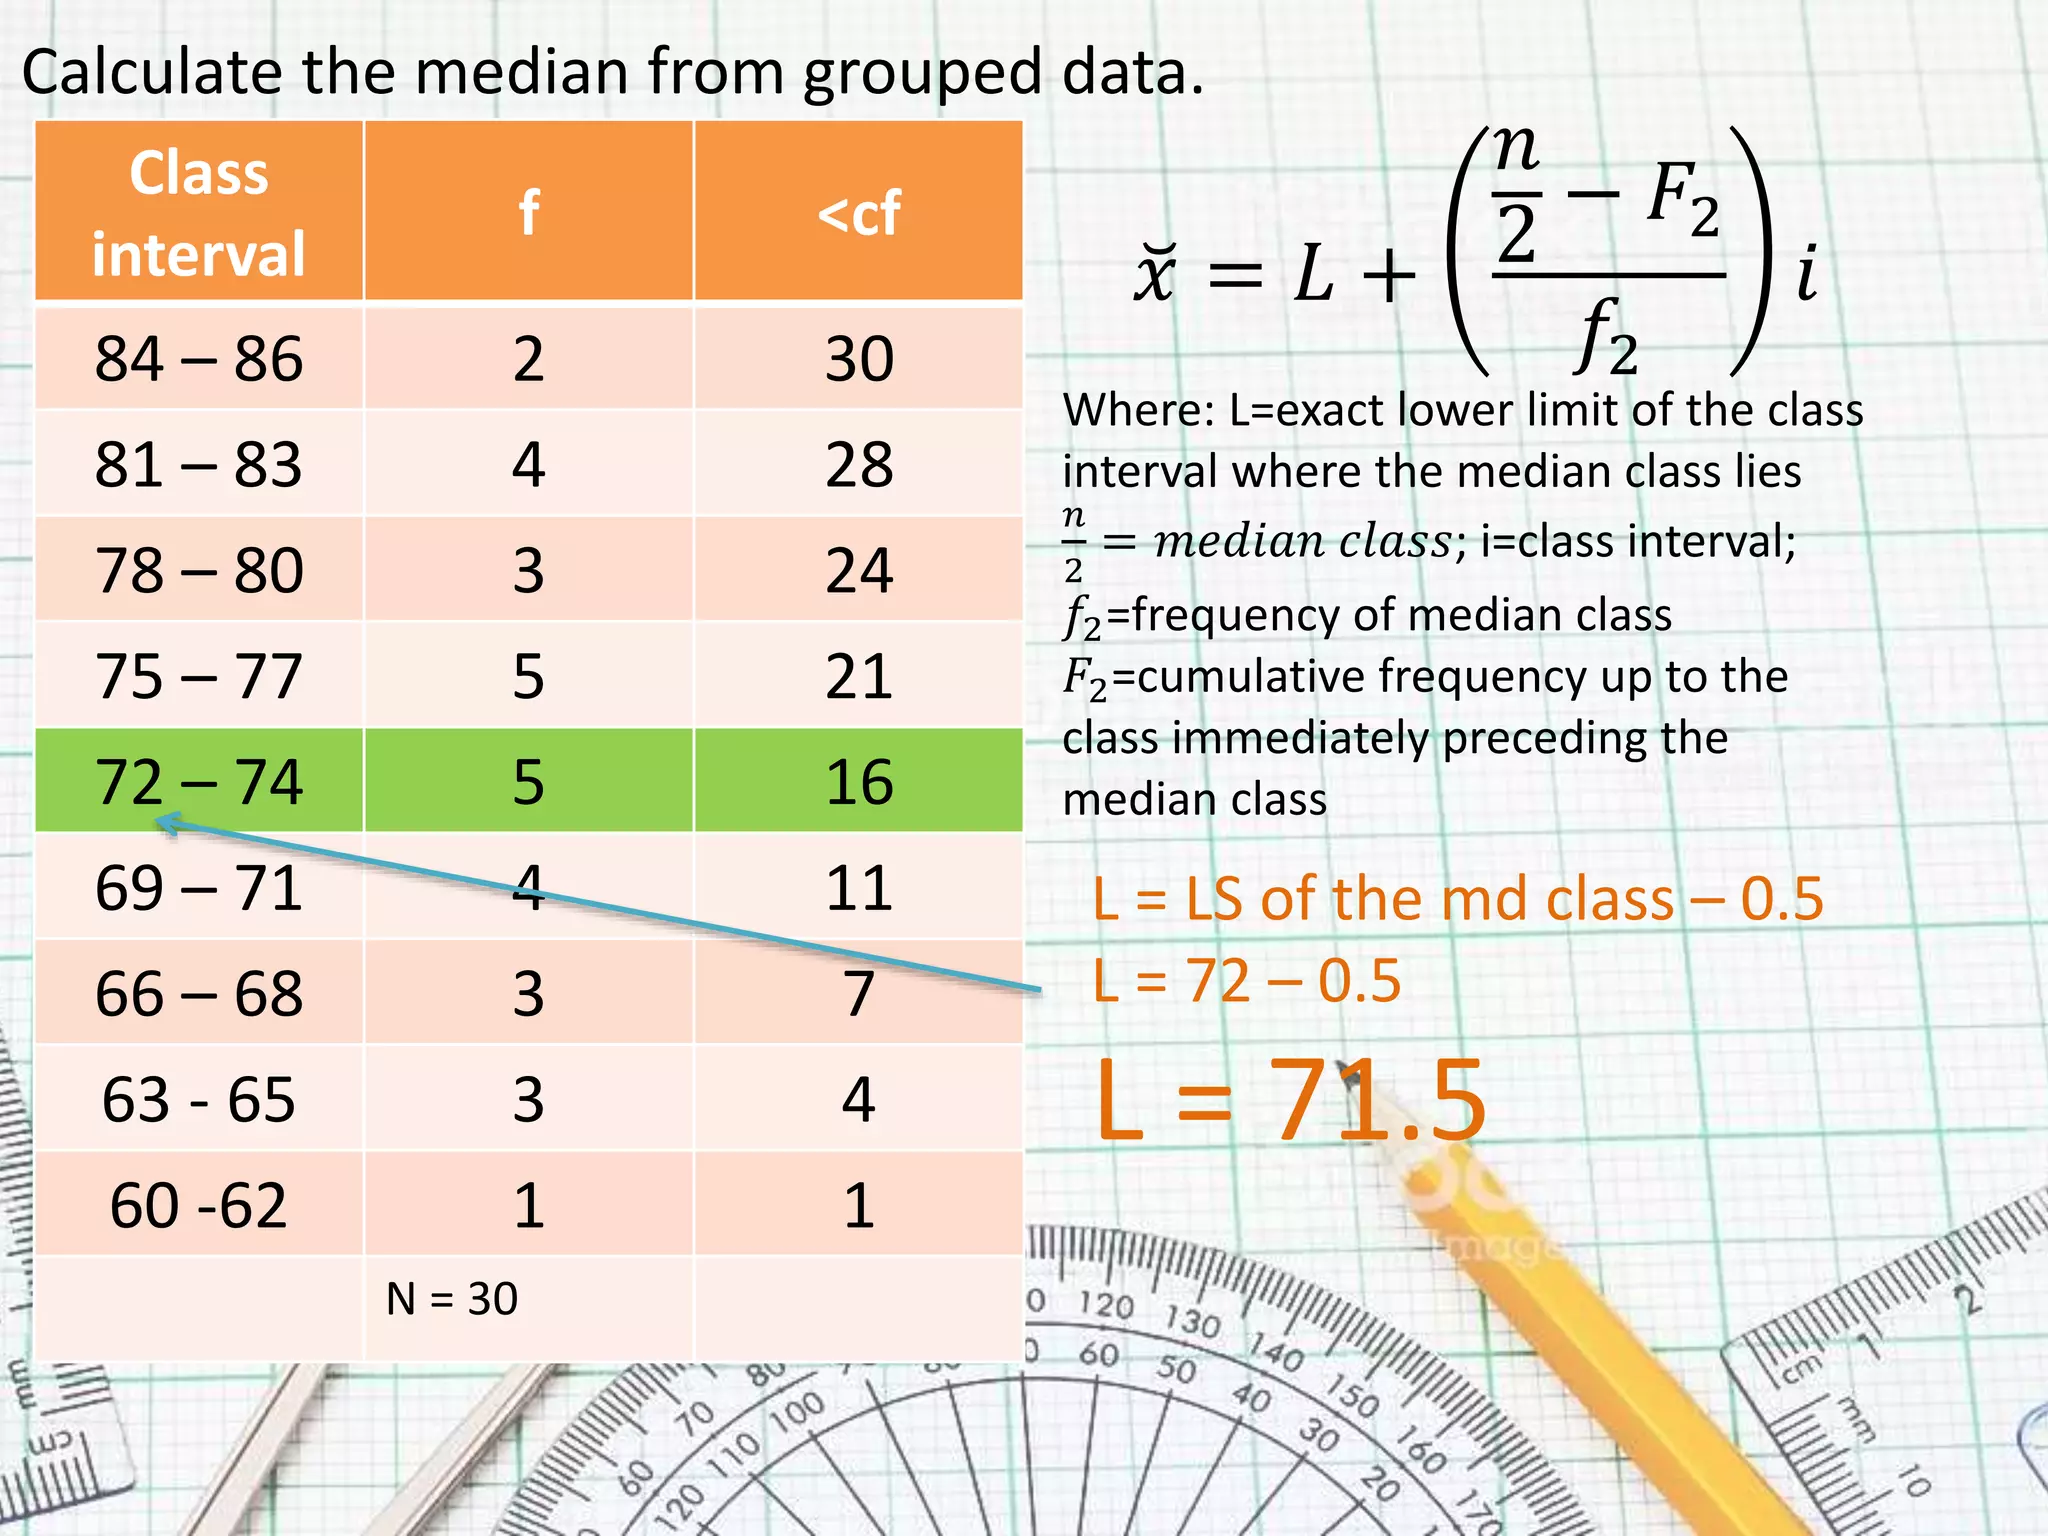
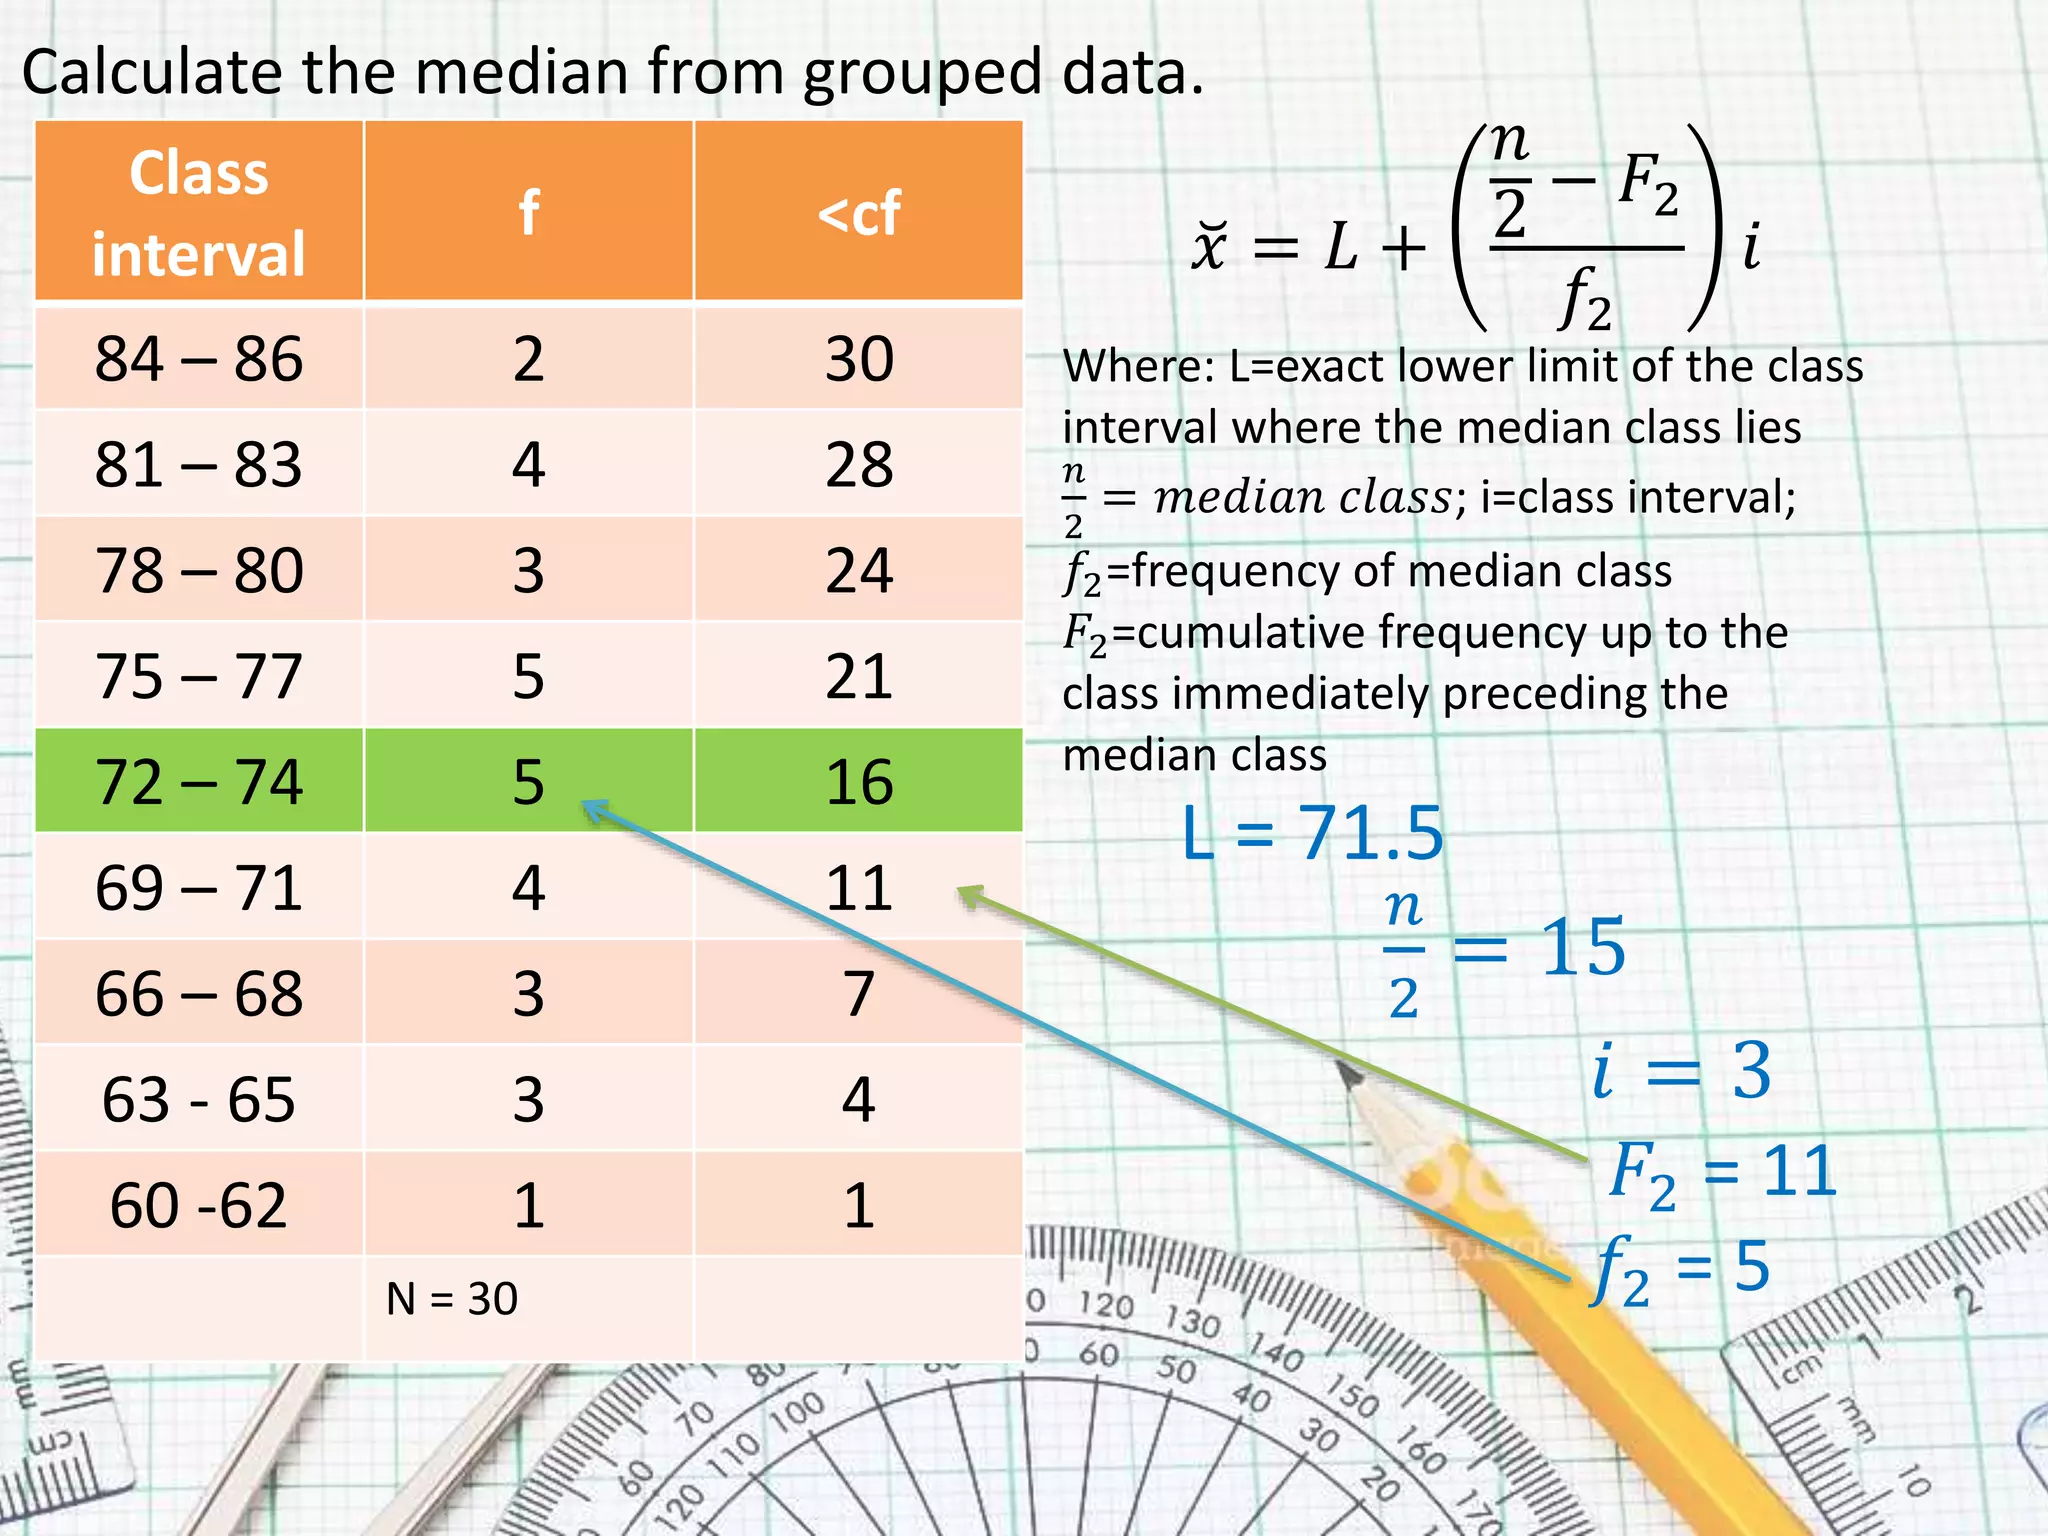
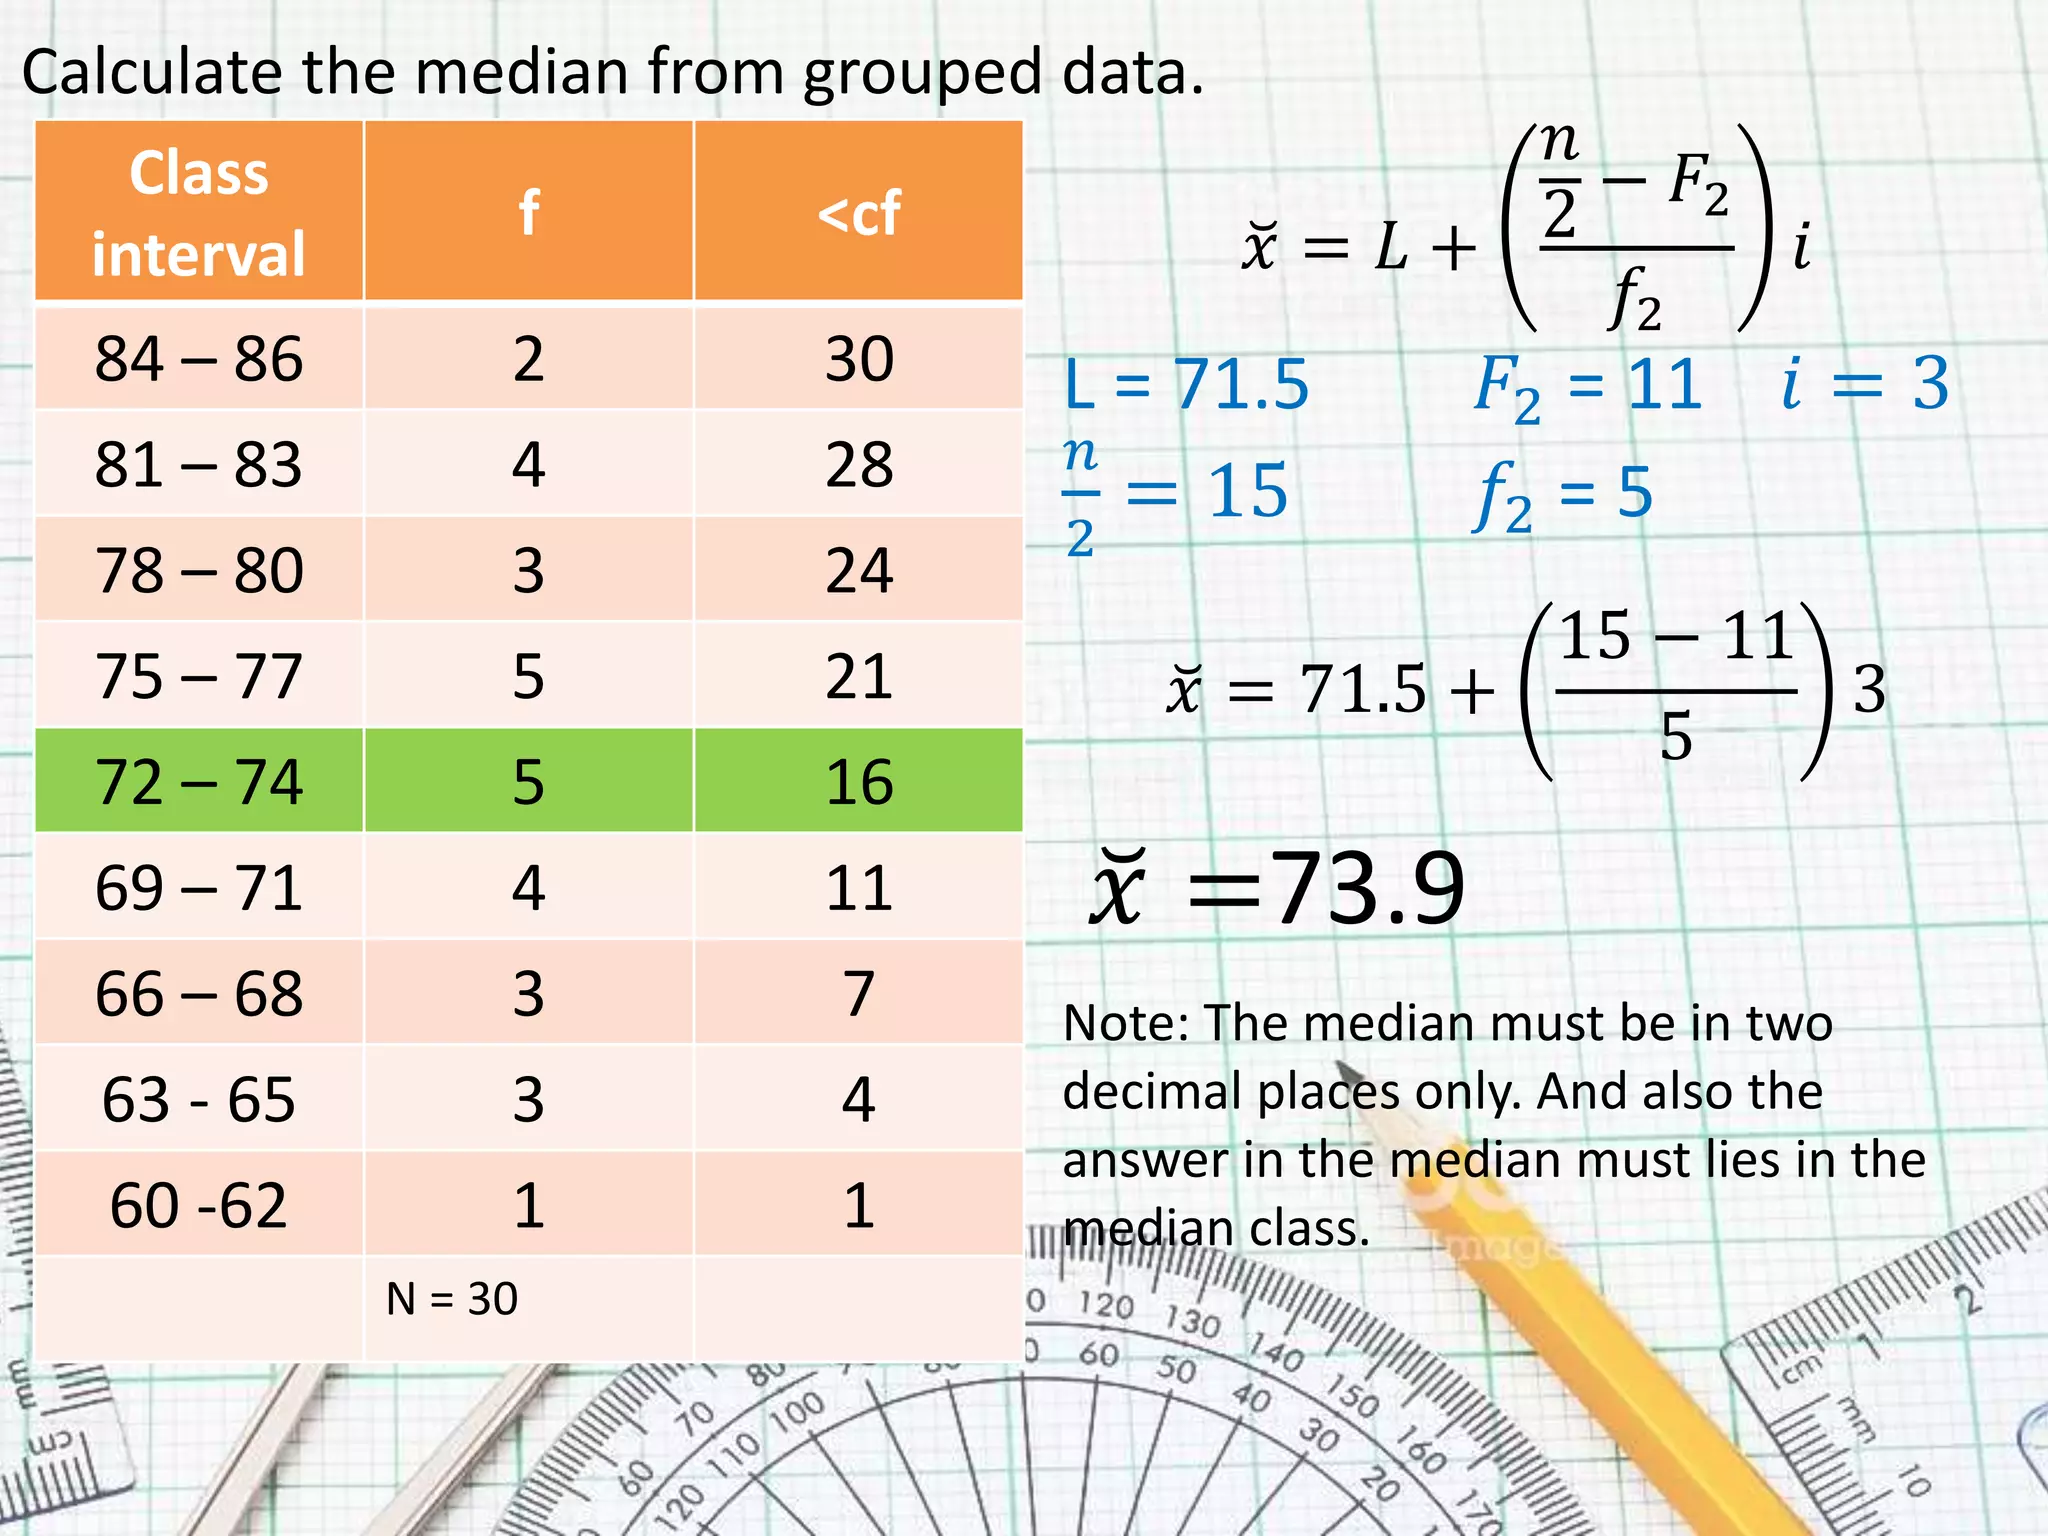
This document provides steps for calculating the median of grouped data:
1. Create a frequency distribution table with class intervals, frequencies, and cumulative frequencies.
2. Find the median class by calculating N/2, where N is the total number of data points.
3. The median is calculated using the formula: x = L + (n2 - F2)/f2 * i, where L is the lower limit of the median class, n2 is the median class, F2 is the cumulative frequency before the median class, f2 is the frequency of the median class, and i is the class interval.
probability of a mutually and non mutually events. topic in mathematics 10 .statistics and probability . probability of a mutually and non mutually events. topic in mathematics 10 .statistics and probability . probability of a mutually and non mutually events. topic in mathematics 10 .statistics and probability . probability of a mutually and non mutually events. topic in mathematics 10 .statistics and probability . probability of a mutually and non mutually events. topic in mathematics 10 .statistics and probability . probability of a mutually and non mutually events. topic in mathematics 10 .statistics and probability . probability of a mutually and non mutually events. topic in mathematics 10 .statistics and probability . probability of a mutually and non mutually events. topic in mathematics 10 .statistics and probability . probability of a mutually and non mutually events. topic in mathematics 10 .statistics and probability . probability of a mutually and non mutually events. topic in mathematics 10 .statistics and probability . probability of a mutually and non mutually events. topic in mathematics 10 .statistics and probability . probability of a mutually and non mutually events. topic in mathematics 10 .statistics and probability . probability of a mutually and non mutually events. topic in mathematics 10 .statistics and probability . probability of a mutually and non mutually events. topic in mathematics 10 .statistics and probability . probability of a mutually and non mutually events. topic in mathematics 10 .statistics and probability . probability of a mutually and non mutually events. topic in mathematics 10 .statistics and probability . probability of a mutually and non mutually events. topic in mathematics 10 .statistics and probability . probability of a mutually and non mutually events. topic in mathematics 10 .statistics and probability . probability of a mutually and non mutually events. topic in mathematics 10 .statistics and probability . probability of a mutually and non mutually events. topic in mathematics 10 .statistics and probability . probability of a mutually and non mutually events. topic in mathematics 10 .statistics and probability . probability of a mutually and non mutually events. topic in mathematics 10 .statistics and probability . probability of a mutually and non mutually events. topic in mathematics 10 .statistics and probability . probability of a mutually and non mutually events. topic in mathematics 10 .statistics and probability . probability of a mutually and non mutually events. topic in mathematics 10 .statistics and probability . probability of a mutually and non mutually events. topic in mathematics 10 .statistics and probability . probability of a mutually and non mutually events. topic in mathematics 10 .statistics and probability . probability of a mutually and non mutually events. topic in mathematics 10 .statistics and probability . probability of a mutually and non mutually events. topic in
Taking of a measurement and the process of counting yield numbers that contain information. The objective of a person applying the tools of statistics to these numbers is to determine the nature of this information.
This task is made much easier if the numbers are organized and summarized.
Even quite small data sets are difficult to understand without some summarization. Statistical quantities such as the mean and variance can be extremely helpful in summarizing data but first we discuss tabular and graphical summaries.
There are several ways to present a statistical data like;
Frequency table
Simple bar diagrams
Multiple Bar Diagrams
Histogram
Frequency Polygon etc.
Steam and Leaf plots
Pie Charts
A frequency distribution is a tabular arrangement of data in which various items are arranged into classes or groups and the number of items falling in each class is stated.
The number of observations falling in a particular class is referred to as class frequency and is denoted by "f".
In frequency distribution all the values falling in a class are assumed to be equal to the midpoint of that class.
Data presented in the form of a frequency distribution is also called grouped data. A frequency distribution table contains a condensed summary of the original data.
There are two types of frequency distribution i) Simple Frequency distribution ) ii) Grouped Frequency distribution.
Synthetic Fiber Construction in lab .pptxPavel ( NSTU)
Synthetic fiber production is a fascinating and complex field that blends chemistry, engineering, and environmental science. By understanding these aspects, students can gain a comprehensive view of synthetic fiber production, its impact on society and the environment, and the potential for future innovations. Synthetic fibers play a crucial role in modern society, impacting various aspects of daily life, industry, and the environment. ynthetic fibers are integral to modern life, offering a range of benefits from cost-effectiveness and versatility to innovative applications and performance characteristics. While they pose environmental challenges, ongoing research and development aim to create more sustainable and eco-friendly alternatives. Understanding the importance of synthetic fibers helps in appreciating their role in the economy, industry, and daily life, while also emphasizing the need for sustainable practices and innovation.
Model Attribute Check Company Auto PropertyCeline George
In Odoo, the multi-company feature allows you to manage multiple companies within a single Odoo database instance. Each company can have its own configurations while still sharing common resources such as products, customers, and suppliers.
How to Split Bills in the Odoo 17 POS ModuleCeline George
Bills have a main role in point of sale procedure. It will help to track sales, handling payments and giving receipts to customers. Bill splitting also has an important role in POS. For example, If some friends come together for dinner and if they want to divide the bill then it is possible by POS bill splitting. This slide will show how to split bills in odoo 17 POS.
How to Make a Field invisible in Odoo 17Celine George
It is possible to hide or invisible some fields in odoo. Commonly using “invisible” attribute in the field definition to invisible the fields. This slide will show how to make a field invisible in odoo 17.
2024.06.01 Introducing a competency framework for languag learning materials ...Sandy Millin
http://sandymillin.wordpress.com/iateflwebinar2024
Published classroom materials form the basis of syllabuses, drive teacher professional development, and have a potentially huge influence on learners, teachers and education systems. All teachers also create their own materials, whether a few sentences on a blackboard, a highly-structured fully-realised online course, or anything in between. Despite this, the knowledge and skills needed to create effective language learning materials are rarely part of teacher training, and are mostly learnt by trial and error.
Knowledge and skills frameworks, generally called competency frameworks, for ELT teachers, trainers and managers have existed for a few years now. However, until I created one for my MA dissertation, there wasn’t one drawing together what we need to know and do to be able to effectively produce language learning materials.
This webinar will introduce you to my framework, highlighting the key competencies I identified from my research. It will also show how anybody involved in language teaching (any language, not just English!), teacher training, managing schools or developing language learning materials can benefit from using the framework.
How to Create Map Views in the Odoo 17 ERPCeline George
The map views are useful for providing a geographical representation of data. They allow users to visualize and analyze the data in a more intuitive manner.
The Art Pastor's Guide to Sabbath | Steve ThomasonSteve Thomason
What is the purpose of the Sabbath Law in the Torah. It is interesting to compare how the context of the law shifts from Exodus to Deuteronomy. Who gets to rest, and why?
The Roman Empire A Historical Colossus.pdfkaushalkr1407
The Roman Empire, a vast and enduring power, stands as one of history's most remarkable civilizations, leaving an indelible imprint on the world. It emerged from the Roman Republic, transitioning into an imperial powerhouse under the leadership of Augustus Caesar in 27 BCE. This transformation marked the beginning of an era defined by unprecedented territorial expansion, architectural marvels, and profound cultural influence.
The empire's roots lie in the city of Rome, founded, according to legend, by Romulus in 753 BCE. Over centuries, Rome evolved from a small settlement to a formidable republic, characterized by a complex political system with elected officials and checks on power. However, internal strife, class conflicts, and military ambitions paved the way for the end of the Republic. Julius Caesar’s dictatorship and subsequent assassination in 44 BCE created a power vacuum, leading to a civil war. Octavian, later Augustus, emerged victorious, heralding the Roman Empire’s birth.
Under Augustus, the empire experienced the Pax Romana, a 200-year period of relative peace and stability. Augustus reformed the military, established efficient administrative systems, and initiated grand construction projects. The empire's borders expanded, encompassing territories from Britain to Egypt and from Spain to the Euphrates. Roman legions, renowned for their discipline and engineering prowess, secured and maintained these vast territories, building roads, fortifications, and cities that facilitated control and integration.
The Roman Empire’s society was hierarchical, with a rigid class system. At the top were the patricians, wealthy elites who held significant political power. Below them were the plebeians, free citizens with limited political influence, and the vast numbers of slaves who formed the backbone of the economy. The family unit was central, governed by the paterfamilias, the male head who held absolute authority.
Culturally, the Romans were eclectic, absorbing and adapting elements from the civilizations they encountered, particularly the Greeks. Roman art, literature, and philosophy reflected this synthesis, creating a rich cultural tapestry. Latin, the Roman language, became the lingua franca of the Western world, influencing numerous modern languages.
Roman architecture and engineering achievements were monumental. They perfected the arch, vault, and dome, constructing enduring structures like the Colosseum, Pantheon, and aqueducts. These engineering marvels not only showcased Roman ingenuity but also served practical purposes, from public entertainment to water supply.
Unit 8 - Information and Communication Technology (Paper I).pdfThiyagu K
This slides describes the basic concepts of ICT, basics of Email, Emerging Technology and Digital Initiatives in Education. This presentations aligns with the UGC Paper I syllabus.
3. Steps in calculating Median of grouped data
• Make the frequency distribution table.
• Make a column for the less than cumulative frequency (<cf)
• Find for the median class using 𝑚𝑑 𝑐𝑙𝑎𝑠𝑠 =
𝑁
2
• Locate the median class in your table by looking at the
cumulative frequency where it lies, then put markings in the
class.
• Calculate the median from grouped data:
𝑥 = 𝐿 +
𝑛
2
− 𝐹2
𝑓2
𝑖
Where: L=exact lower limit of the interval where the median lies
𝑛
2
= 𝑚𝑒𝑑𝑖𝑎𝑛 𝑐𝑙𝑎𝑠𝑠; i=class interval; 𝑓2=frequency of median class
𝐹2=cumulative frequency up to the class immediately preceding the median class
5. Make the frequency distribution table.
Class interval tally frequency
84 – 86 2
81 – 83 4
78 – 80 3
75 – 77 5
72 – 74 5
69 – 71 4
66 – 68 3
63 - 65 3
60 -62 1
N = 30
6. Make a column for the less than cumulative frequency (<cf)
Class
interval
f <cf
84 – 86 2 30
81 – 83 4 28
78 – 80 3 24
75 – 77 5 21
72 – 74 5 16
69 – 71 4 11
66 – 68 3 7
63 - 65 3 4
60 -62 1 1
N = 30
To find the cumulative frequency start
at the bottom by copying the
frequency in the lowest class interval.
Then to get the next cumulative
frequency simply add the preceding
frequency.
1 + 3 = 4
4 + 3 = 7
7 + 4 = 11
7. Find for the median class using 𝑚𝑑 𝑐𝑙𝑎𝑠𝑠 =
𝑁
2
Class
interval
f <cf
84 – 86 2 30
81 – 83 4 28
78 – 80 3 24
75 – 77 5 21
72 – 74 5 16
69 – 71 4 11
66 – 68 3 7
63 - 65 3 4
60 -62 1 1
N = 30
𝑚𝑑 𝑐𝑙𝑎𝑠𝑠 =
𝑁
2
𝑚𝑑 𝑐𝑙𝑎𝑠𝑠 =
30
2
𝒎𝒅 𝒄𝒍𝒂𝒔𝒔 = 𝟏𝟓
8. Locate the median class in your table by looking at the cumulative
frequency where it lies, then put markings in the class.
Class
interval
f <cf
84 – 86 2 30
81 – 83 4 28
78 – 80 3 24
75 – 77 5 21
72 – 74 5 16
69 – 71 4 11
66 – 68 3 7
63 - 65 3 4
60 -62 1 1
N = 30
𝒎𝒅 𝒄𝒍𝒂𝒔𝒔 = 𝟏𝟓
Note: when the computed
md class is not present in the
<cf column, choose the
number higher than but
nearer the computed md class.
In this case the computed md
class which is 15 is not present
In the <cf column, so we will
choose the number higher to
It which is 16.
Put markings in the class where
It lies.
9. Calculate the median from grouped data.
Class
interval
f <cf
84 – 86 2 30
81 – 83 4 28
78 – 80 3 24
75 – 77 5 21
72 – 74 5 16
69 – 71 4 11
66 – 68 3 7
63 - 65 3 4
60 -62 1 1
N = 30
𝑥 = 𝐿 +
𝑛
2
− 𝐹2
𝑓2
𝑖
Where: L=exact lower limit of the class
interval where the median class lies
𝑛
2
= 𝑚𝑒𝑑𝑖𝑎𝑛 𝑐𝑙𝑎𝑠𝑠; i=class interval;
𝑓2=frequency of median class
𝐹2=cumulative frequency up to the
class immediately preceding the
median class
L = LS of the md class – 0.5
L = 72 – 0.5
L = 71.5
10. Calculate the median from grouped data.
Class
interval
f <cf
84 – 86 2 30
81 – 83 4 28
78 – 80 3 24
75 – 77 5 21
72 – 74 5 16
69 – 71 4 11
66 – 68 3 7
63 - 65 3 4
60 -62 1 1
N = 30
𝑥 = 𝐿 +
𝑛
2
− 𝐹2
𝑓2
𝑖
Where: L=exact lower limit of the class
interval where the median class lies
𝑛
2
= 𝑚𝑒𝑑𝑖𝑎𝑛 𝑐𝑙𝑎𝑠𝑠; i=class interval;
𝑓2=frequency of median class
𝐹2=cumulative frequency up to the
class immediately preceding the
median class
L = 71.5
𝑛
2
= 15
𝑖 = 3
𝐹2 = 11
𝑓2 = 5
11. Calculate the median from grouped data.
Class
interval
f <cf
84 – 86 2 30
81 – 83 4 28
78 – 80 3 24
75 – 77 5 21
72 – 74 5 16
69 – 71 4 11
66 – 68 3 7
63 - 65 3 4
60 -62 1 1
N = 30
𝑥 = 𝐿 +
𝑛
2
− 𝐹2
𝑓2
𝑖
L = 71.5 𝐹2 = 11 𝑖 = 3
𝑛
2
= 15 𝑓2 = 5
𝑥 = 71.5 +
15 − 11
5
3
𝑥 =73.9
Note: The median must be in two
decimal places only. And also the
answer in the median must lies in the
median class.