Download as PDF, PPTX
![Median
• What is the mean of [0.1 0.8 0.4 0.3 0.1
0.4 9.0 0.1 0.9 0.3 1.0 0.3
0.1]
• Guess without calculation – Around 0.5?
• Now calculate the mean
Venkat Reddy
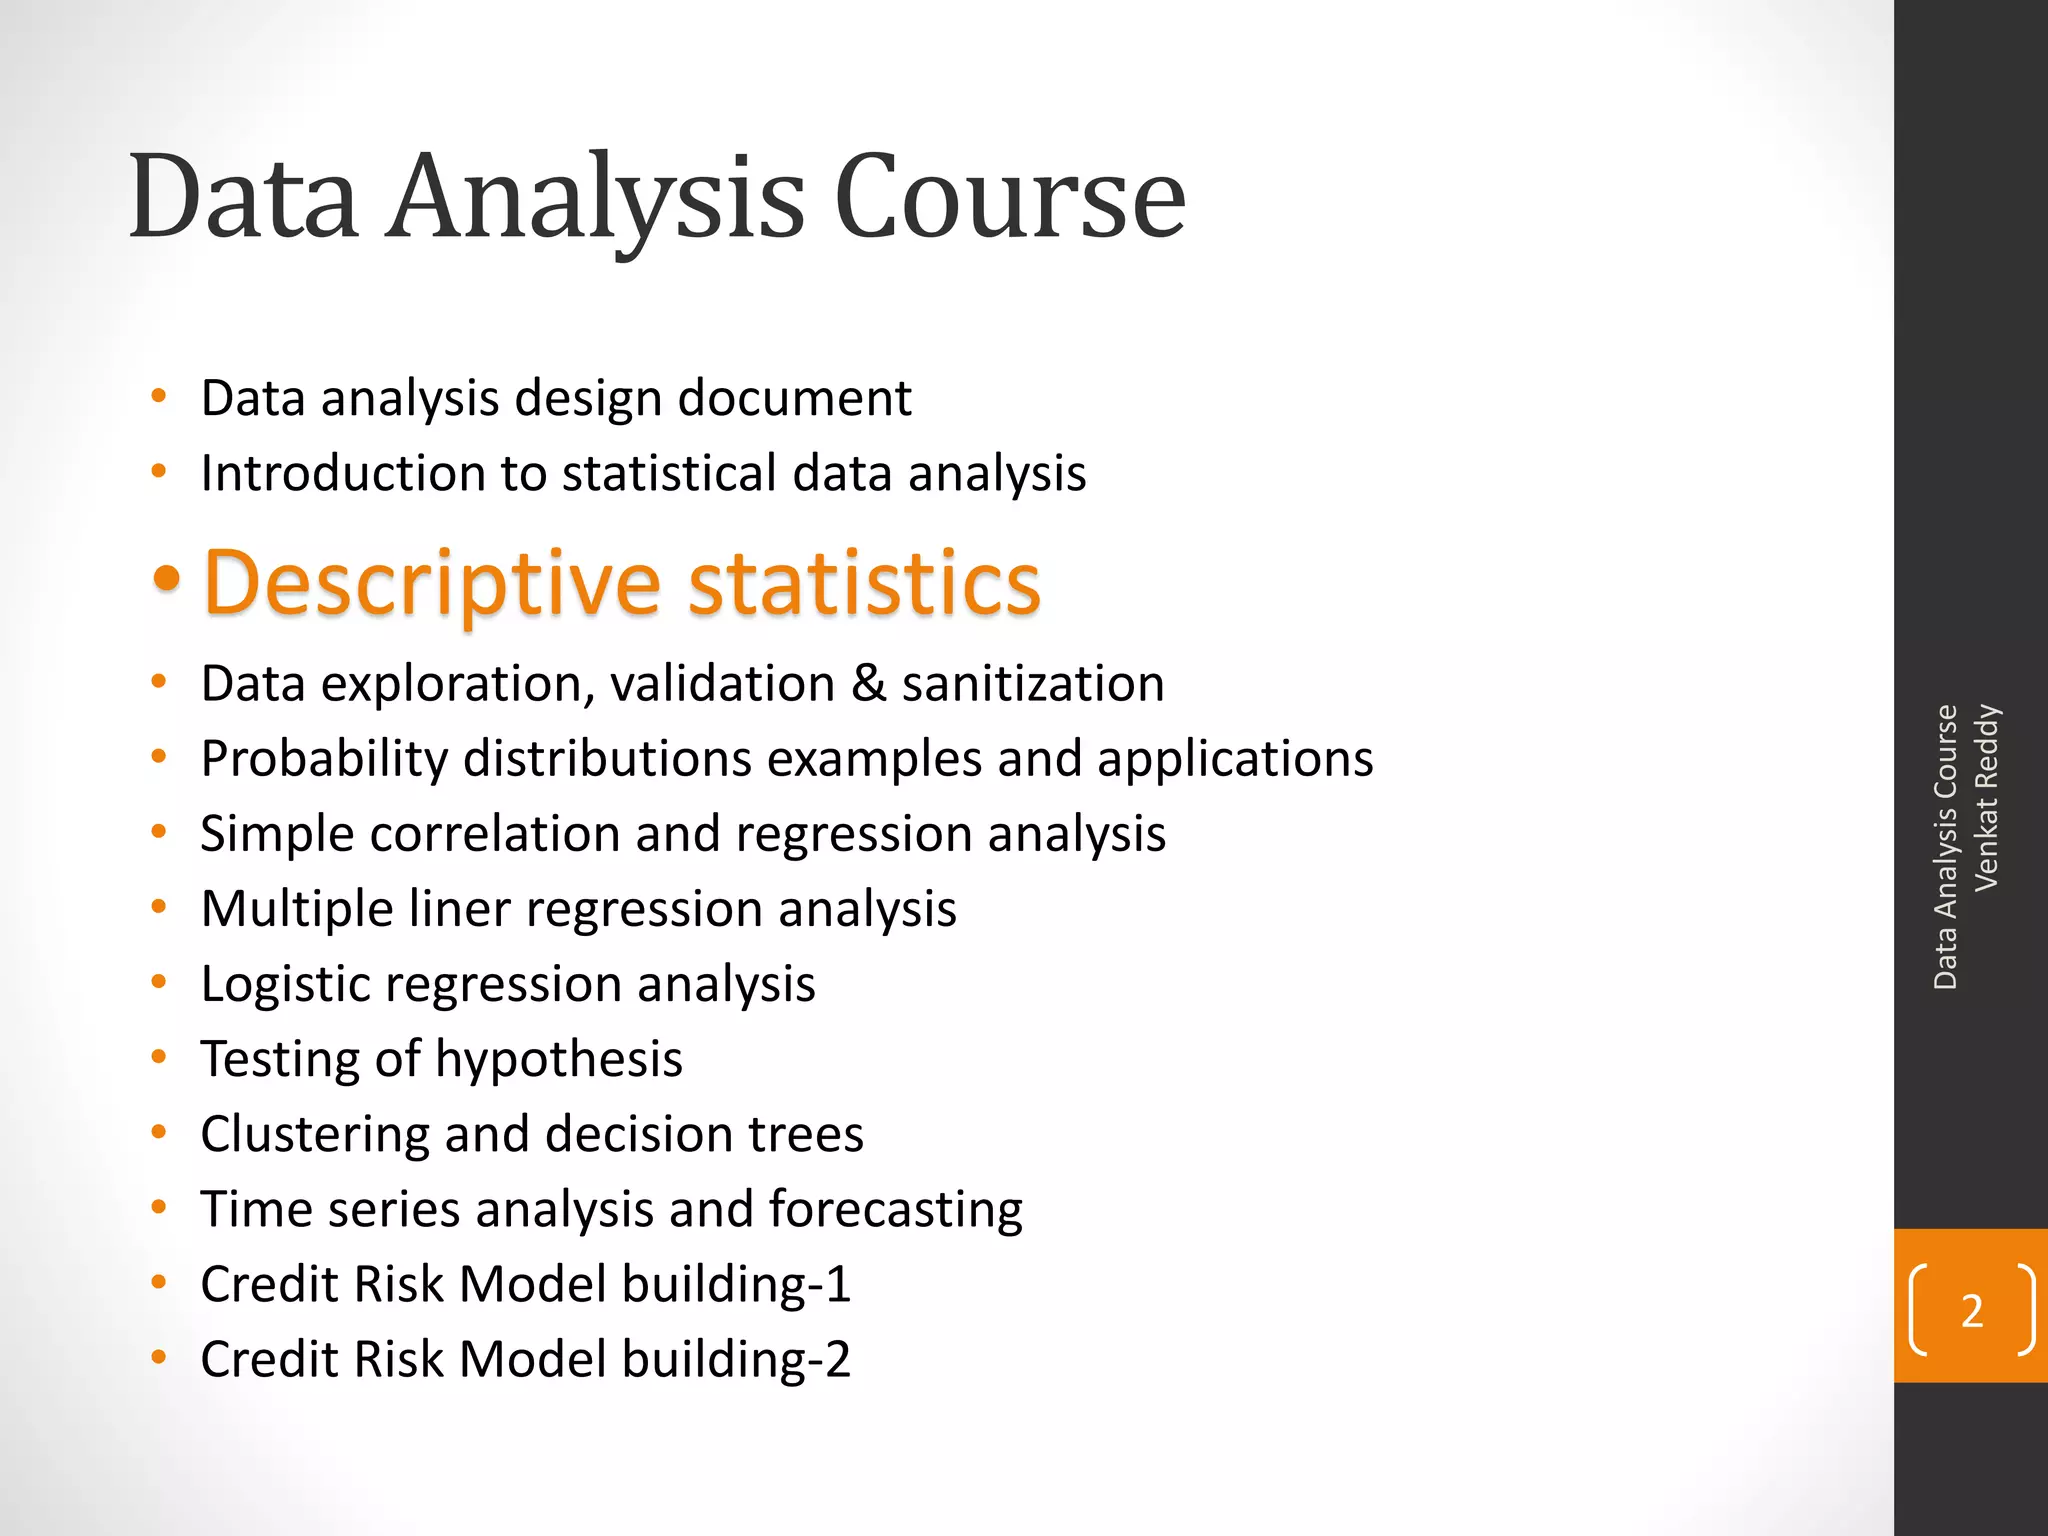
Data Analysis Course
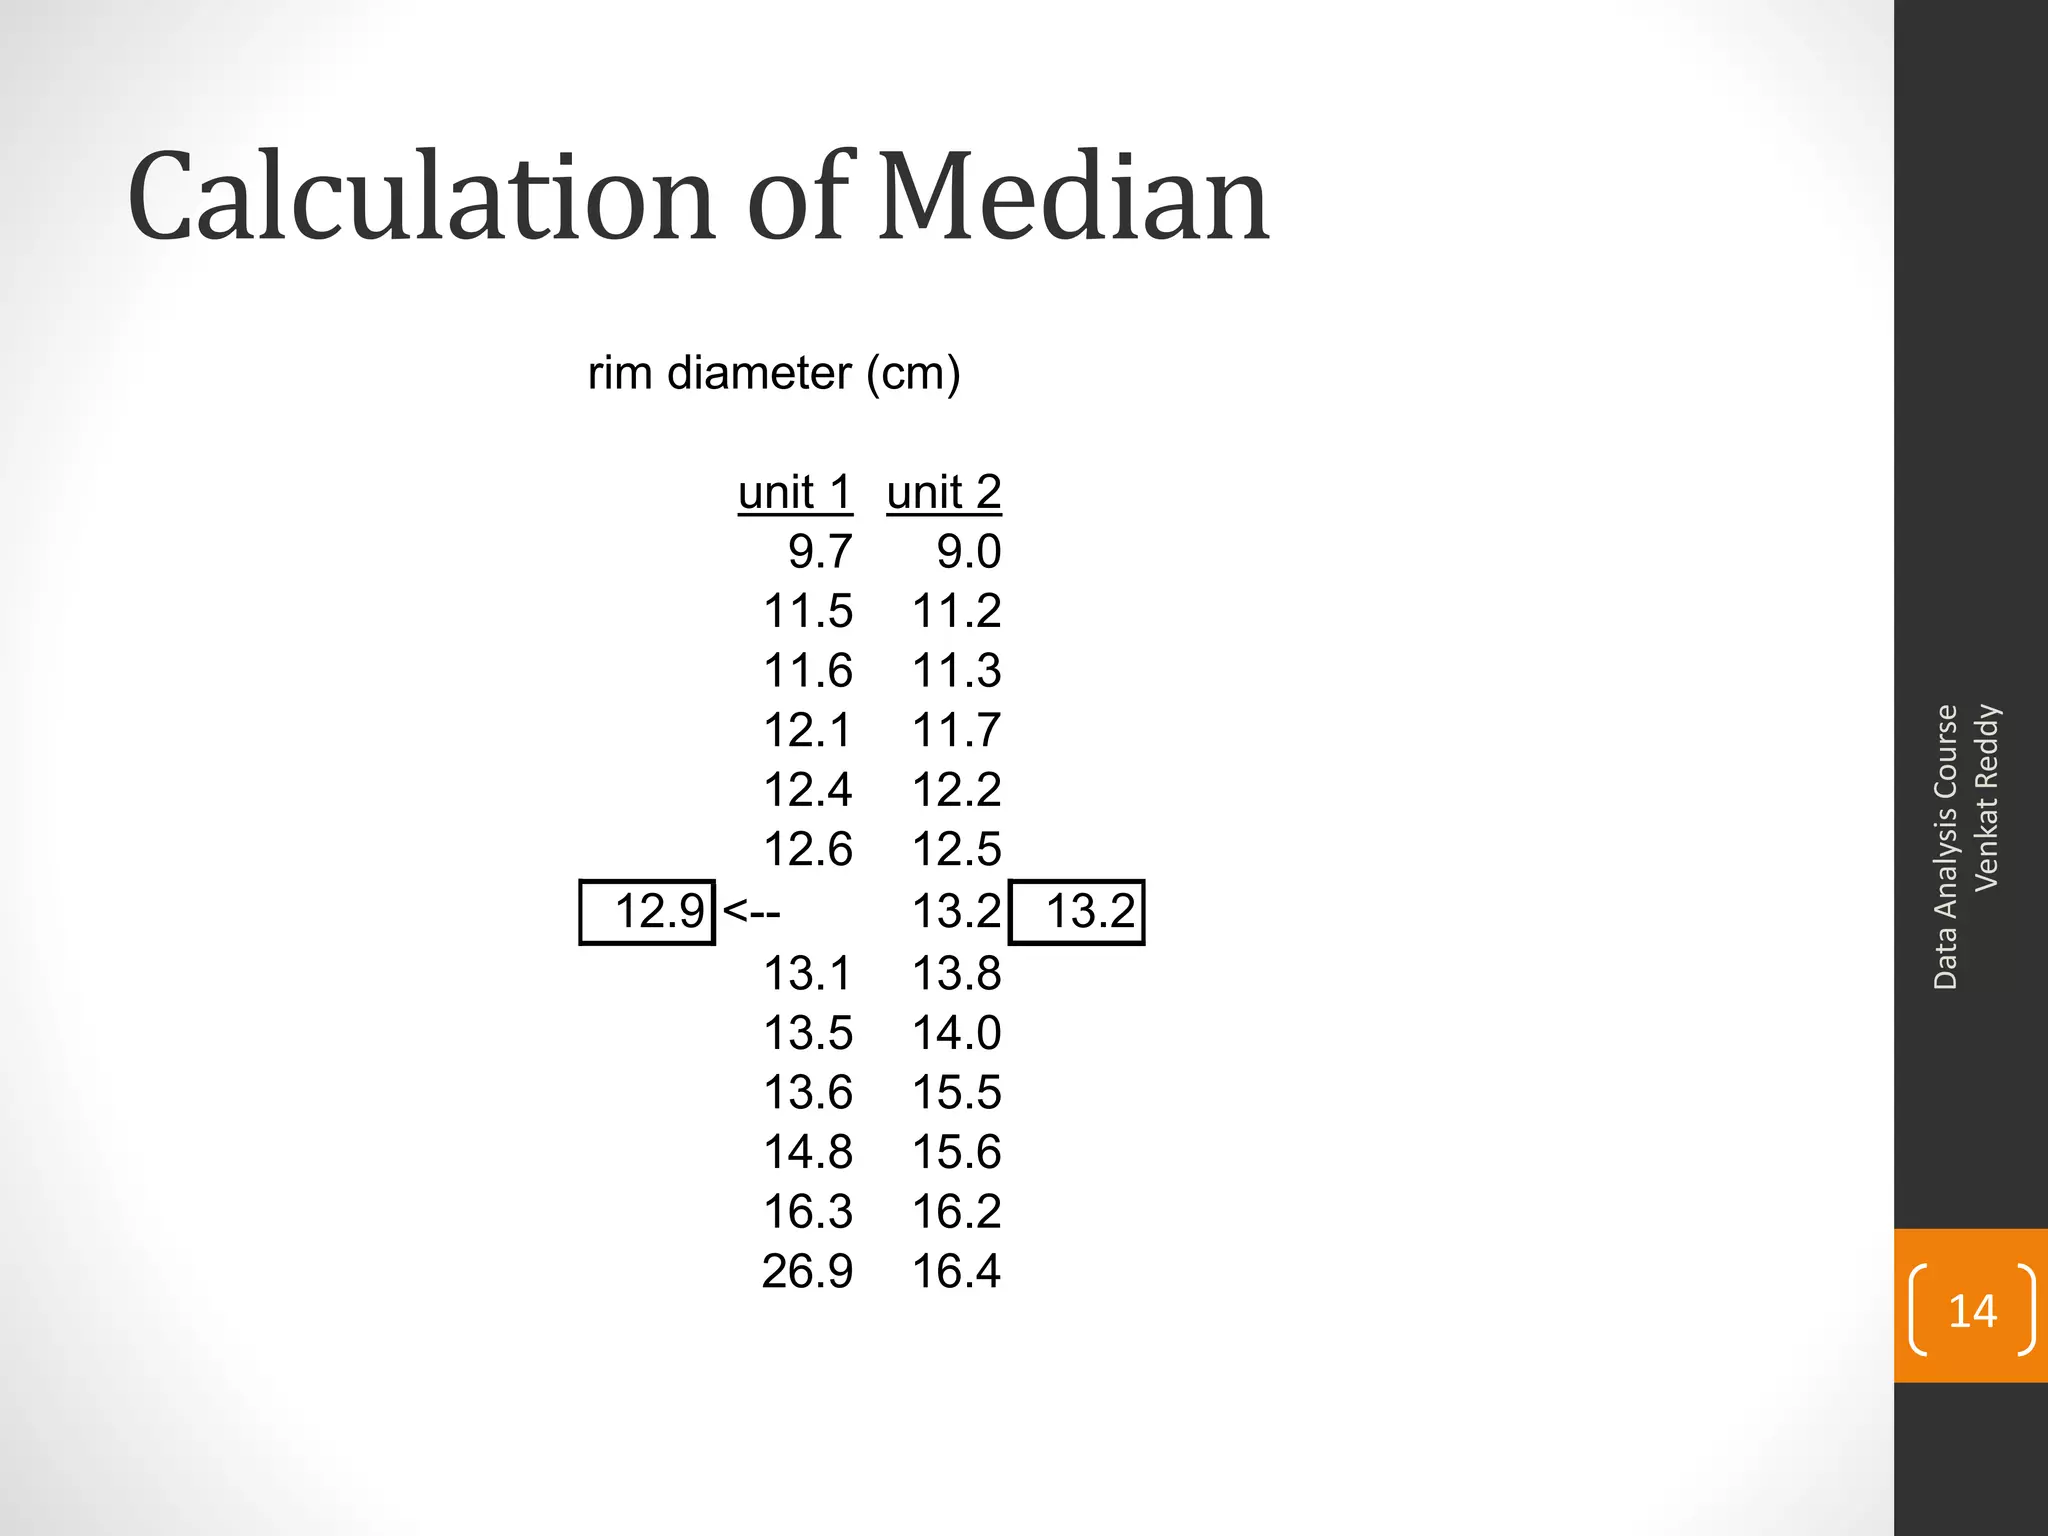
• Median is exactly in the middle. Isn’t mean exactly in the
middle
• Order the observations in ascending or descending order and
pick the middle observation
• less useful for inferential purposes
13
• More resistant to effects of outliers…](https://image.slidesharecdn.com/descriptivestatistics-130320062717-phpapp02/75/Descriptive-statistics-13-2048.jpg)


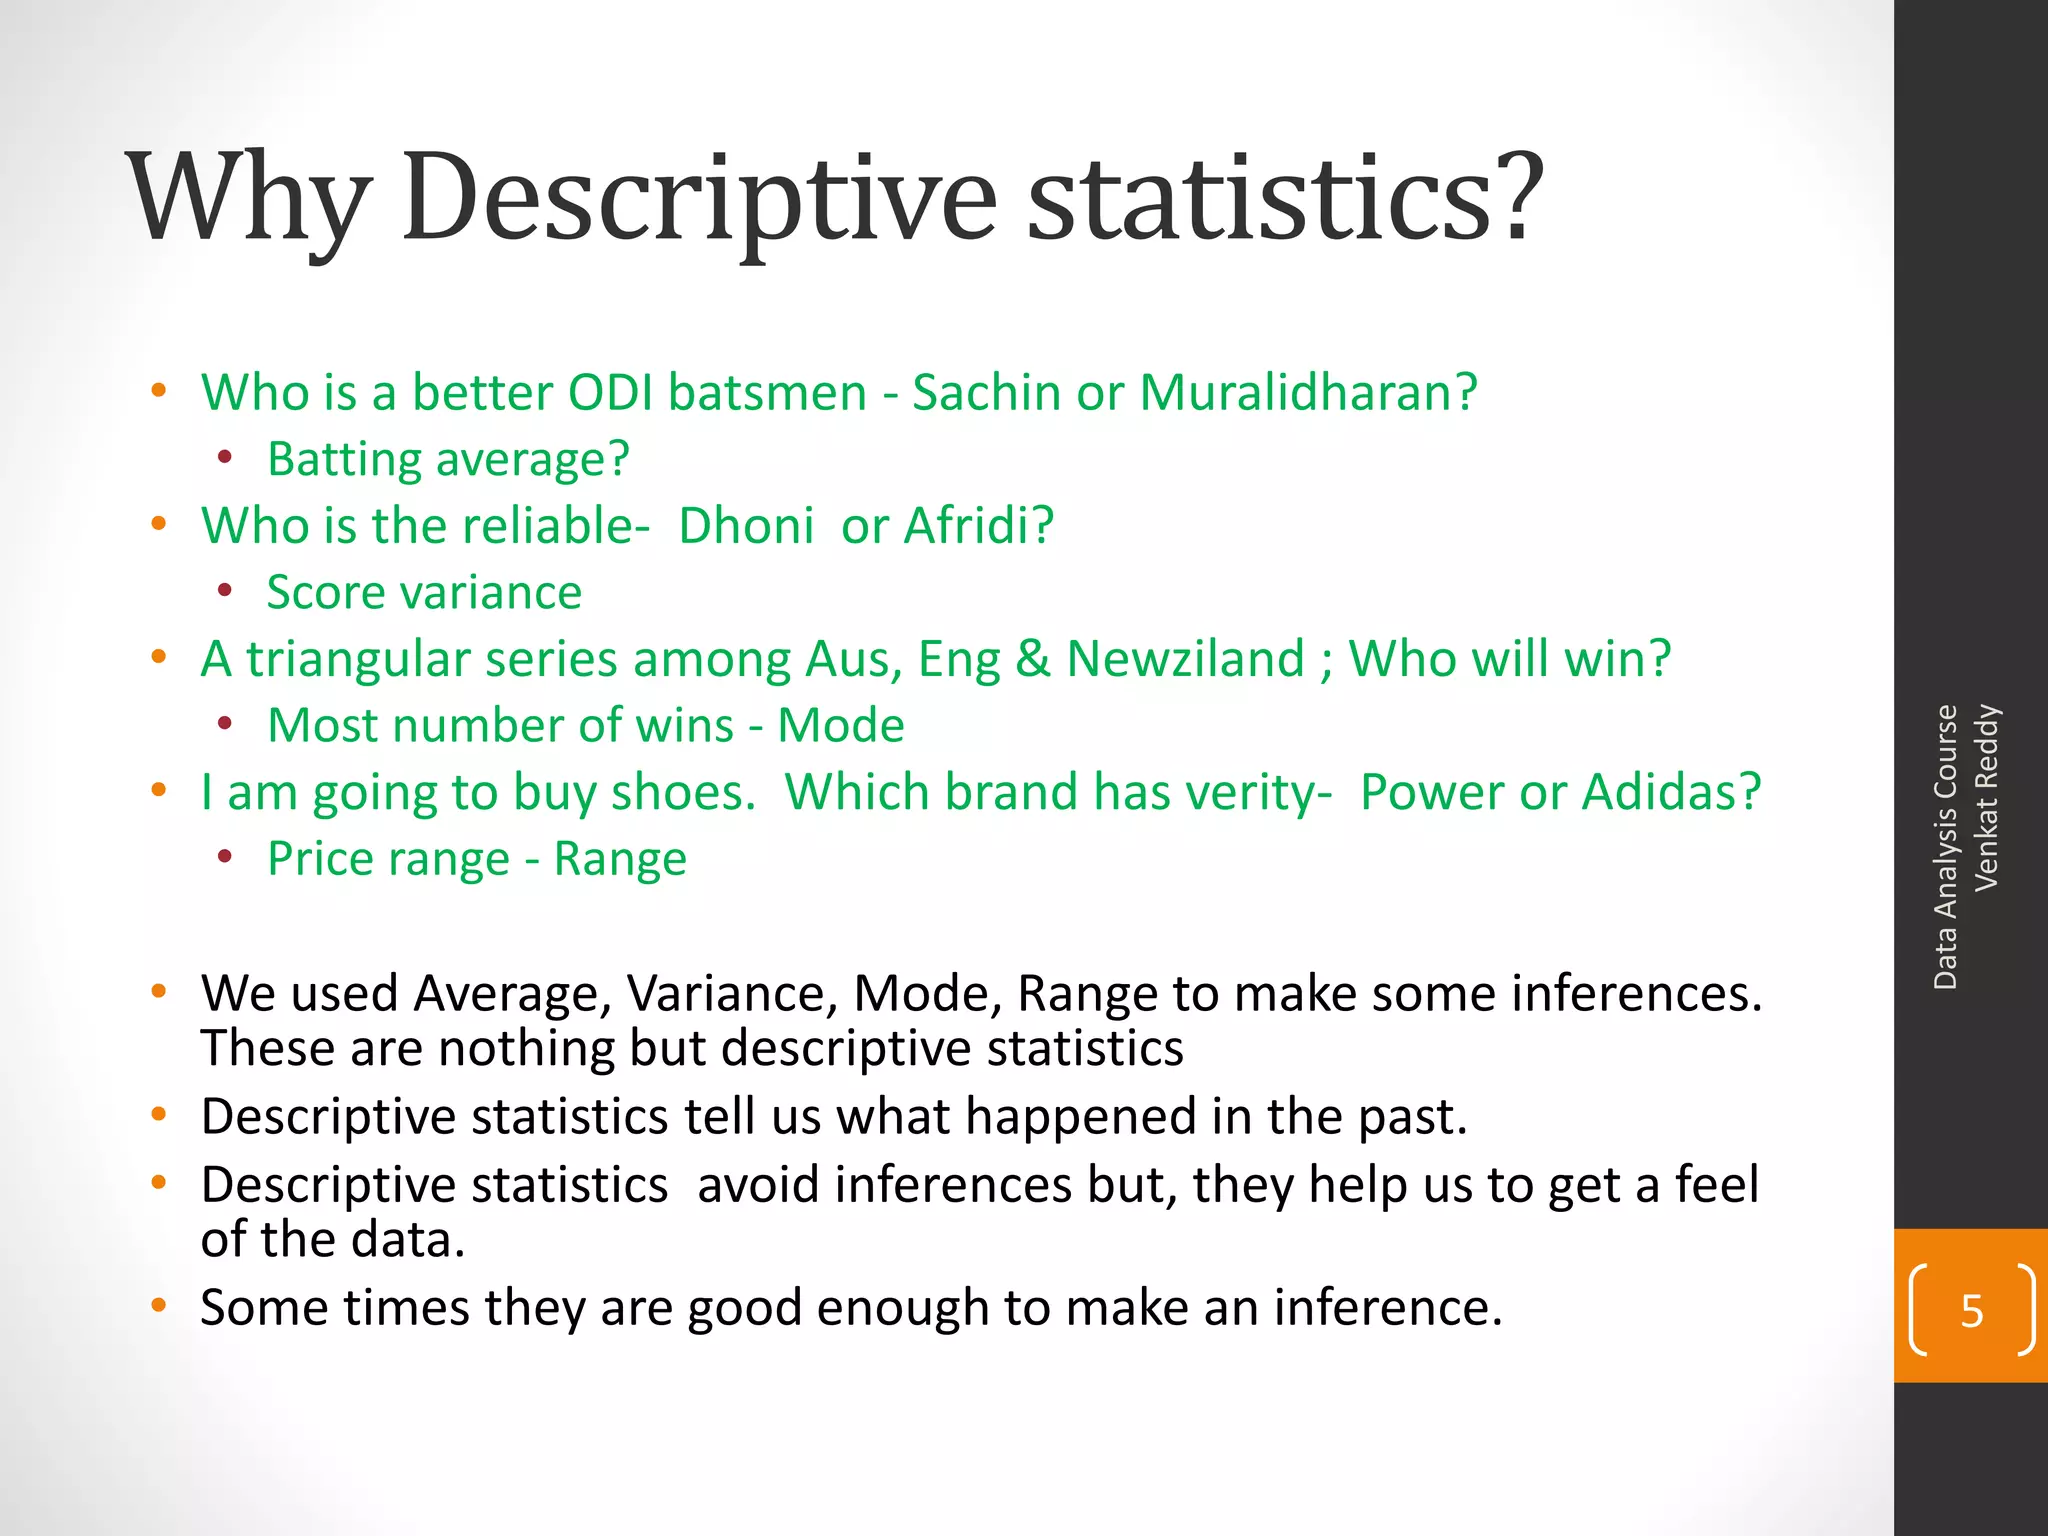
This document provides an overview of a data analysis course that covers topics such as descriptive statistics, probability distributions, correlation, regression, hypothesis testing, clustering, and time series analysis. The course introduces descriptive statistics including measures of central tendency, dispersion, frequency distributions, and histograms. Notes are provided on calculating and interpreting mean, median, mode, range, variance, standard deviation, and other descriptive statistics.
Introduction to the Data Analysis course covering descriptive statistics, data validation, and various statistical analyses.
Presentation serves as class notes; content is a high-level summary of in-depth training.
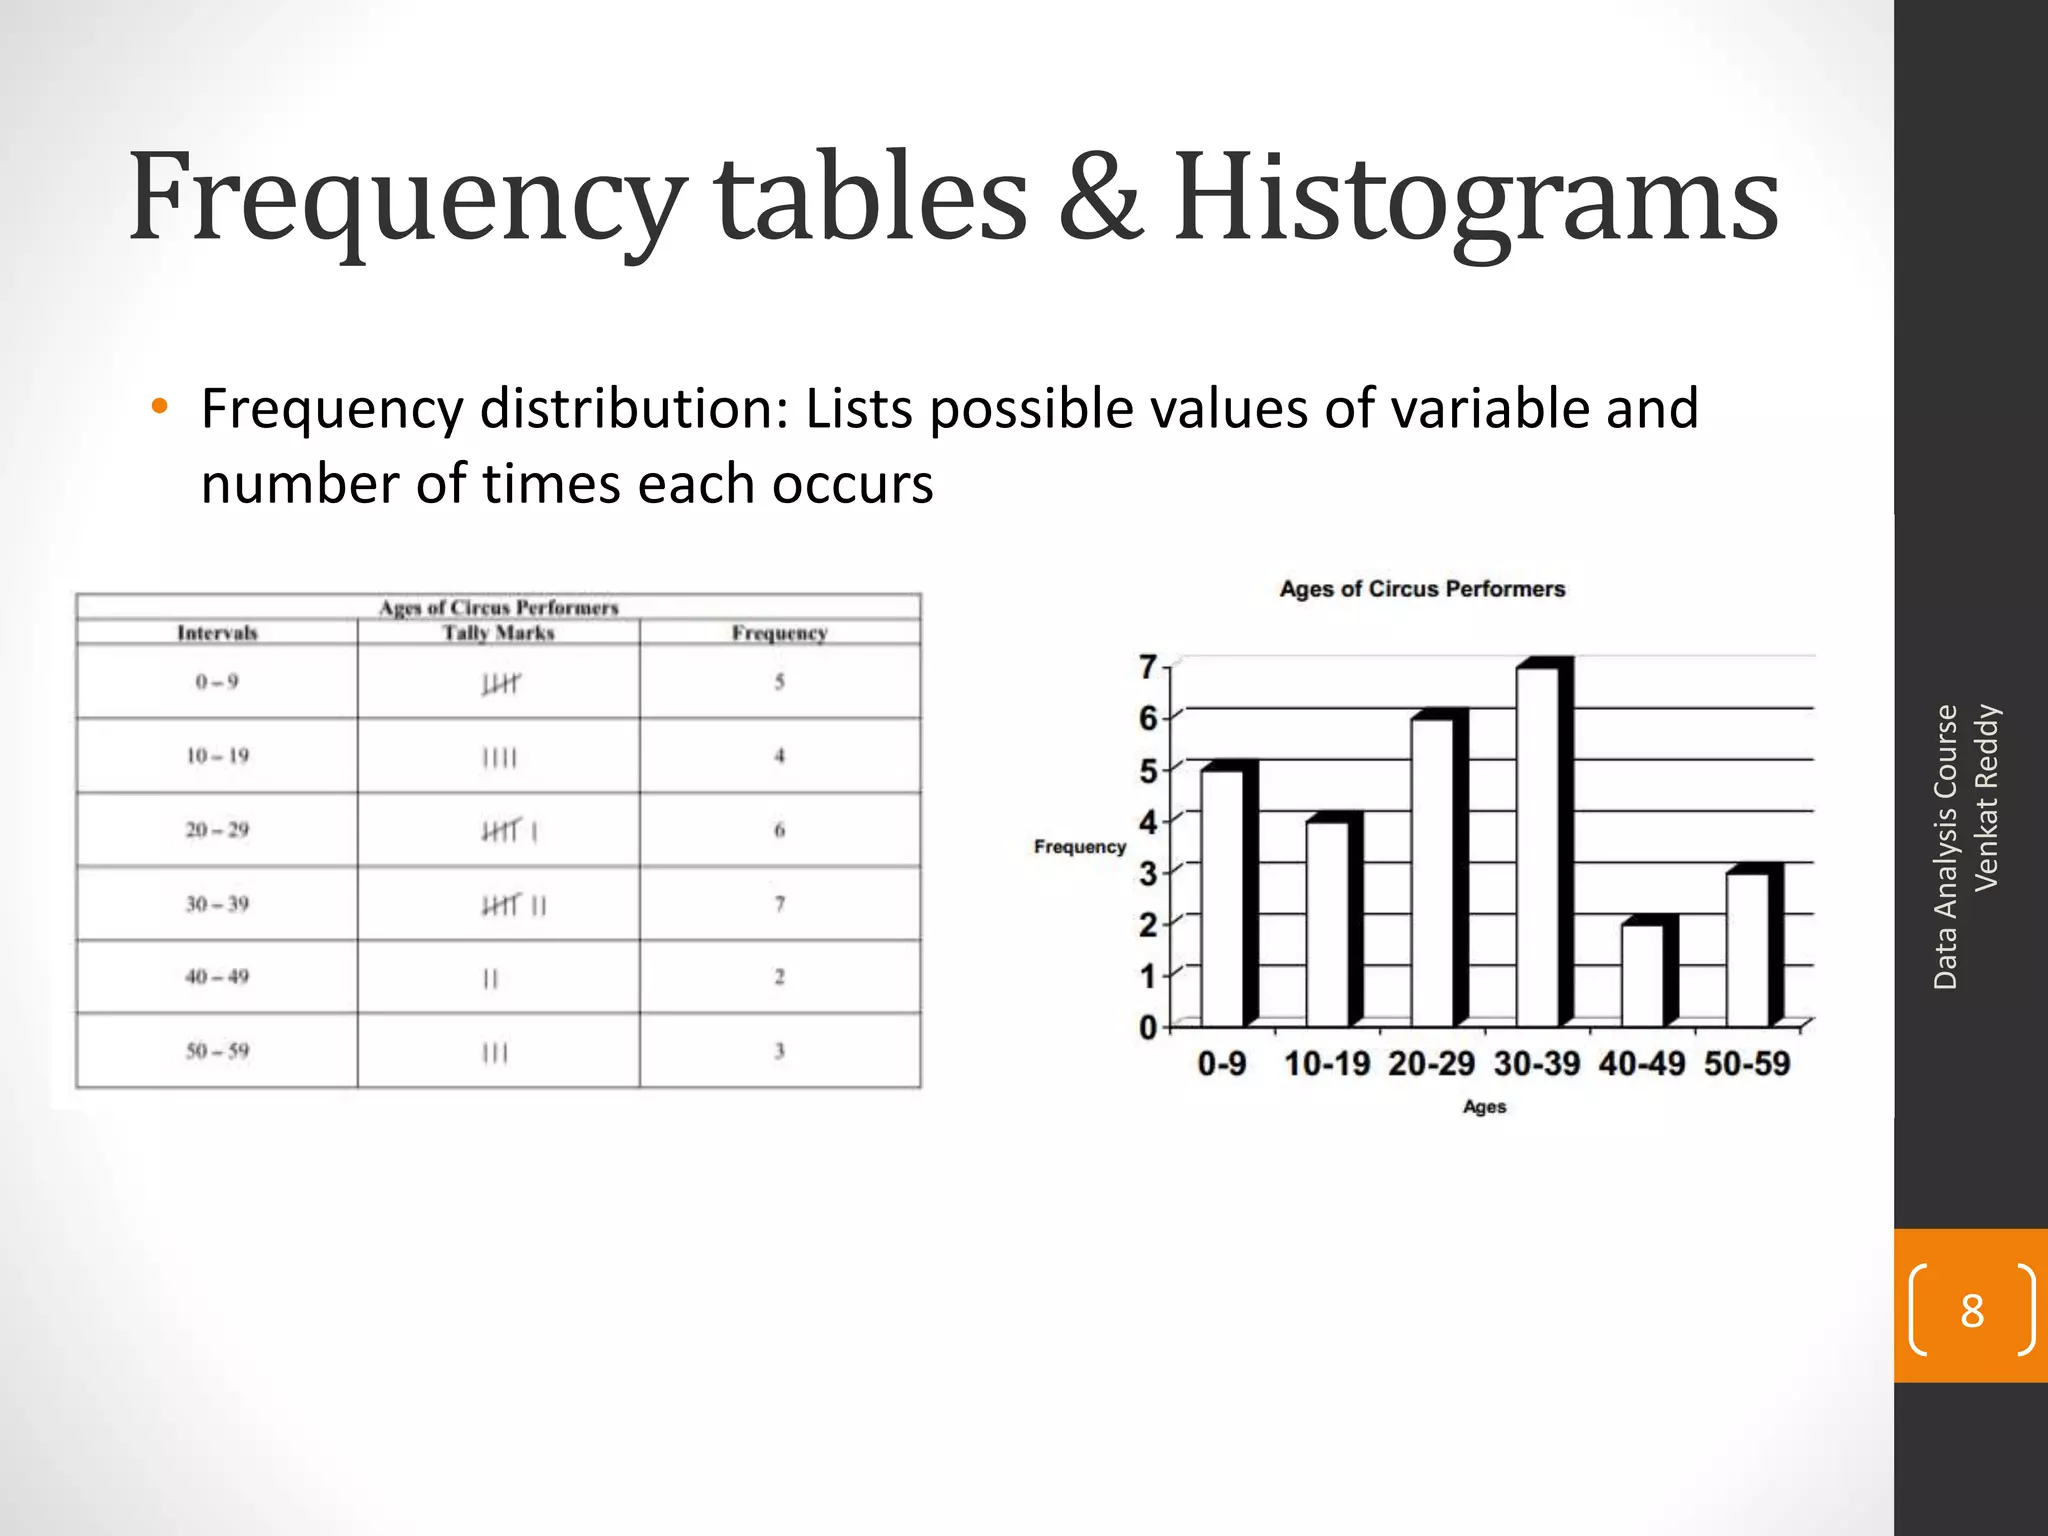
Descriptive statistics explained, including frequency tables, central tendency (mean, median, mode), and variability.
Simple descriptive statistics such as sum, average, minimum, maximum, and frequency distribution using histograms.
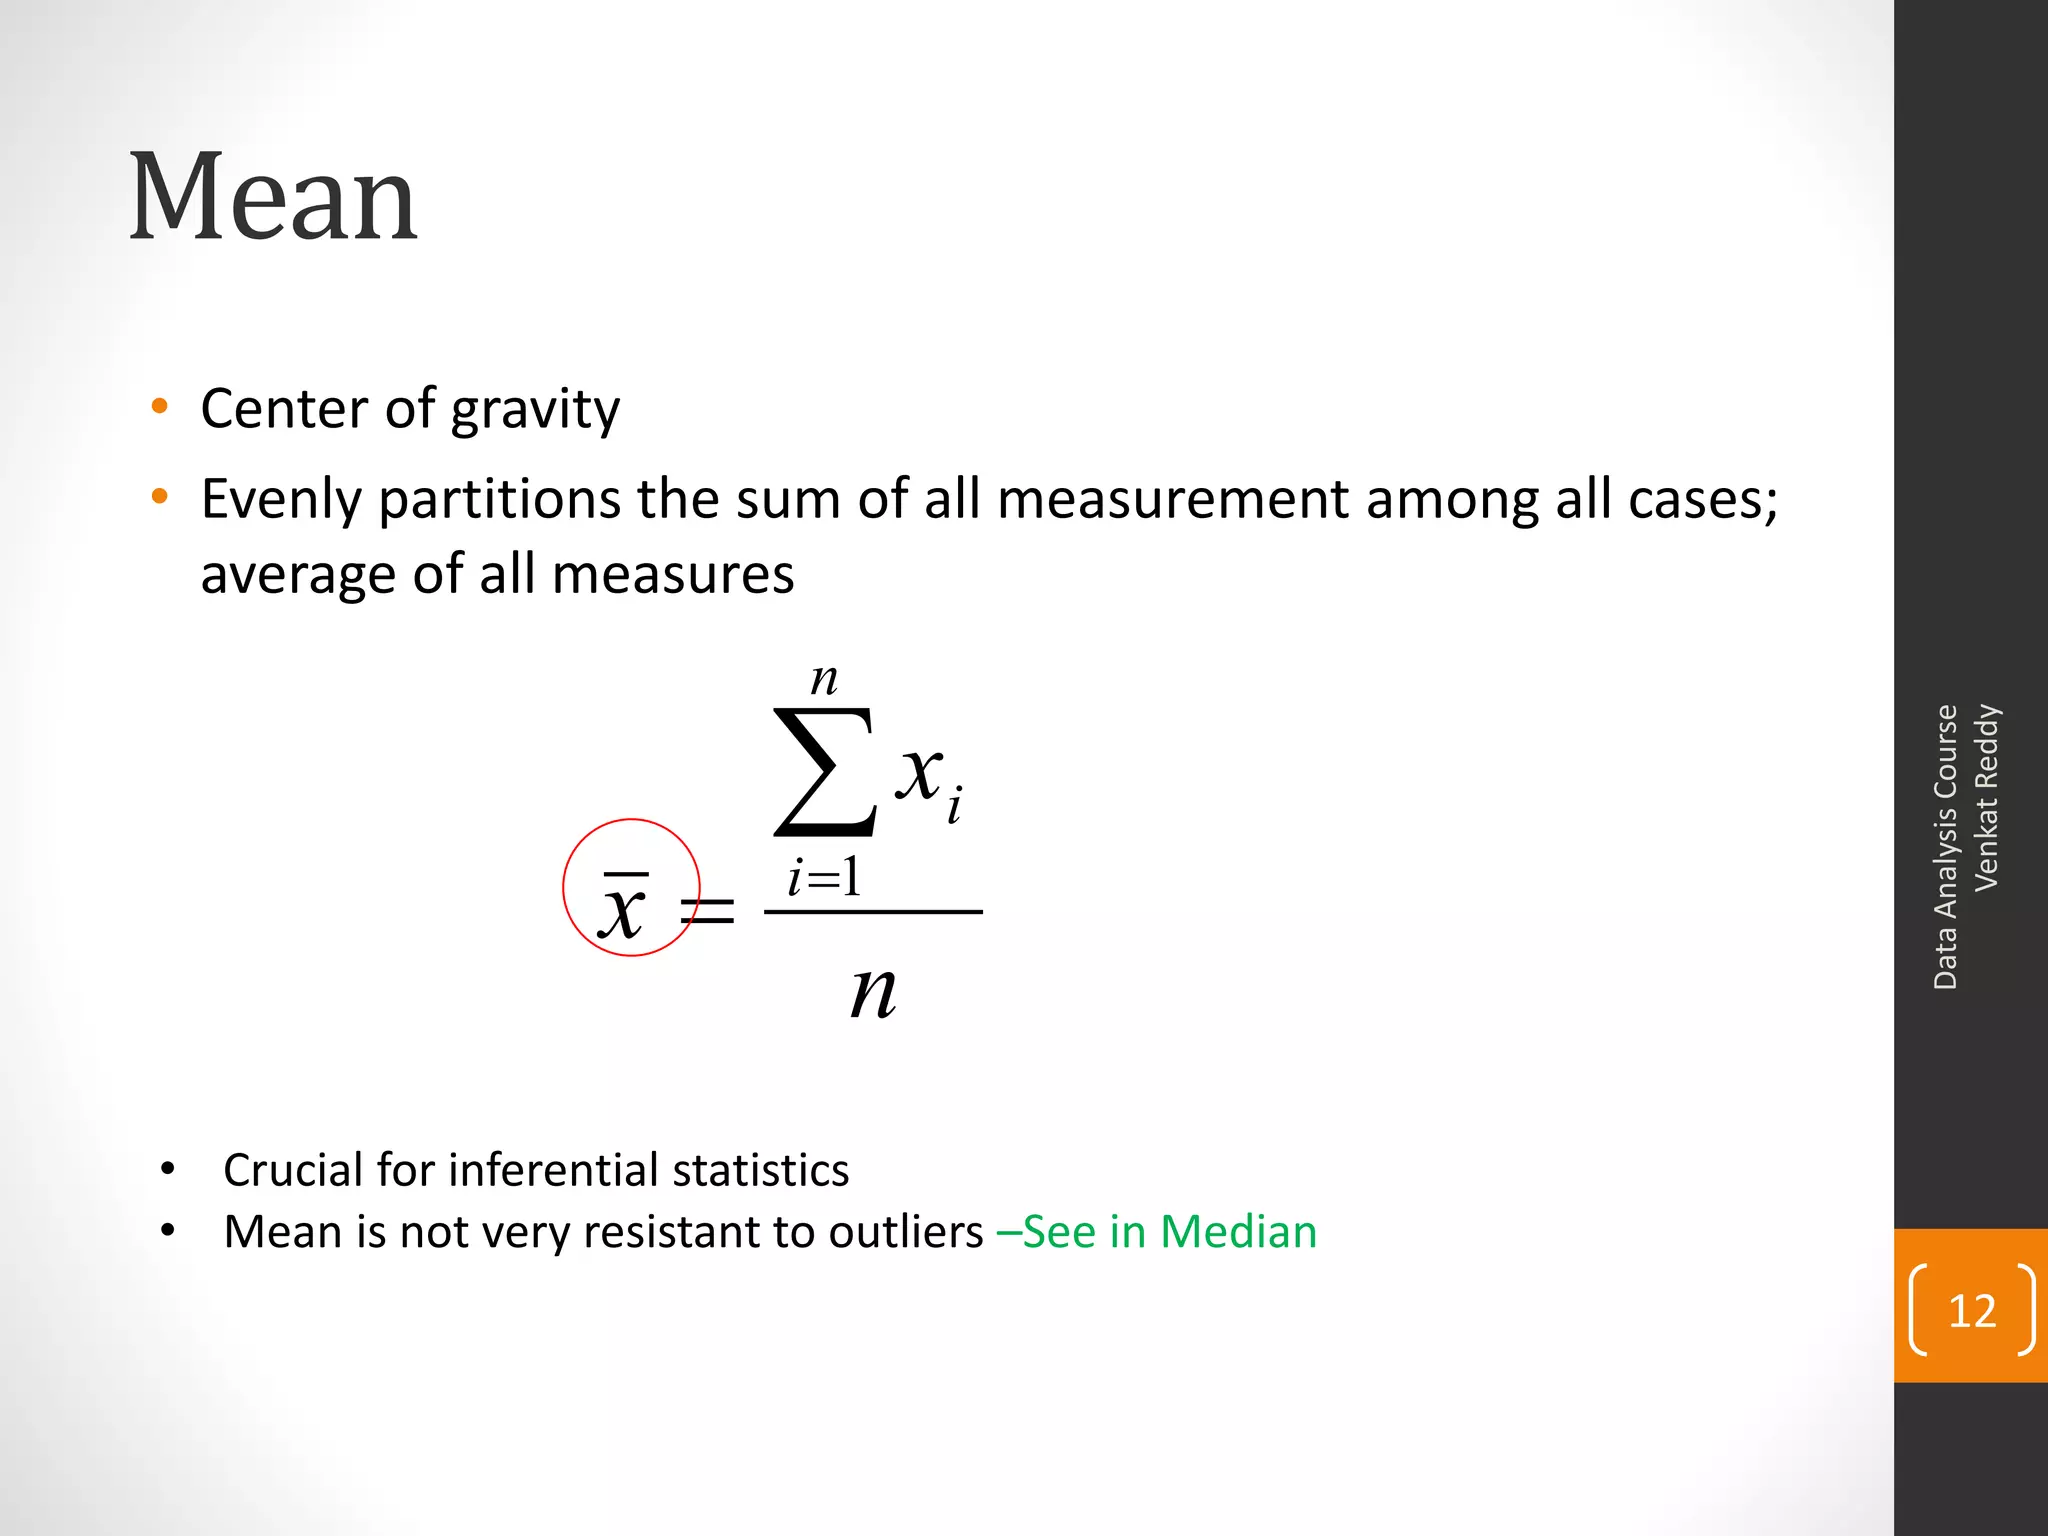
Detail on central tendency measures: mean, median, and mode, along with their calculations and implications.
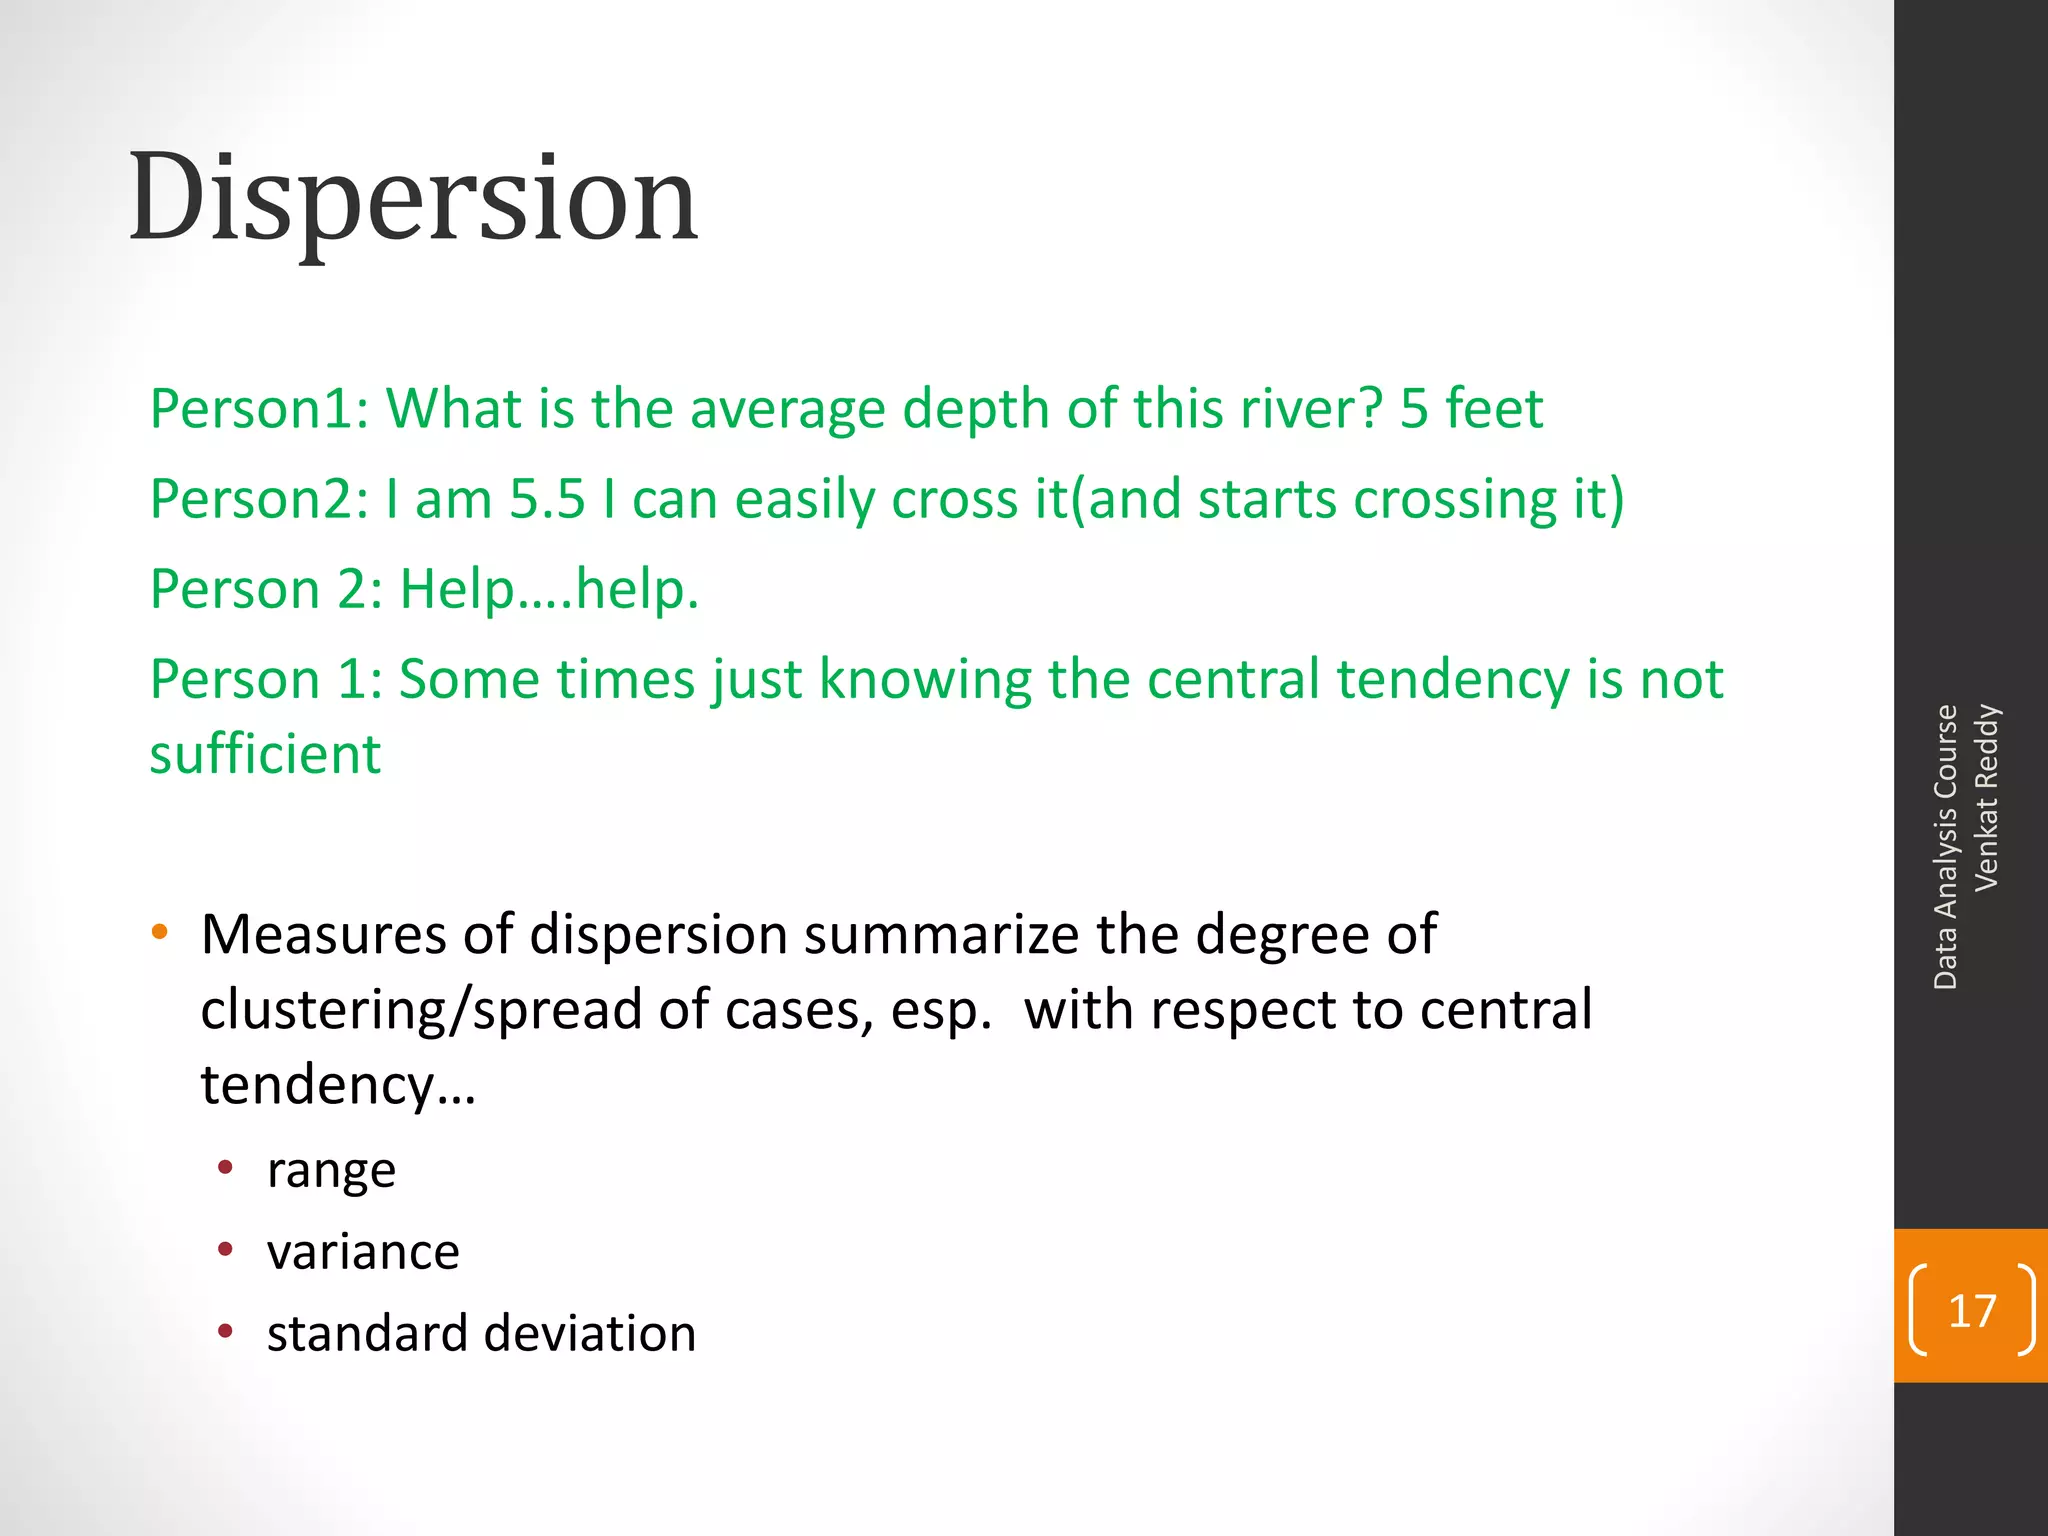
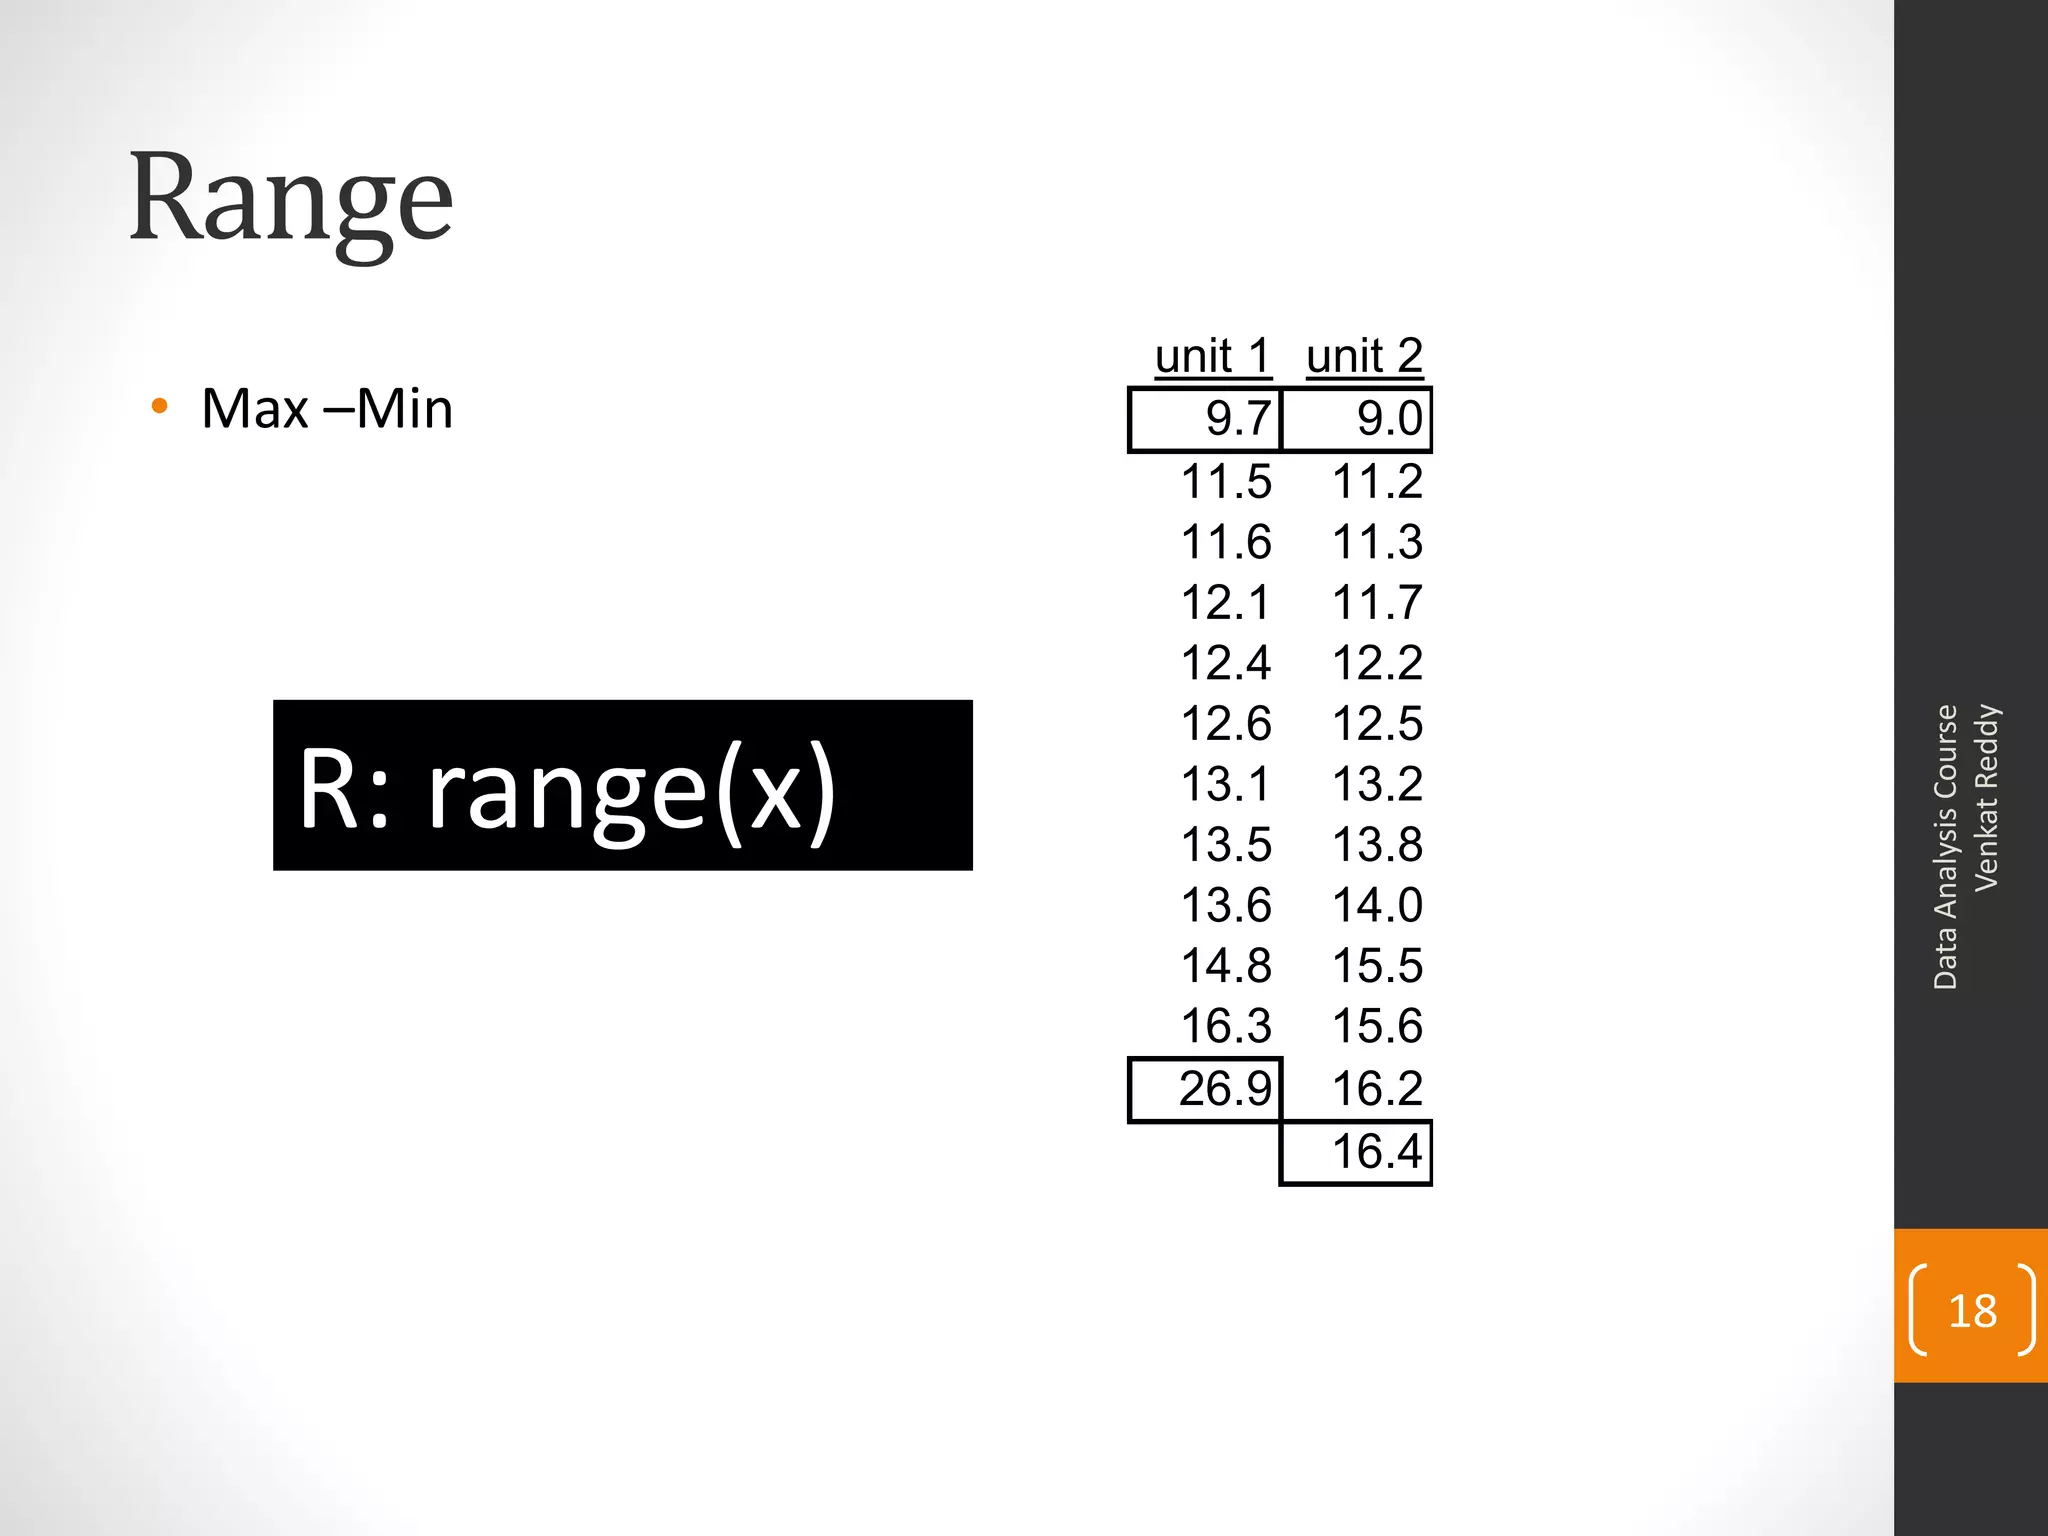
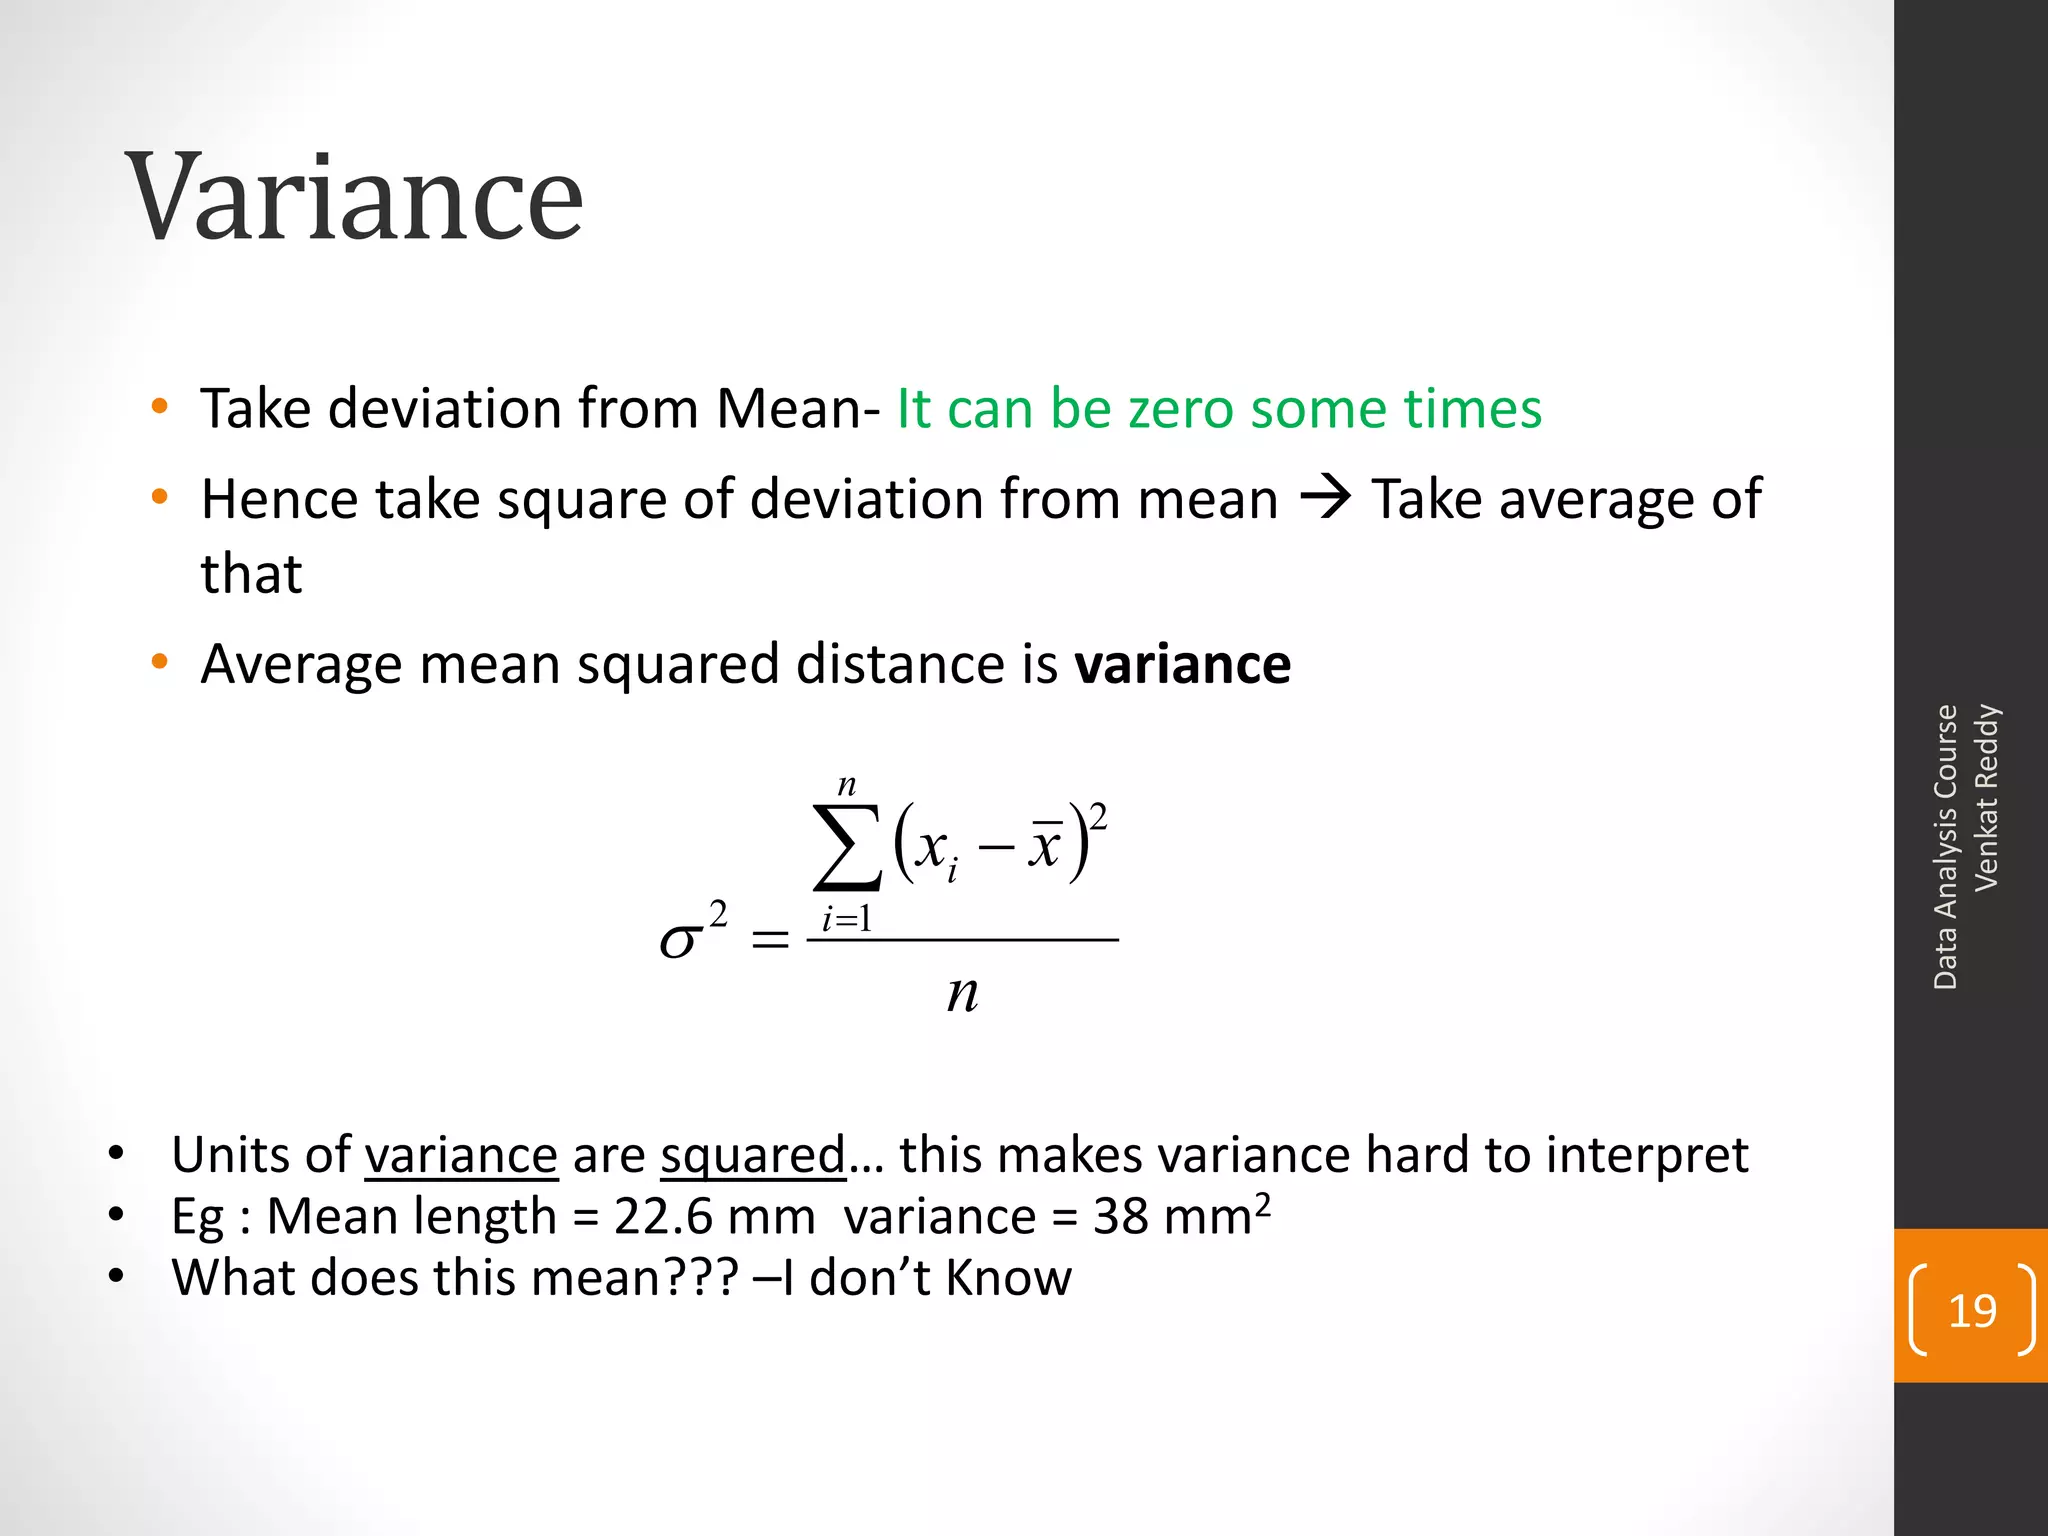
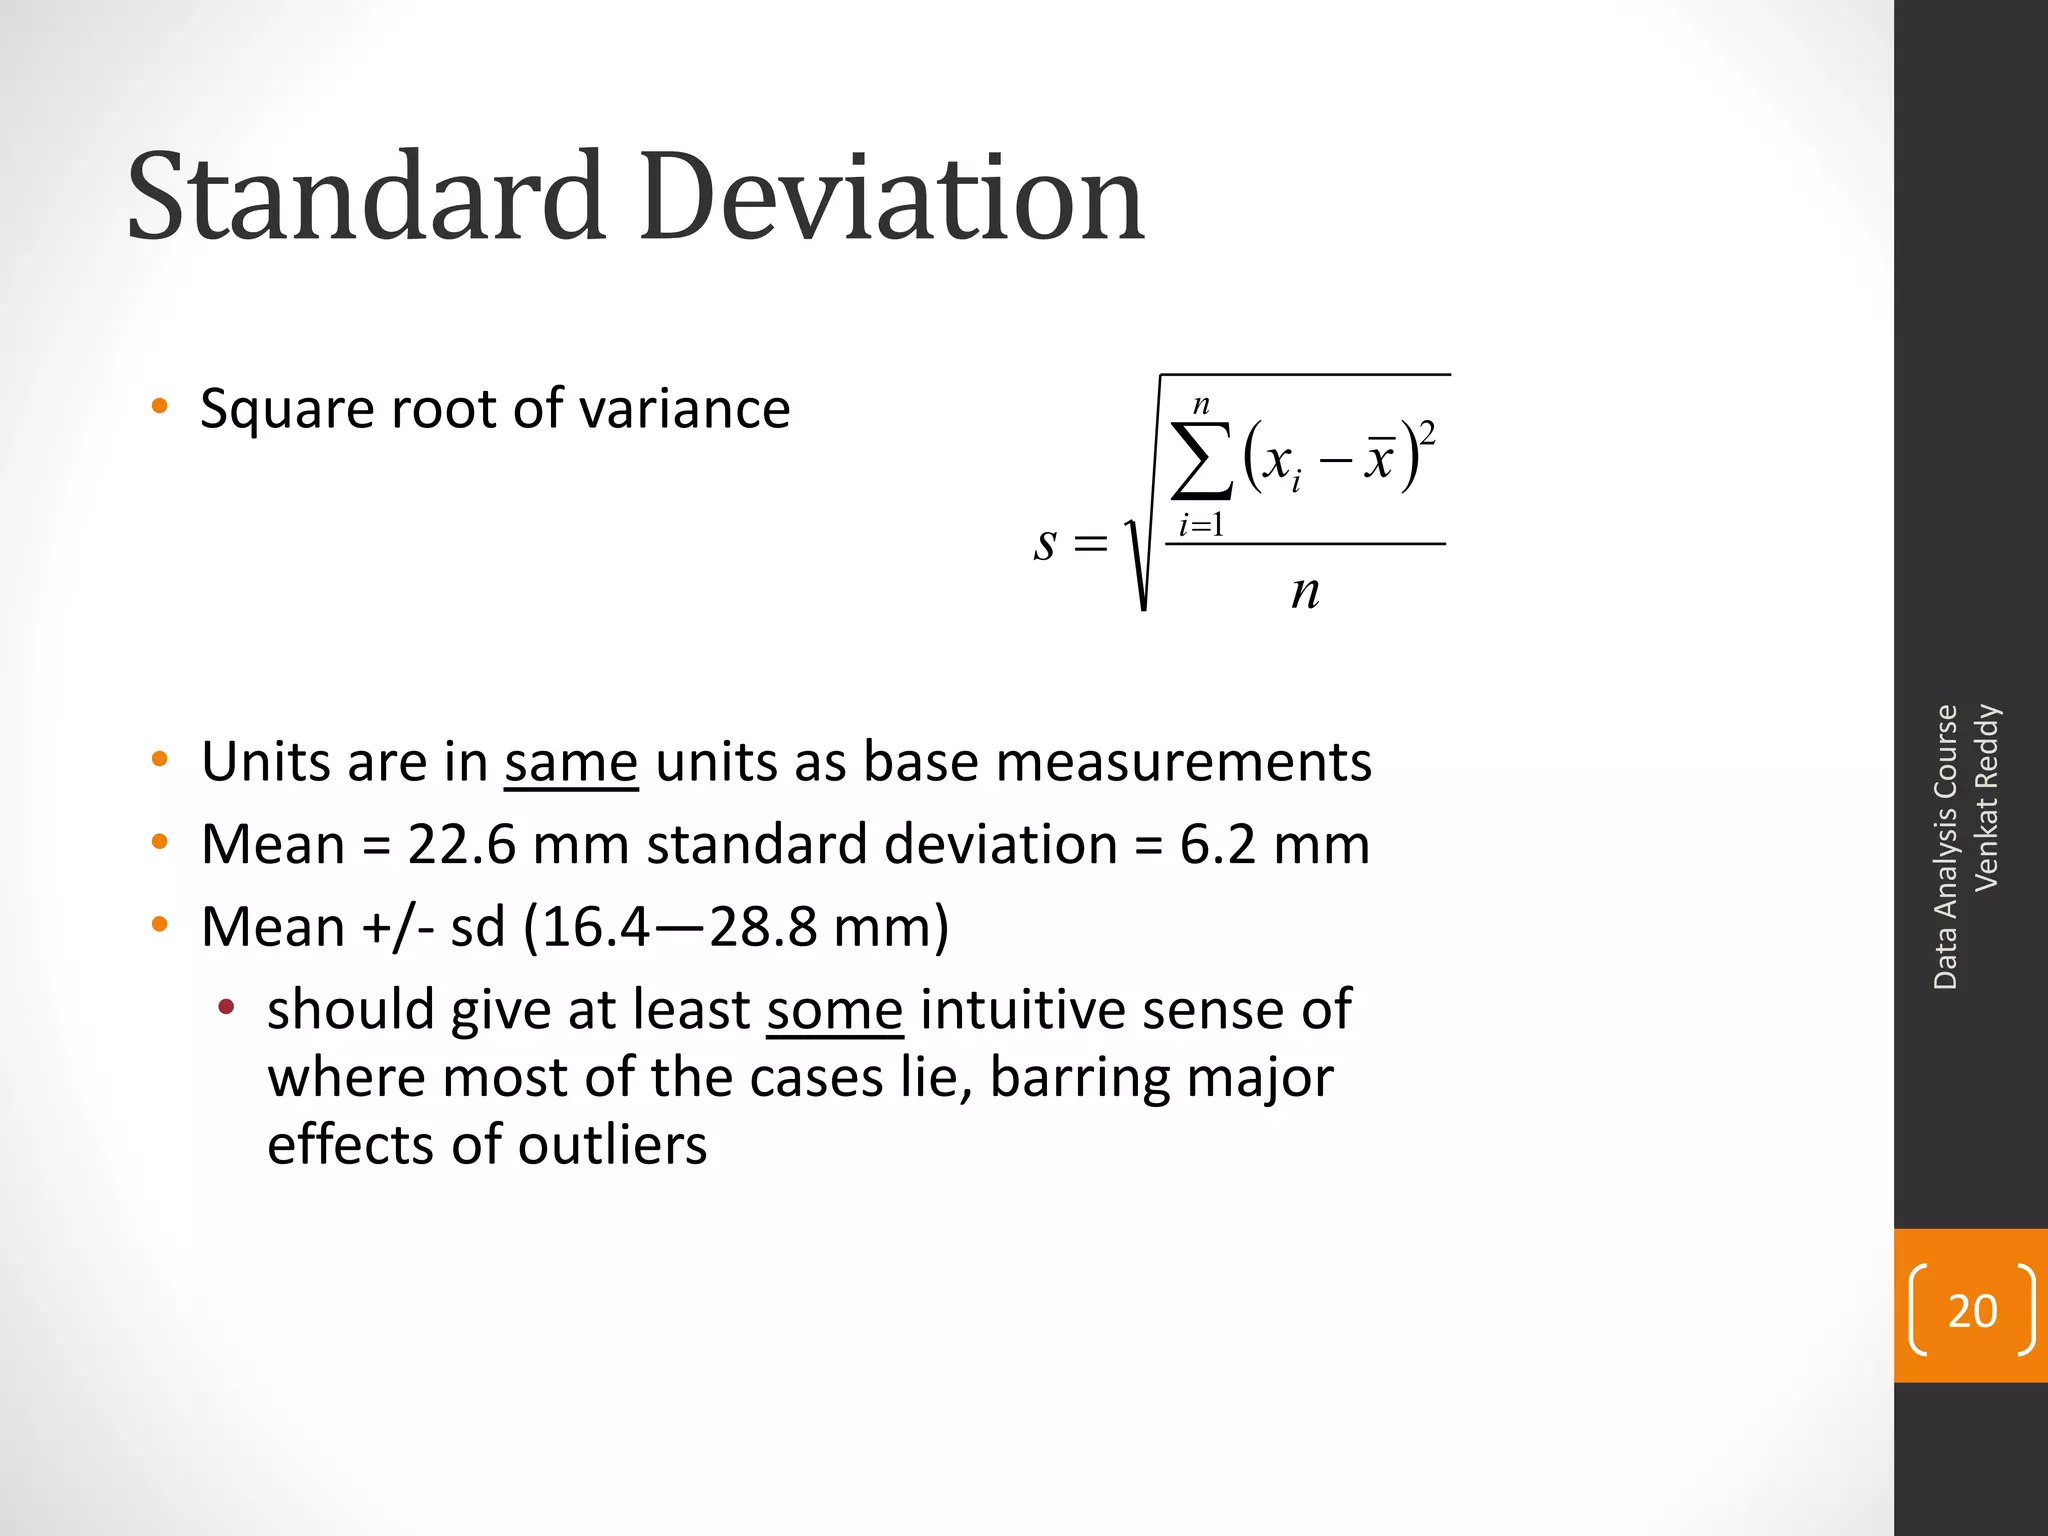
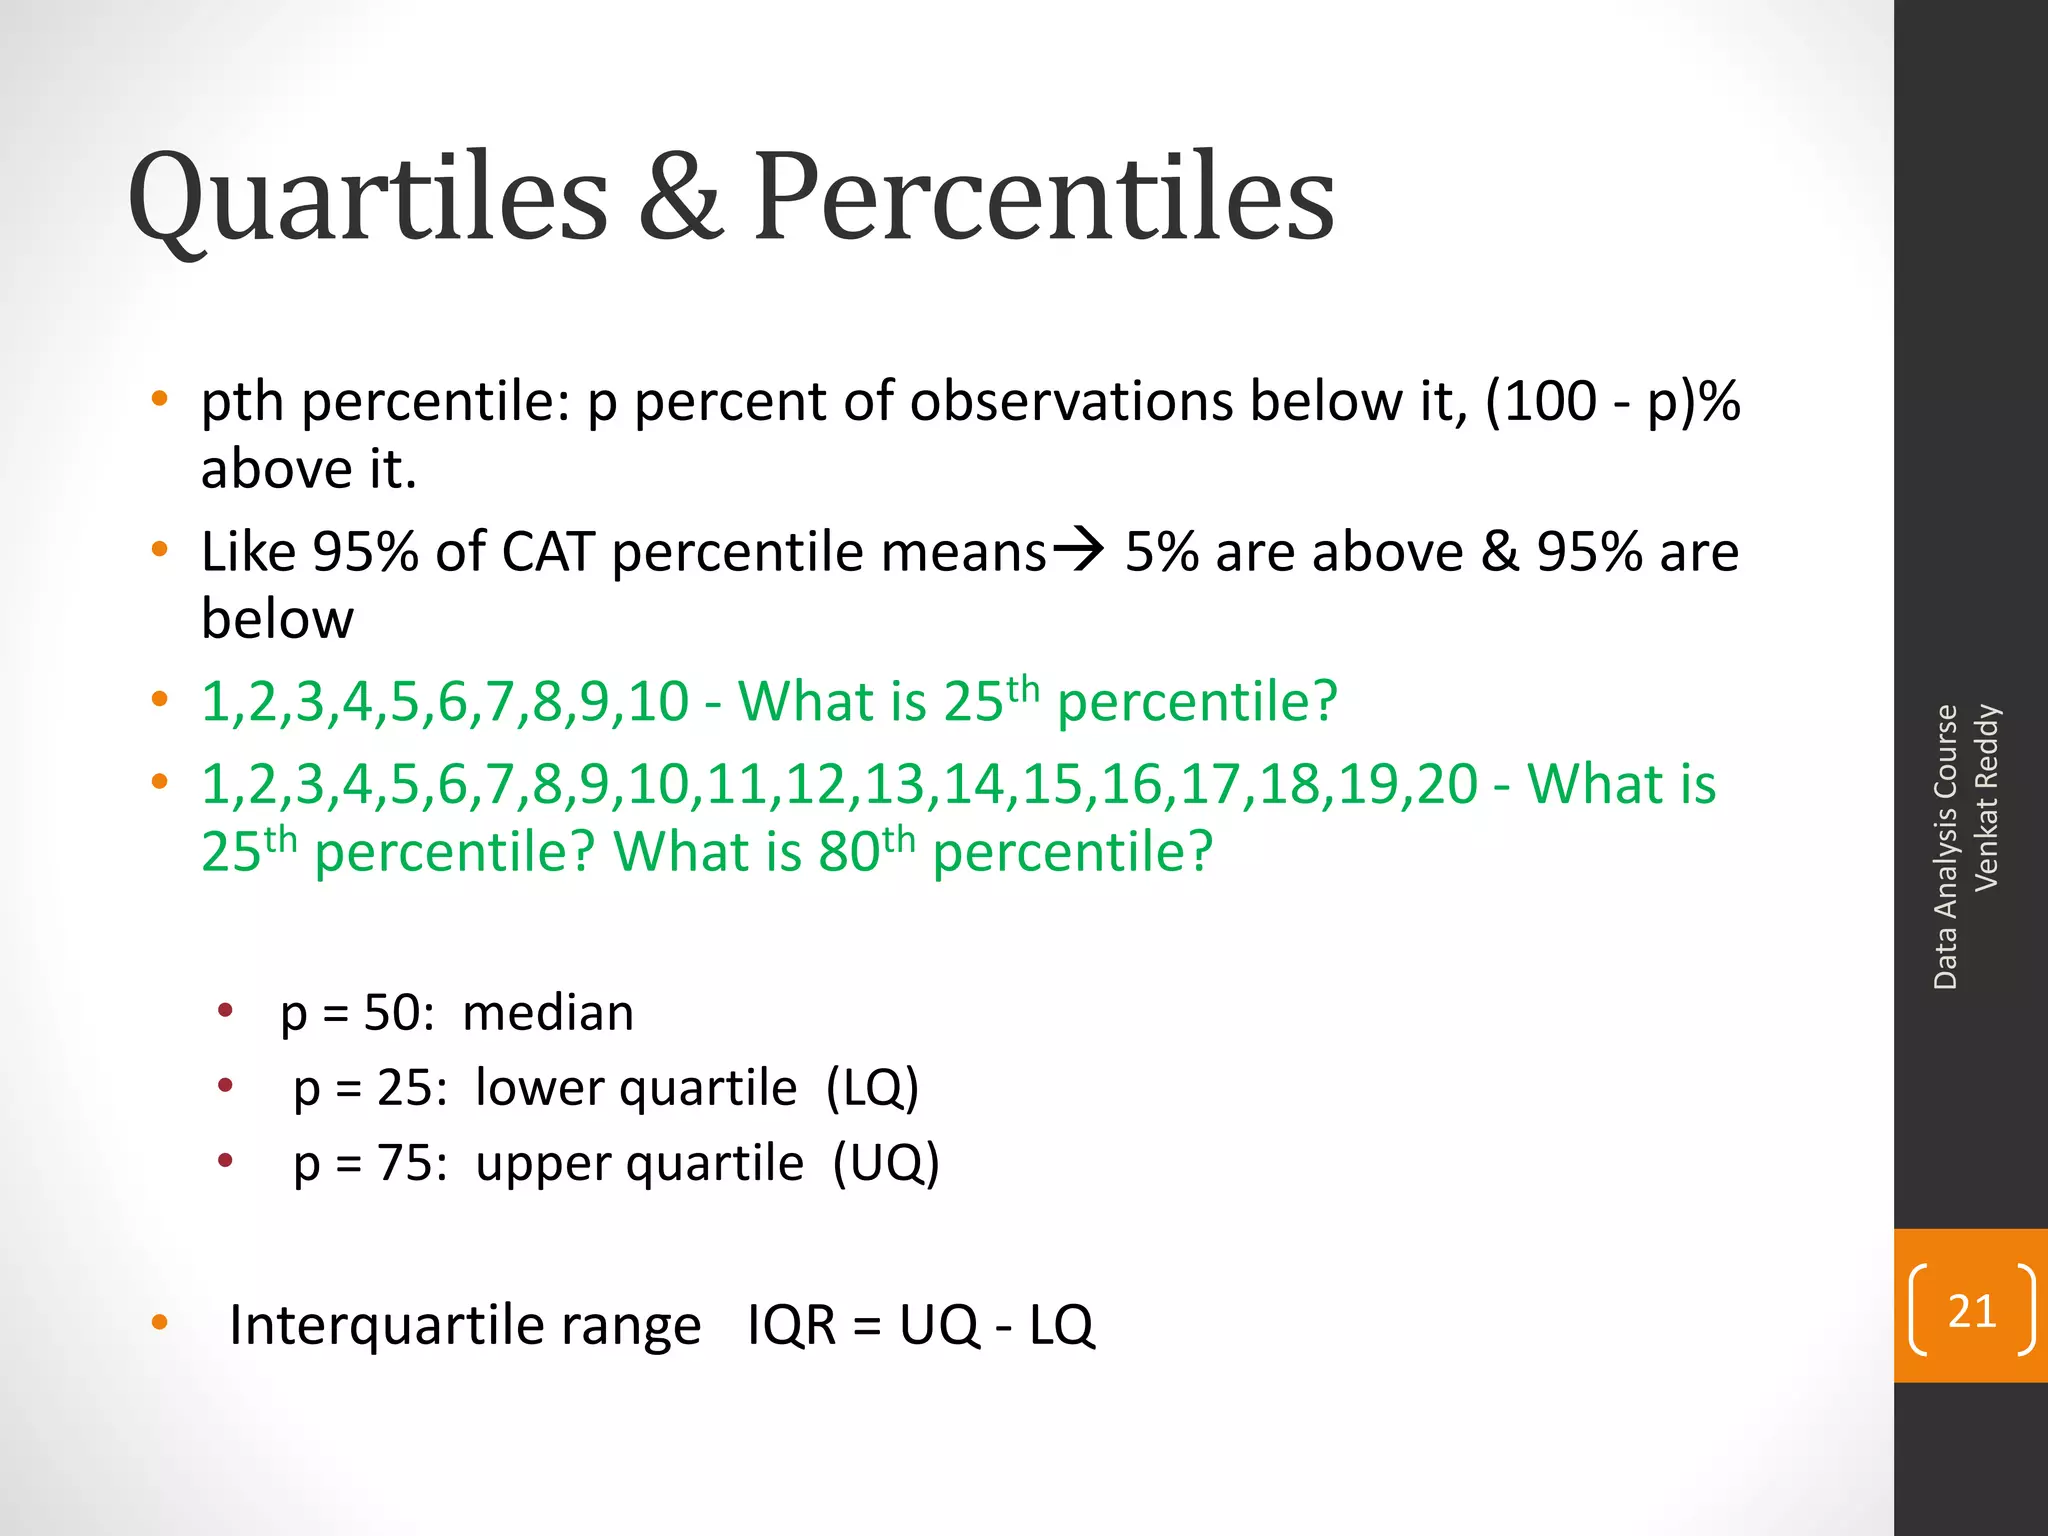
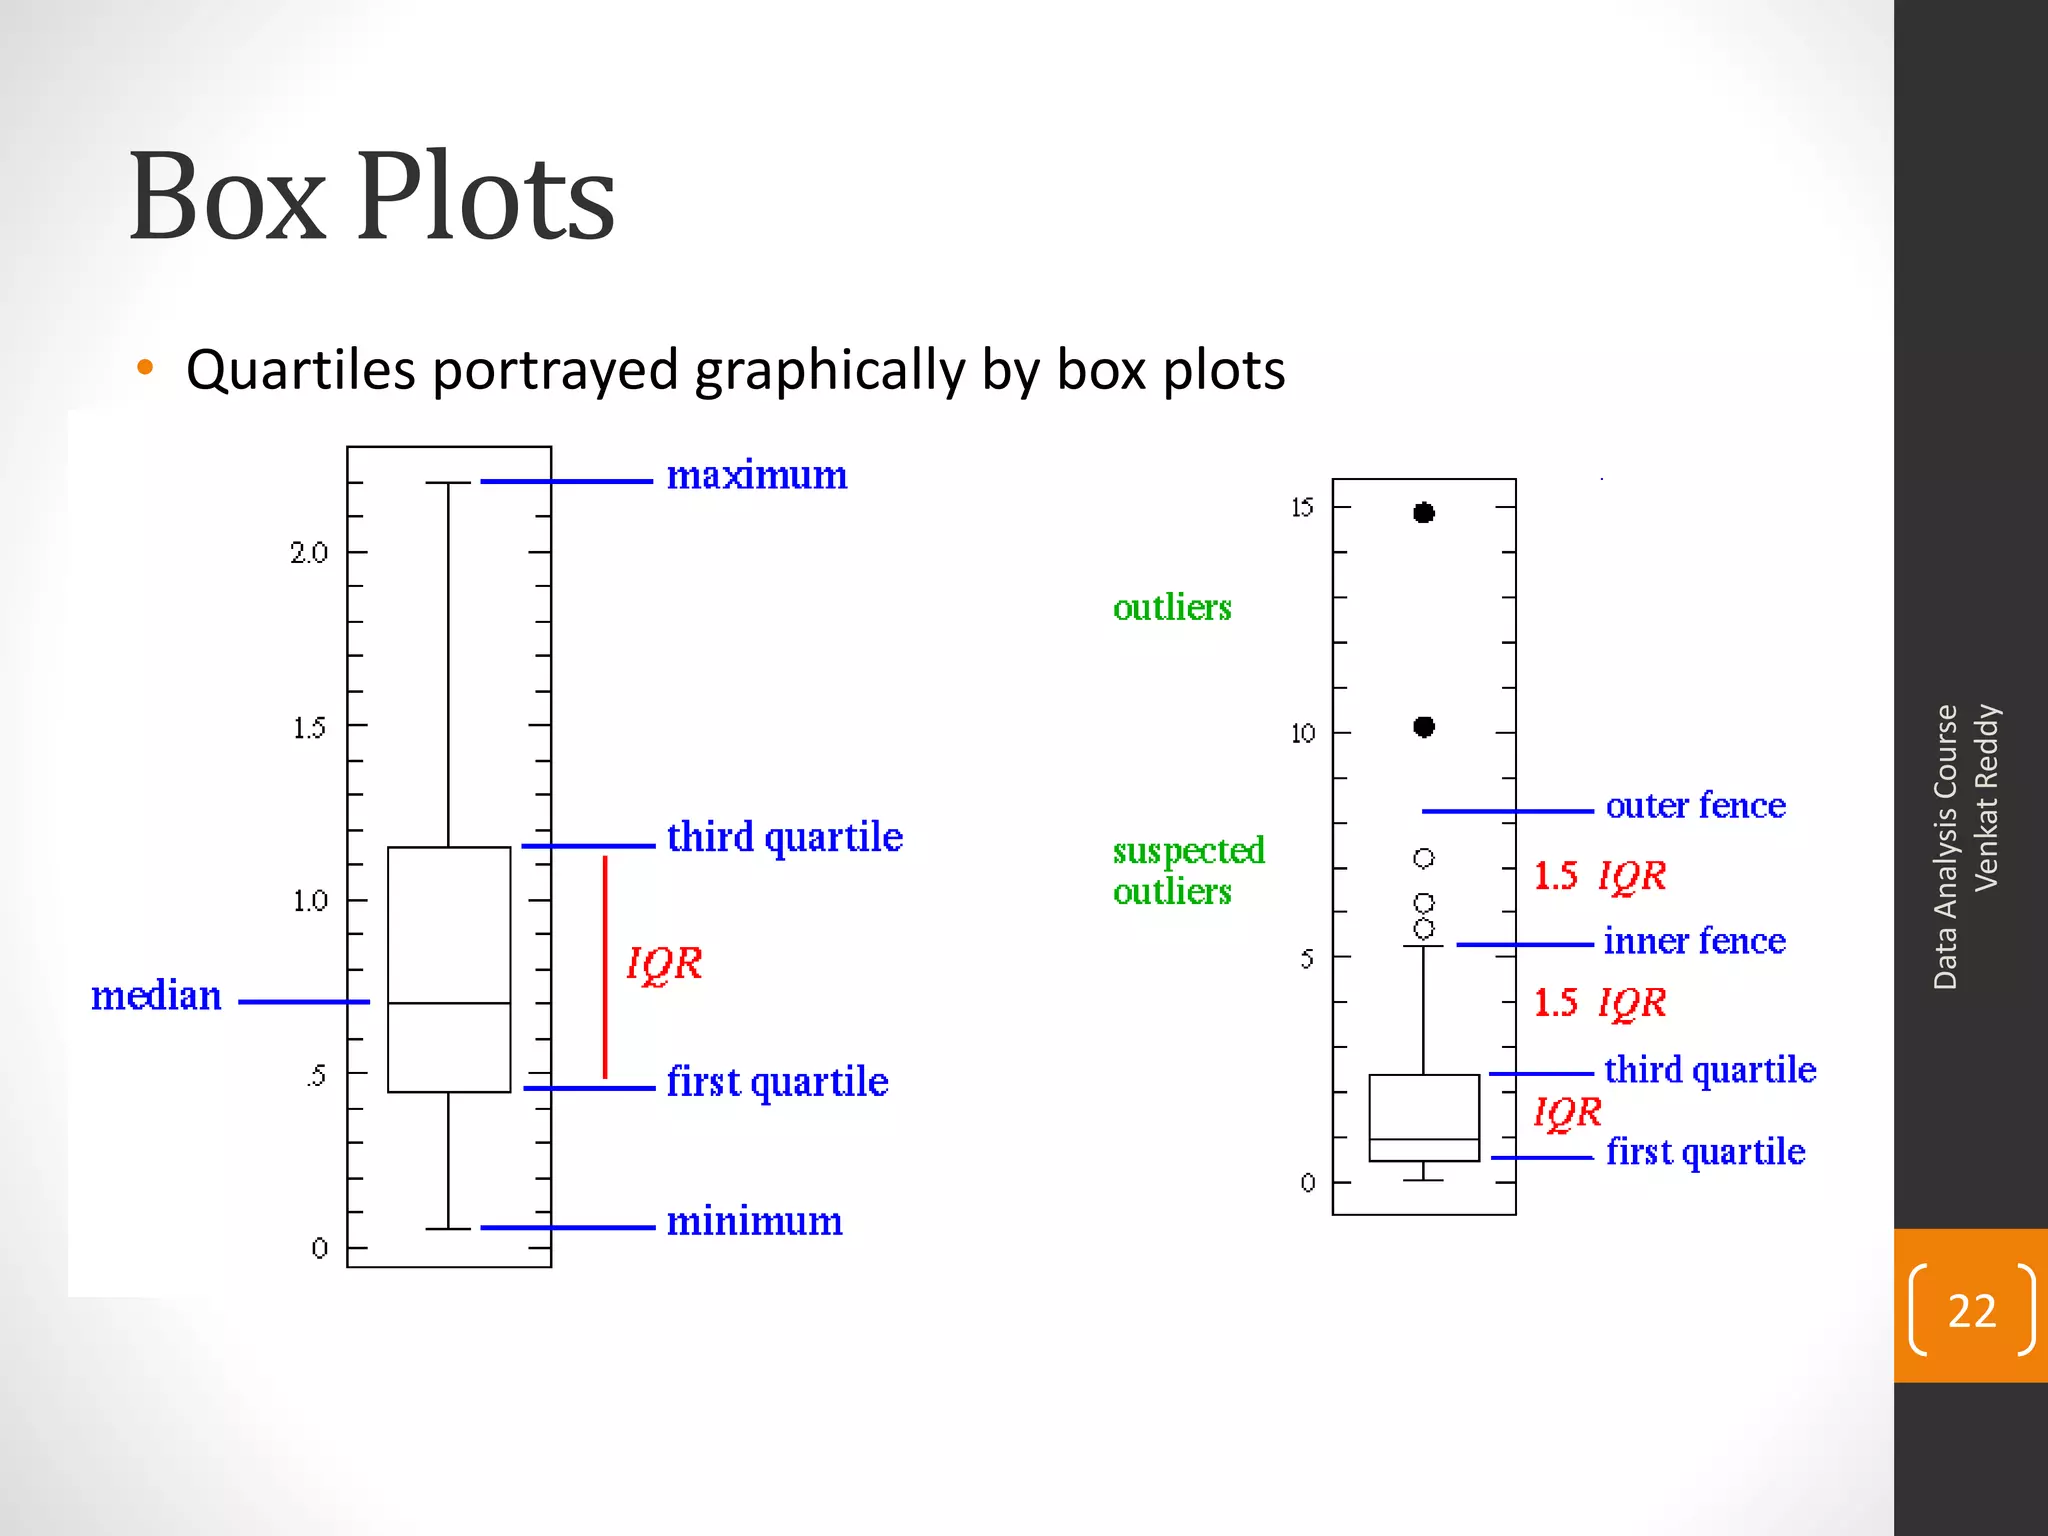
Describes measures of dispersion: range, variance, standard deviation, quartiles, and percentiles, and their significance.
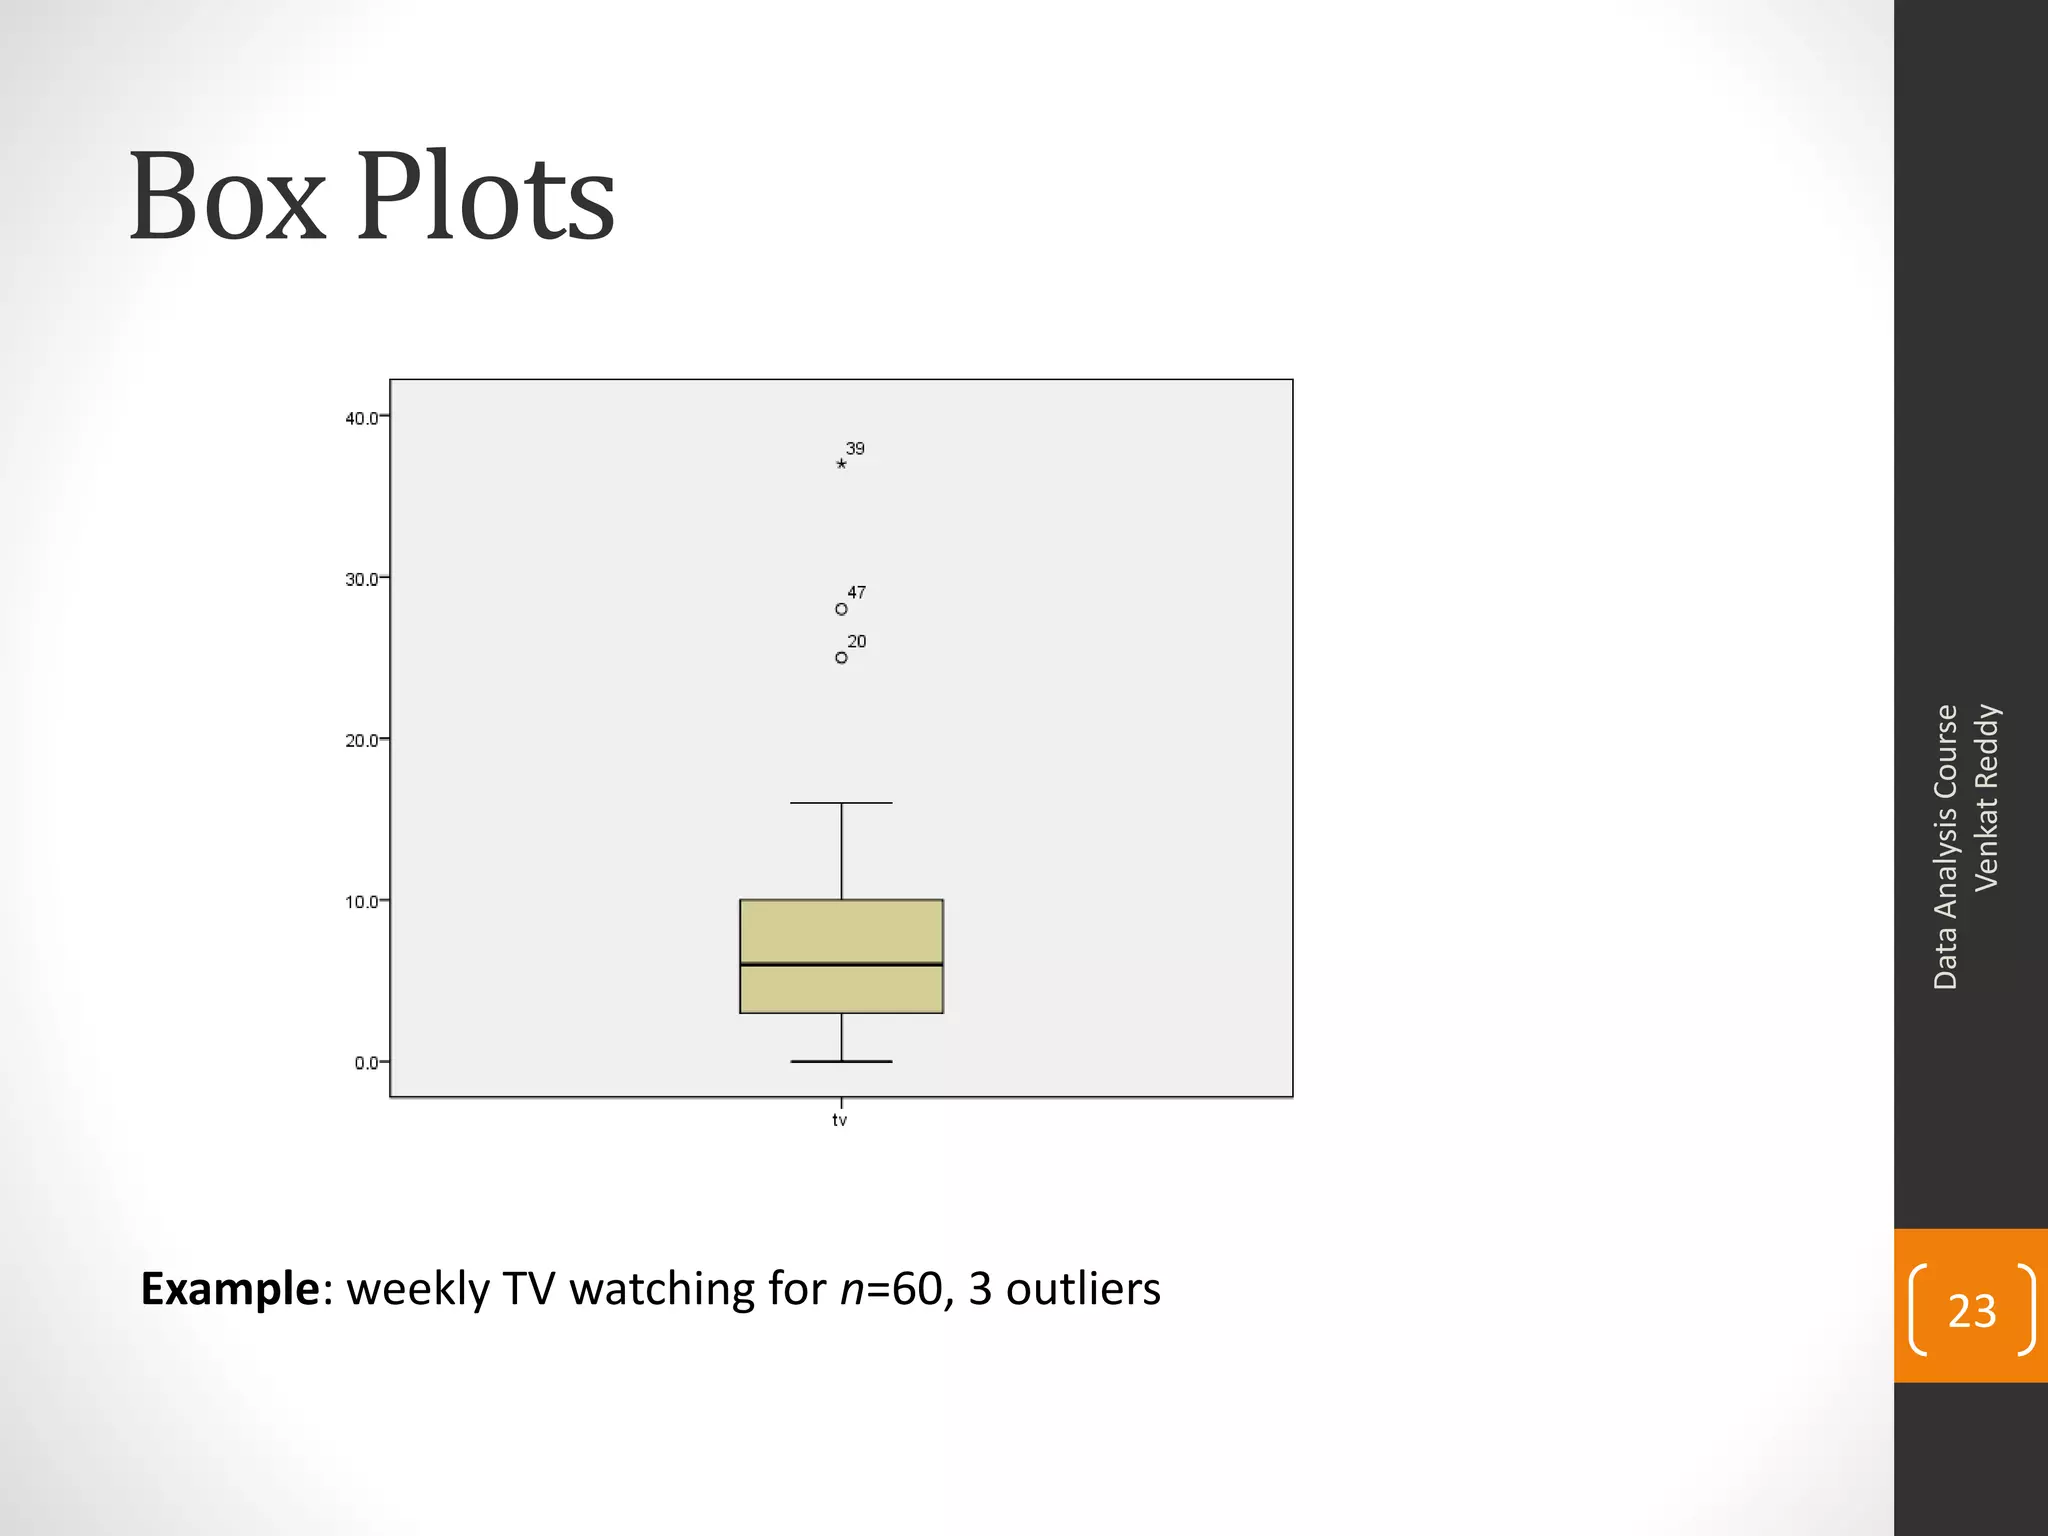
Explanation and illustration of box plots representing quartiles and outliers in data.
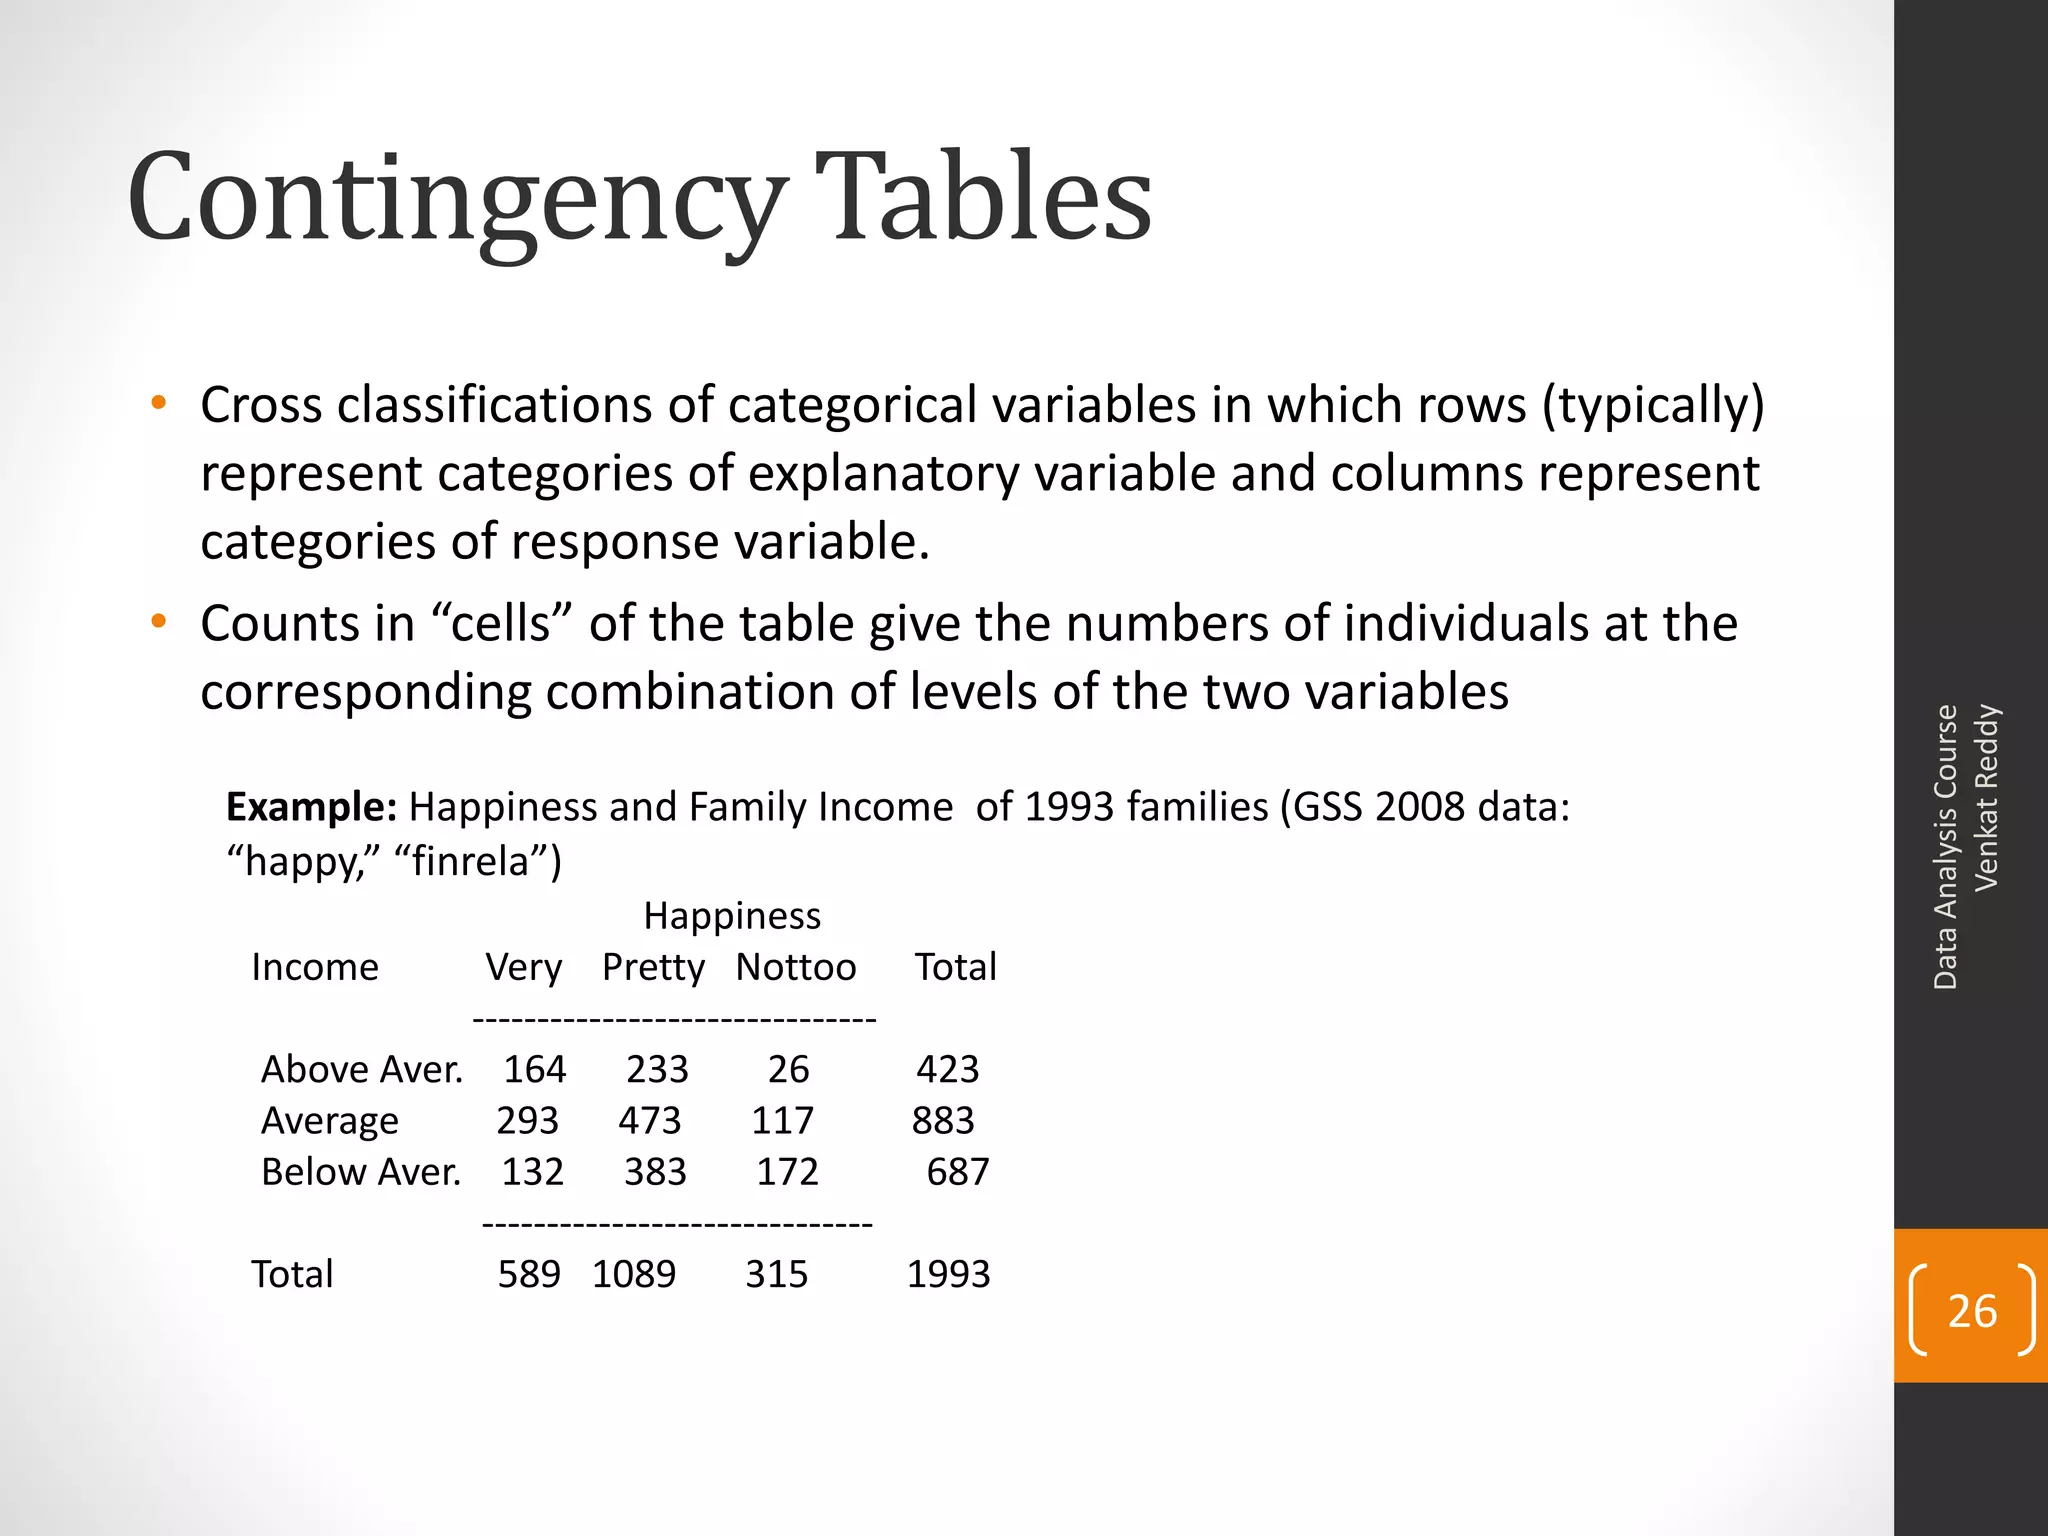
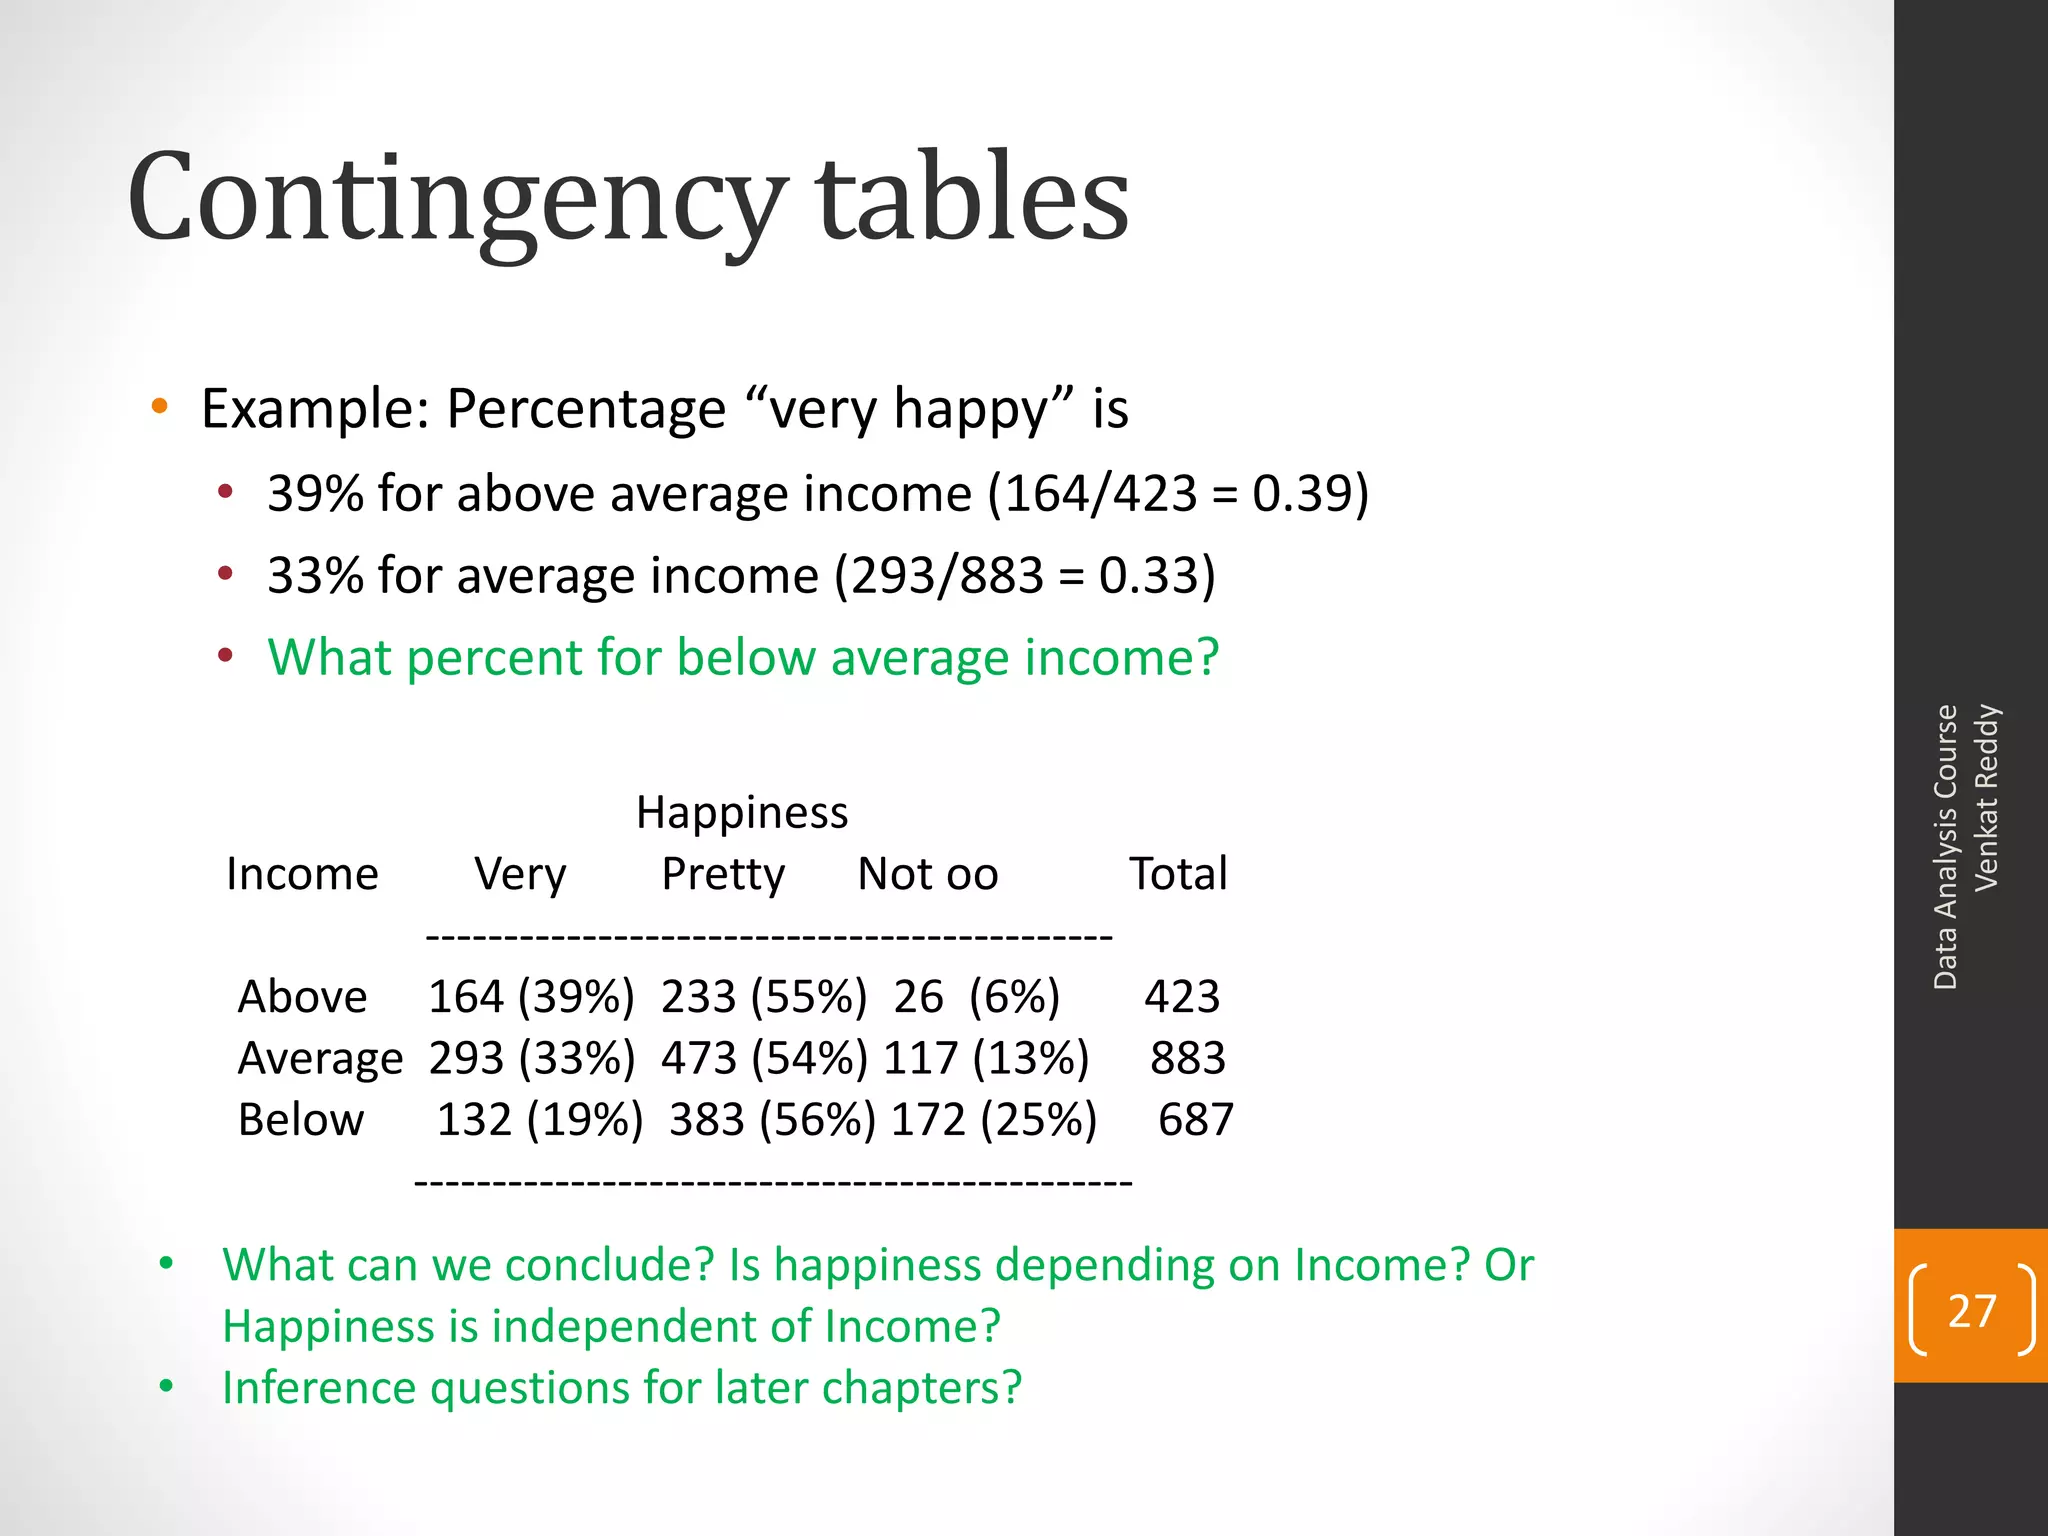
Cross classifications of categorical variables shown through contingency tables exploring happiness and income.
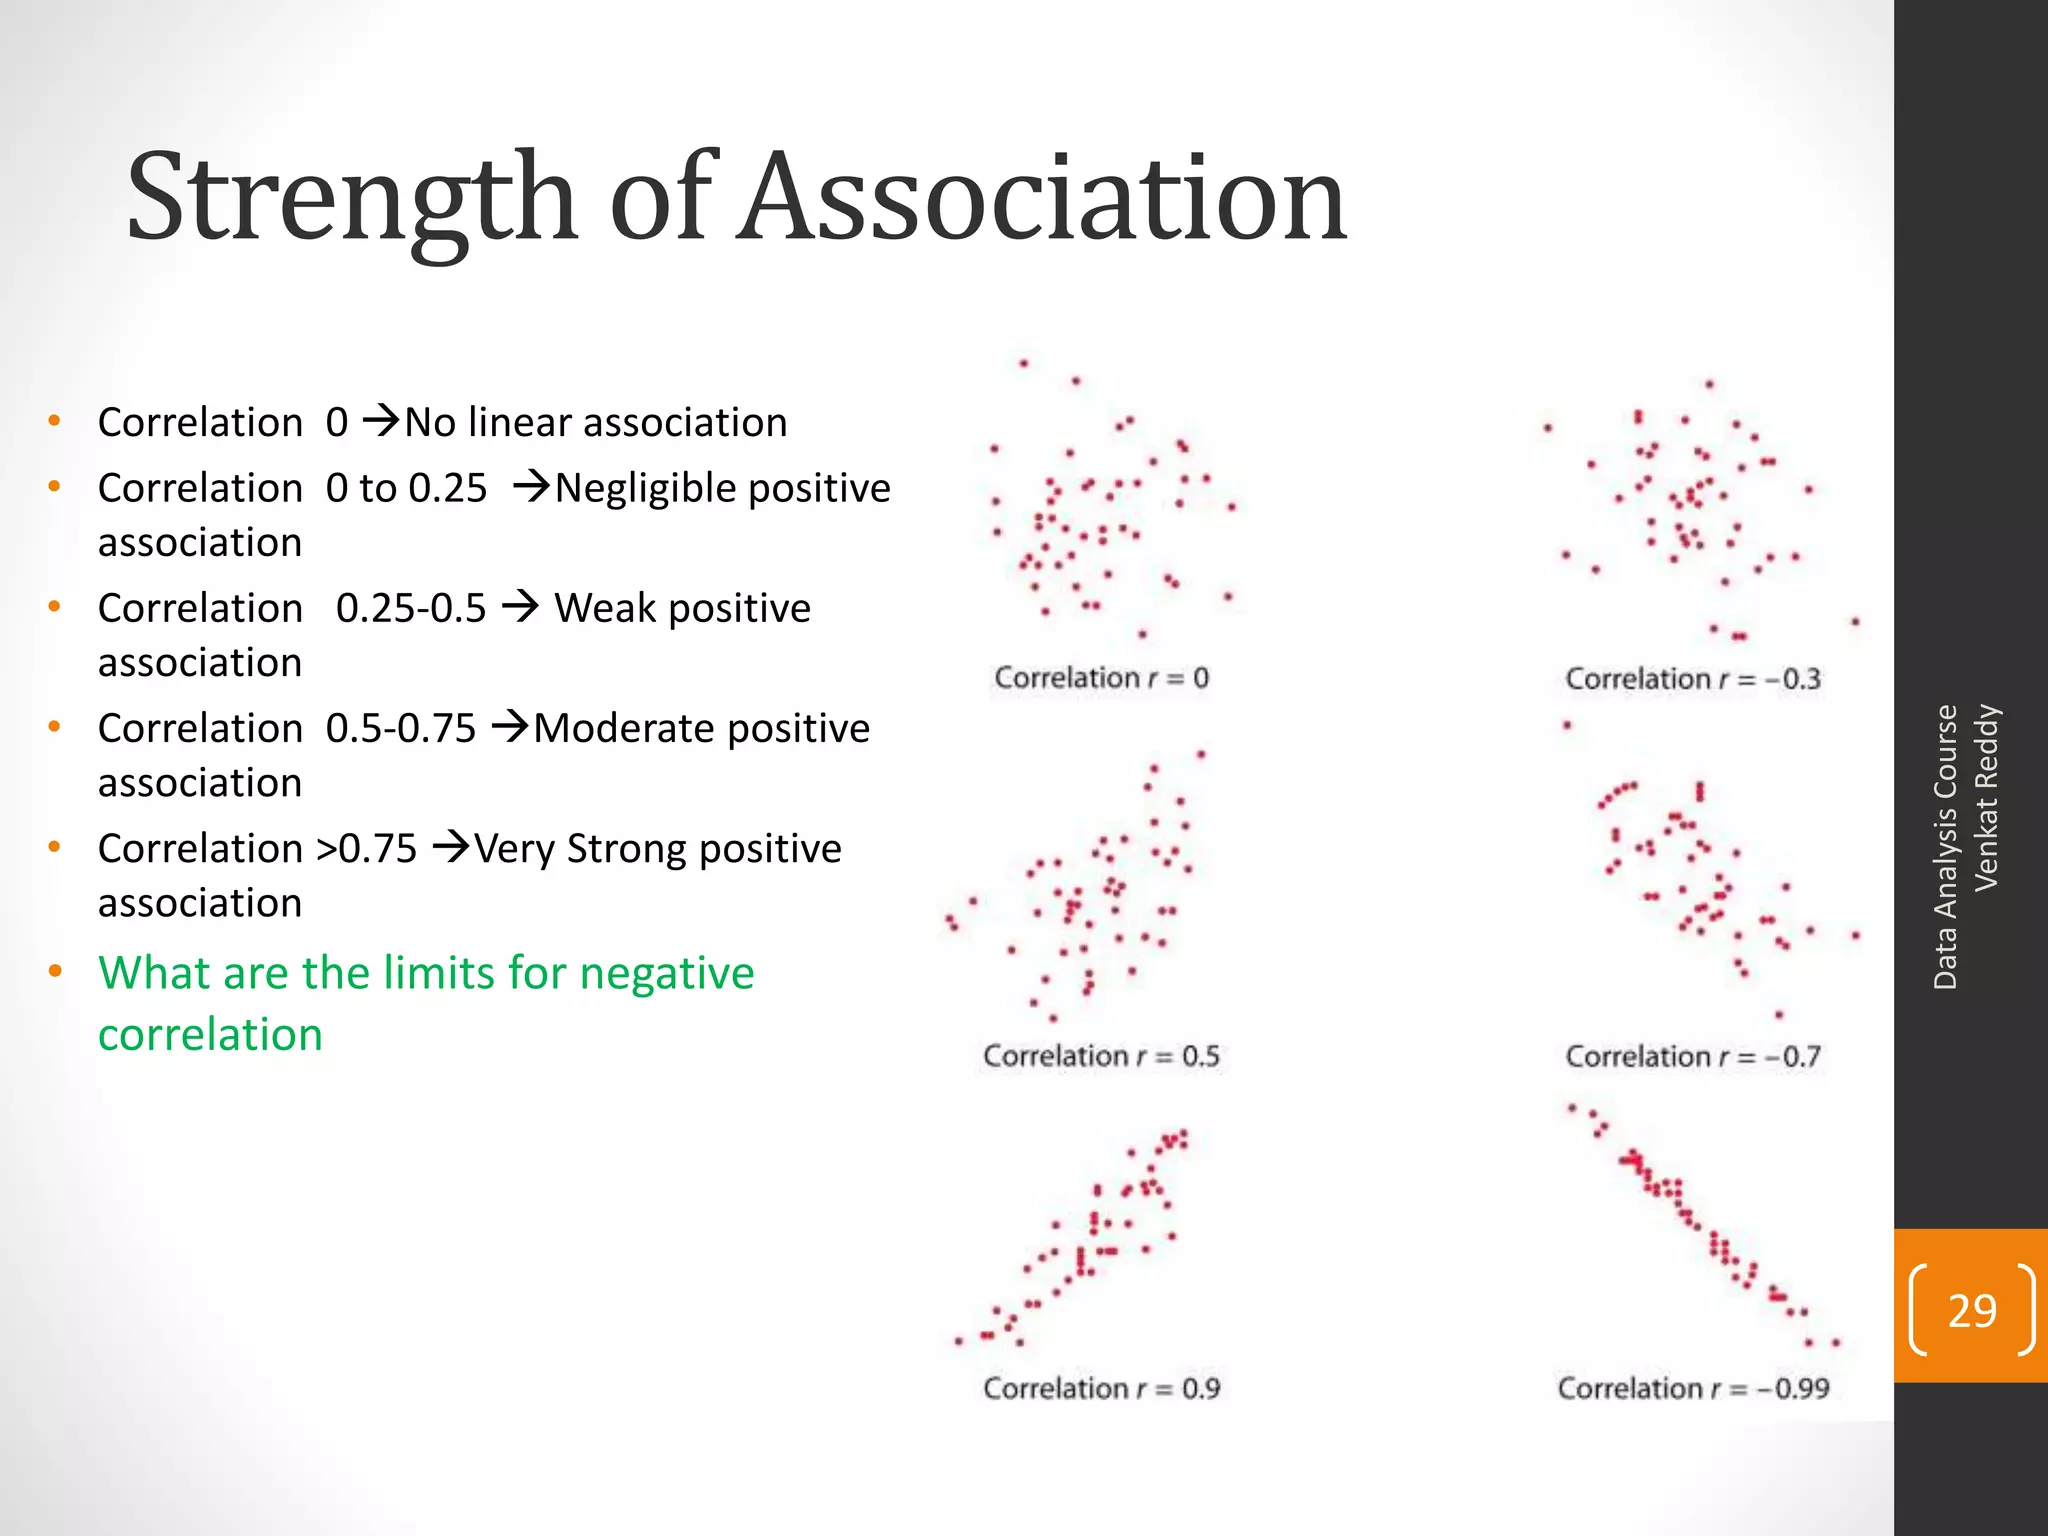
Correlation concepts and their interpretations including strength of association between variables.
Introduction to regression analysis, prediction of outcomes, and practical lab exercises with sales data.
Presenter's contact information for further inquiries and follow-up.