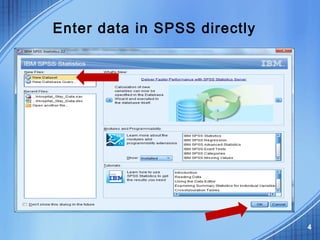
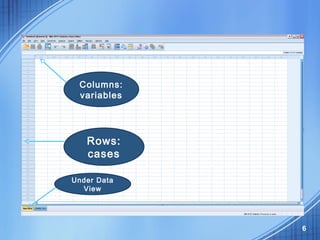
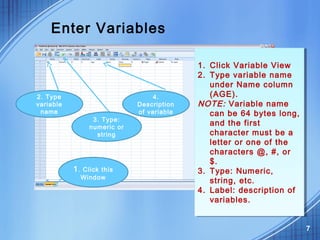
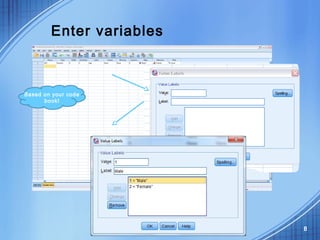
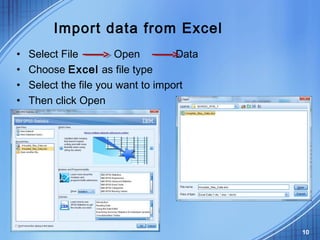
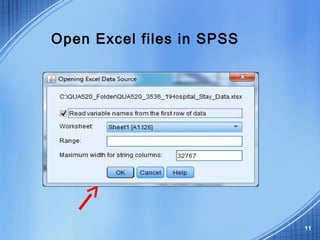
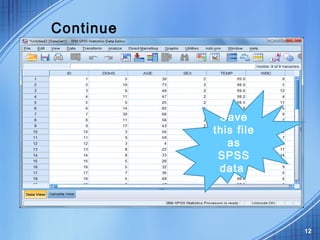
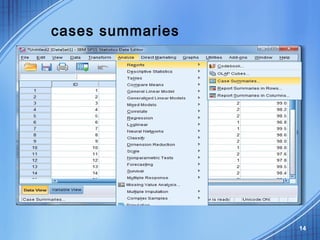
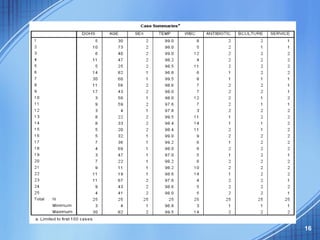
Introduction to the
SPSS Interface
Dr. Mohammed Alahmed
Ph.D. in Biostatistics
alahmed@ksu.edu.sa
(011) 4674108
1
Contents
• SPSS interface:
– Data view and Variable view
• How to enter data in SPSS
• How to import external data into SPSS
• How to clean and edit data
• How to get descriptive statistics
2
SPSS interface
• Data view
– The place to enter data
– Columns: variables
– Rows: records
• Variable view
– The place to enter variables
– List of all variables
– Characteristics of all variables
3
4
Enter data in SPSS directly
Example: Hospital-stay data
5
6
Columns:
variables
Rows:
cases
Under Data
View
Enter Variables
7
1. Click this
Window
1. Click Variable View
2. Type variable name
under Name column
(AGE).
NOTE: Variable name
can be 64 bytes long,
and the first
character must be a
letter or one of the
characters @, #, or
$.
3. Type: Numeric,
string, etc.
4. Label: description of
variables.
1. Click Variable View
2. Type variable name
under Name column
(AGE).
NOTE: Variable name
can be 64 bytes long,
and the first
character must be a
letter or one of the
characters @, #, or
$.
3. Type: Numeric,
string, etc.
4. Label: description of
variables.
2. Type
variable
name
3. Type:
numeric or
string
4.
Description
of variable
Enter variables
8
Based on your code
book!
Enter cases
9
Import data from Excel
• Select File Open Data
• Choose Excel as file type
• Select the file you want to import
• Then click Open
10
Open Excel files in SPSS
11
Continue
12
Save
this file
as
SPSS
data
Clean data after import data files
• Run cases summaries for all variables
• Run frequency for qualitative variables
and Descriptives for quantitative
variables
• Check outputs to see if you have variables
with wrong values.
• Check missing values and physical surveys
if you use paper surveys, and make sure
they are real missing.
• Sometimes, you need to recode string
variables into numeric variables 13
cases summaries
14
15
16
Basic Statistical Analysis
• Descriptive statistics:
1. Find wrong entries
2. Have basic knowledge about the
sample and targeted variables in a
study
3. Summarize data.
17
18
Analyze Descriptive statistics Frequency
Qualitative Variables
19
20
21
Analyze Descriptive statistics Descriptives
Quantitative Variables
22
Histogram Box-Plot
AGE
23
Duration of Stay
Histogram Box-Plot

Spss beginners