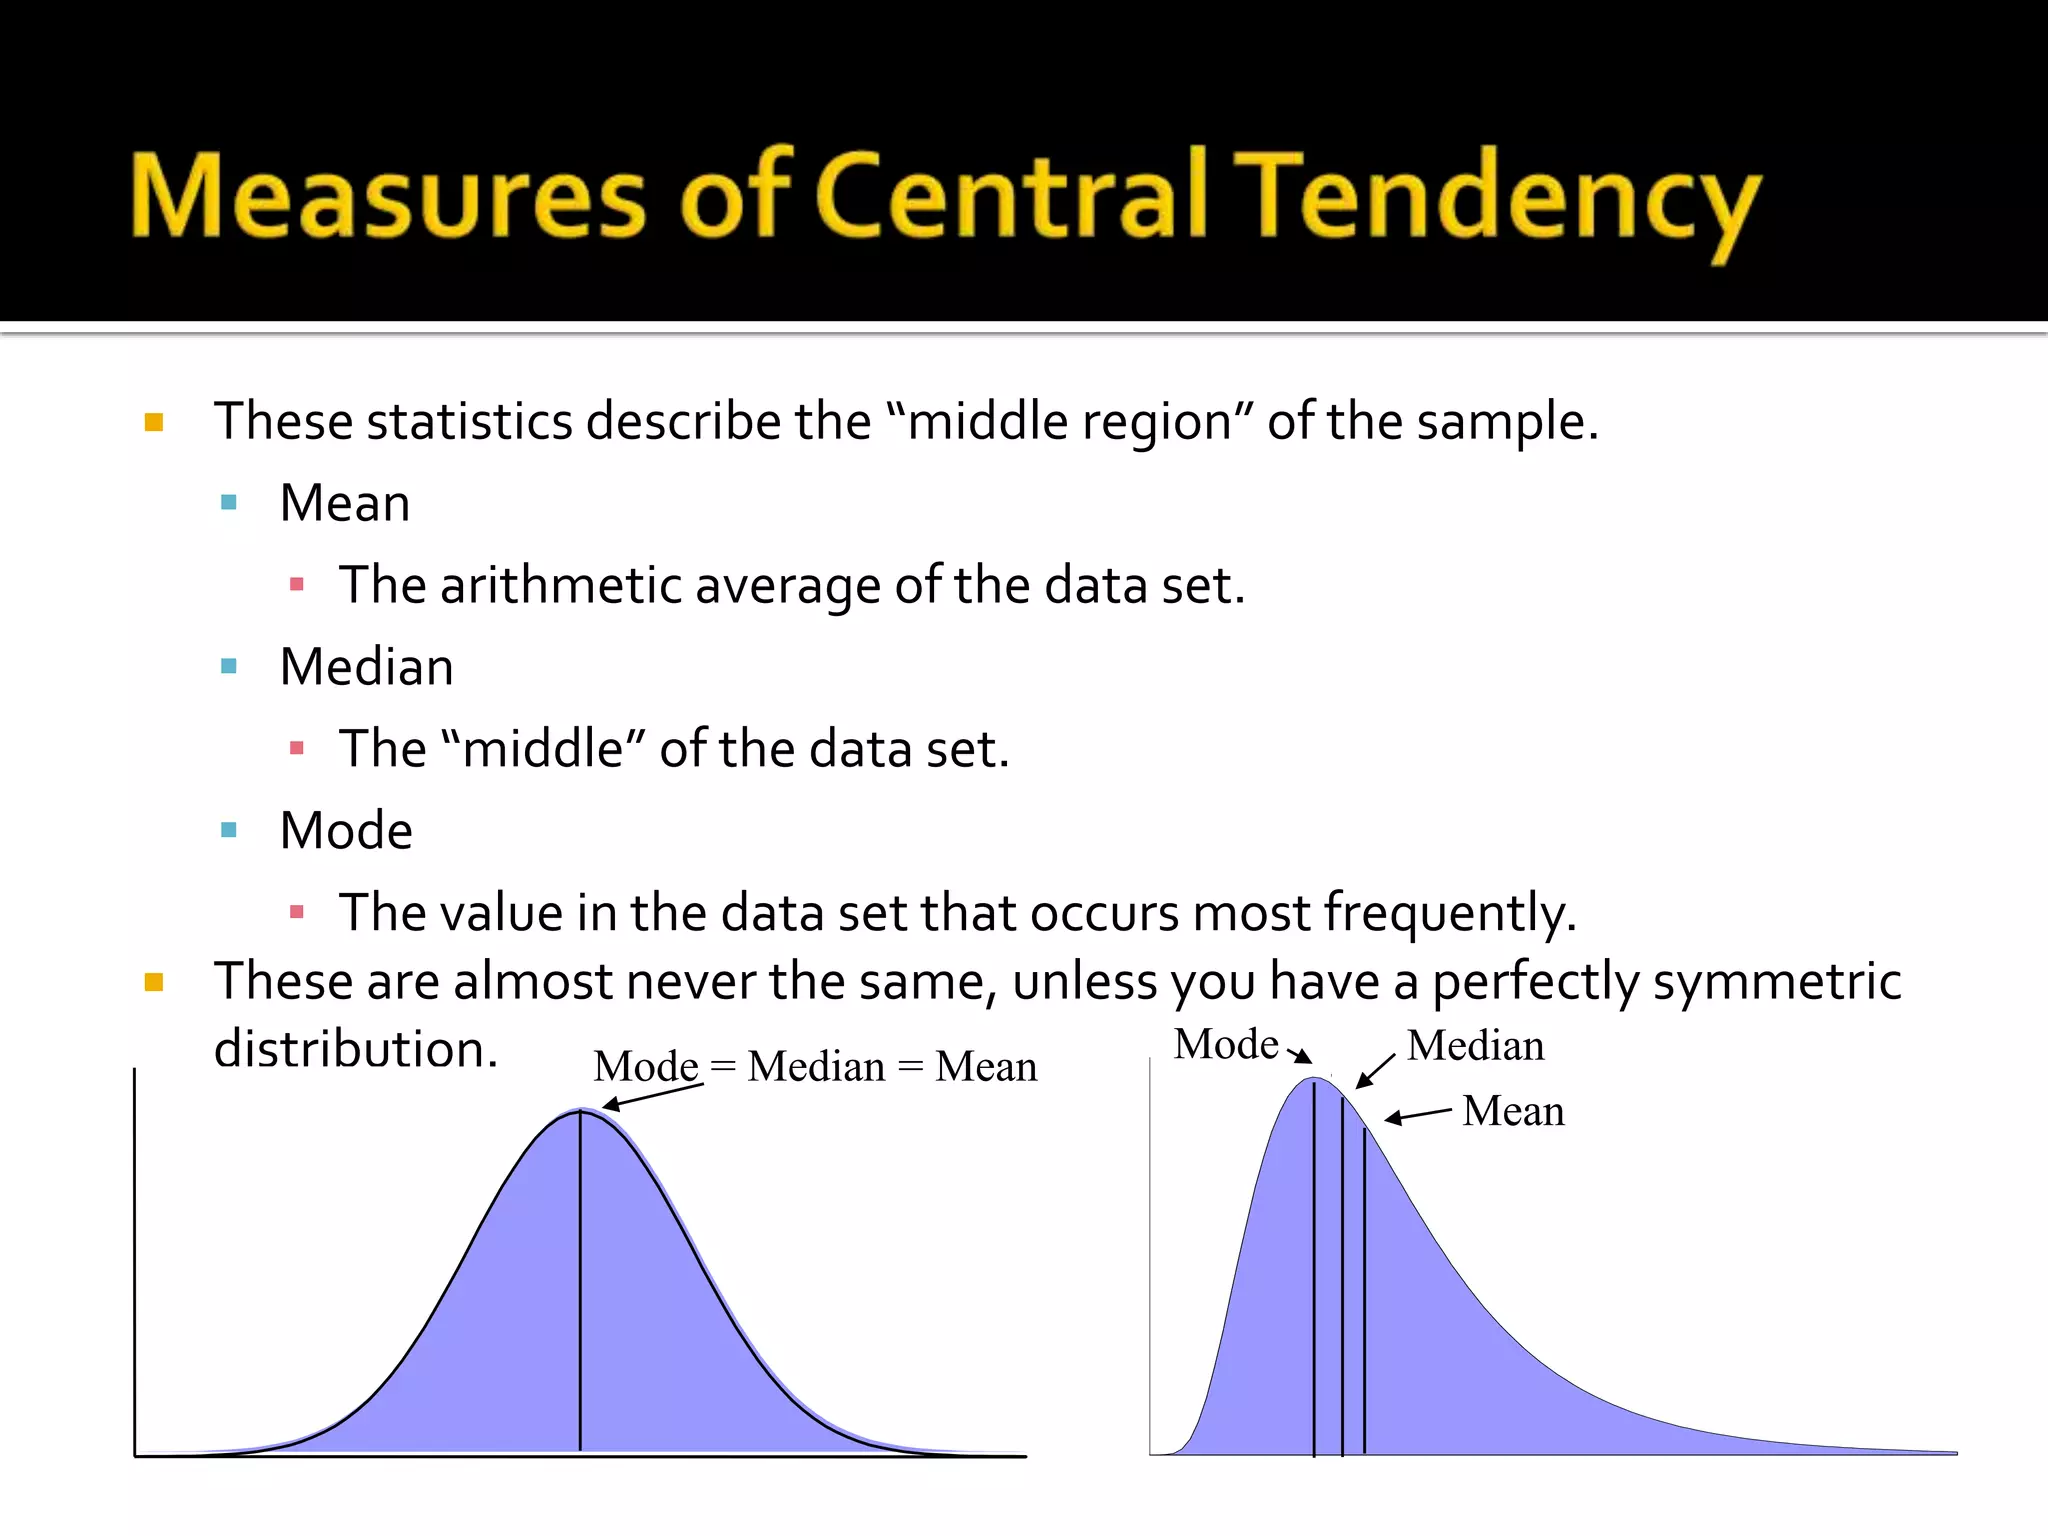
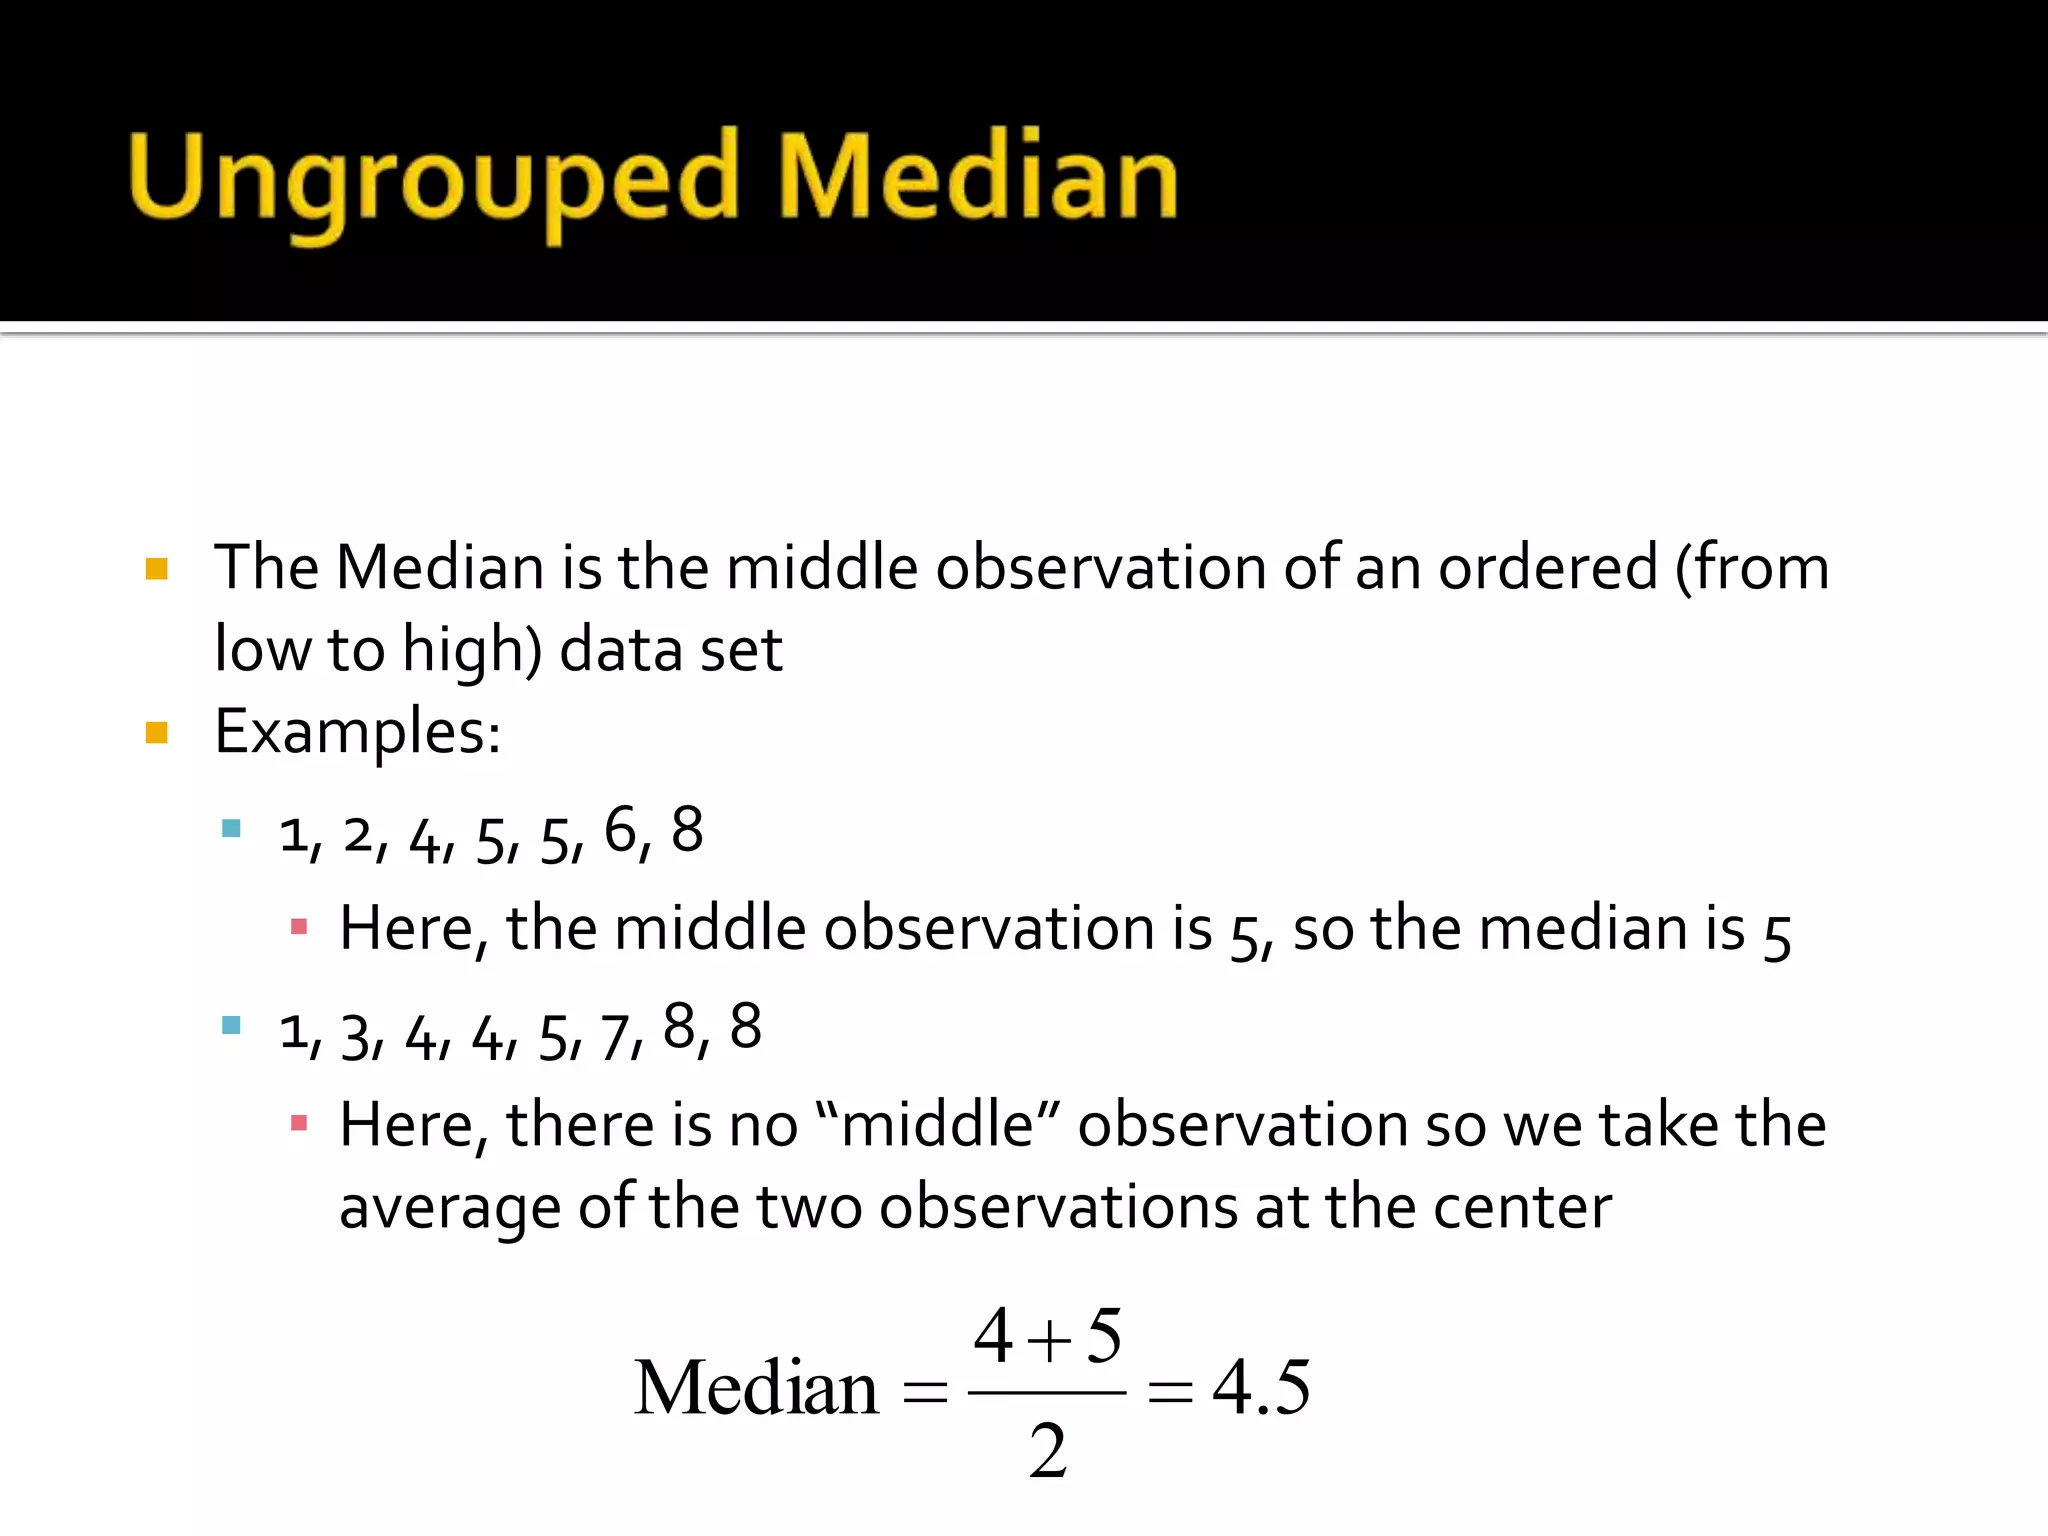
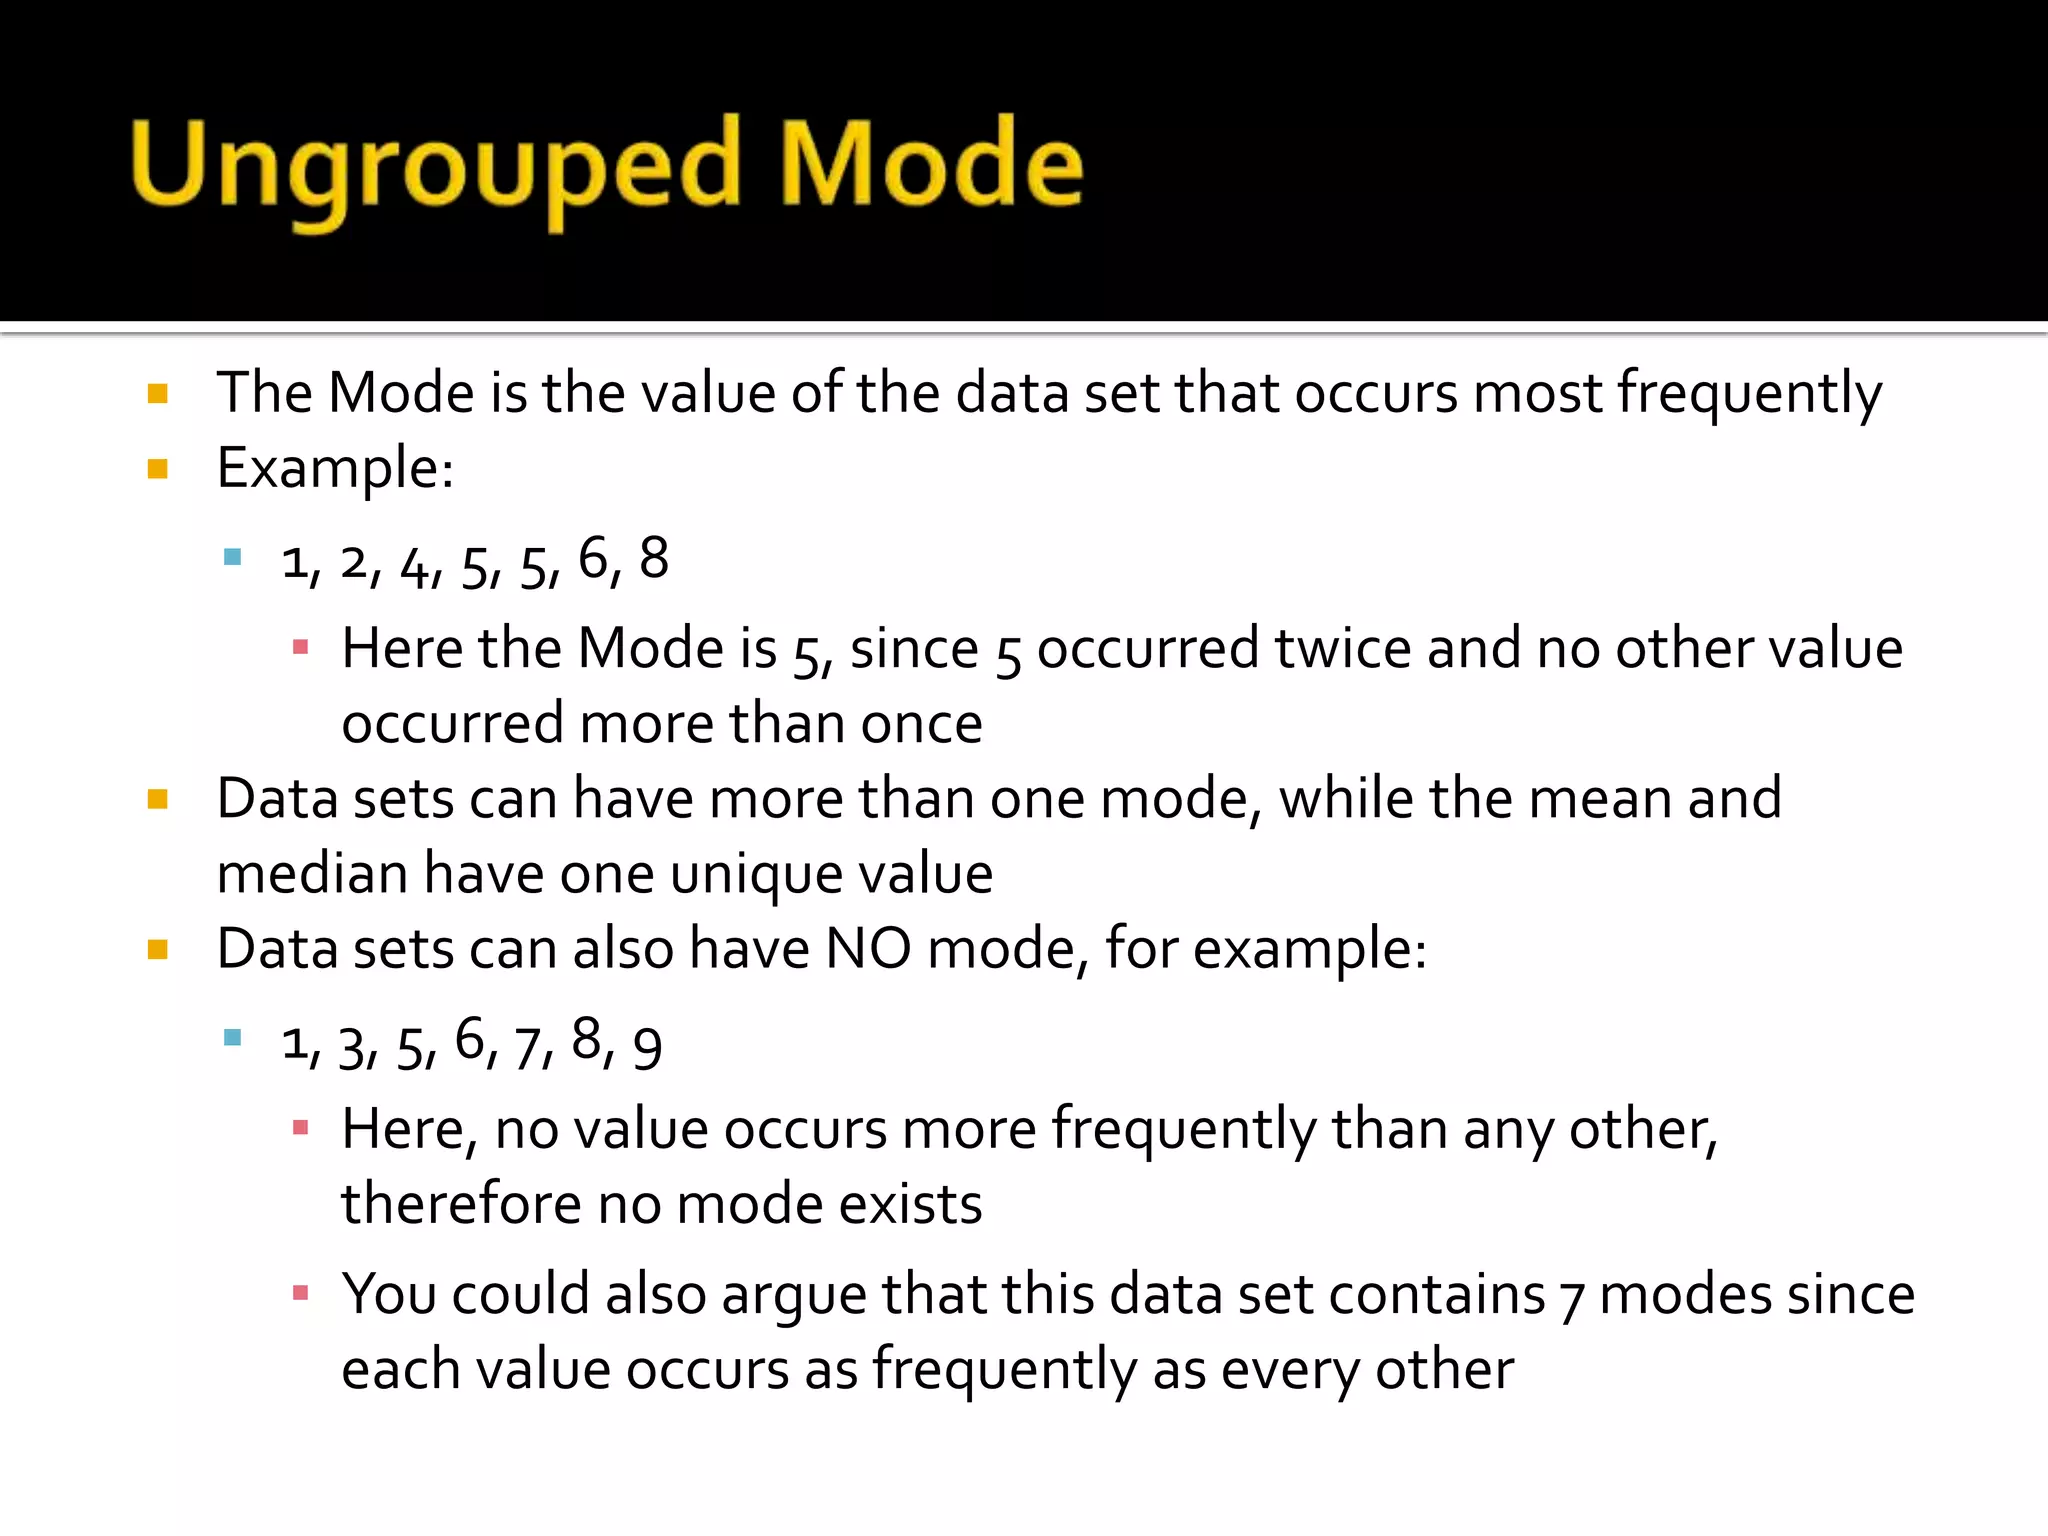
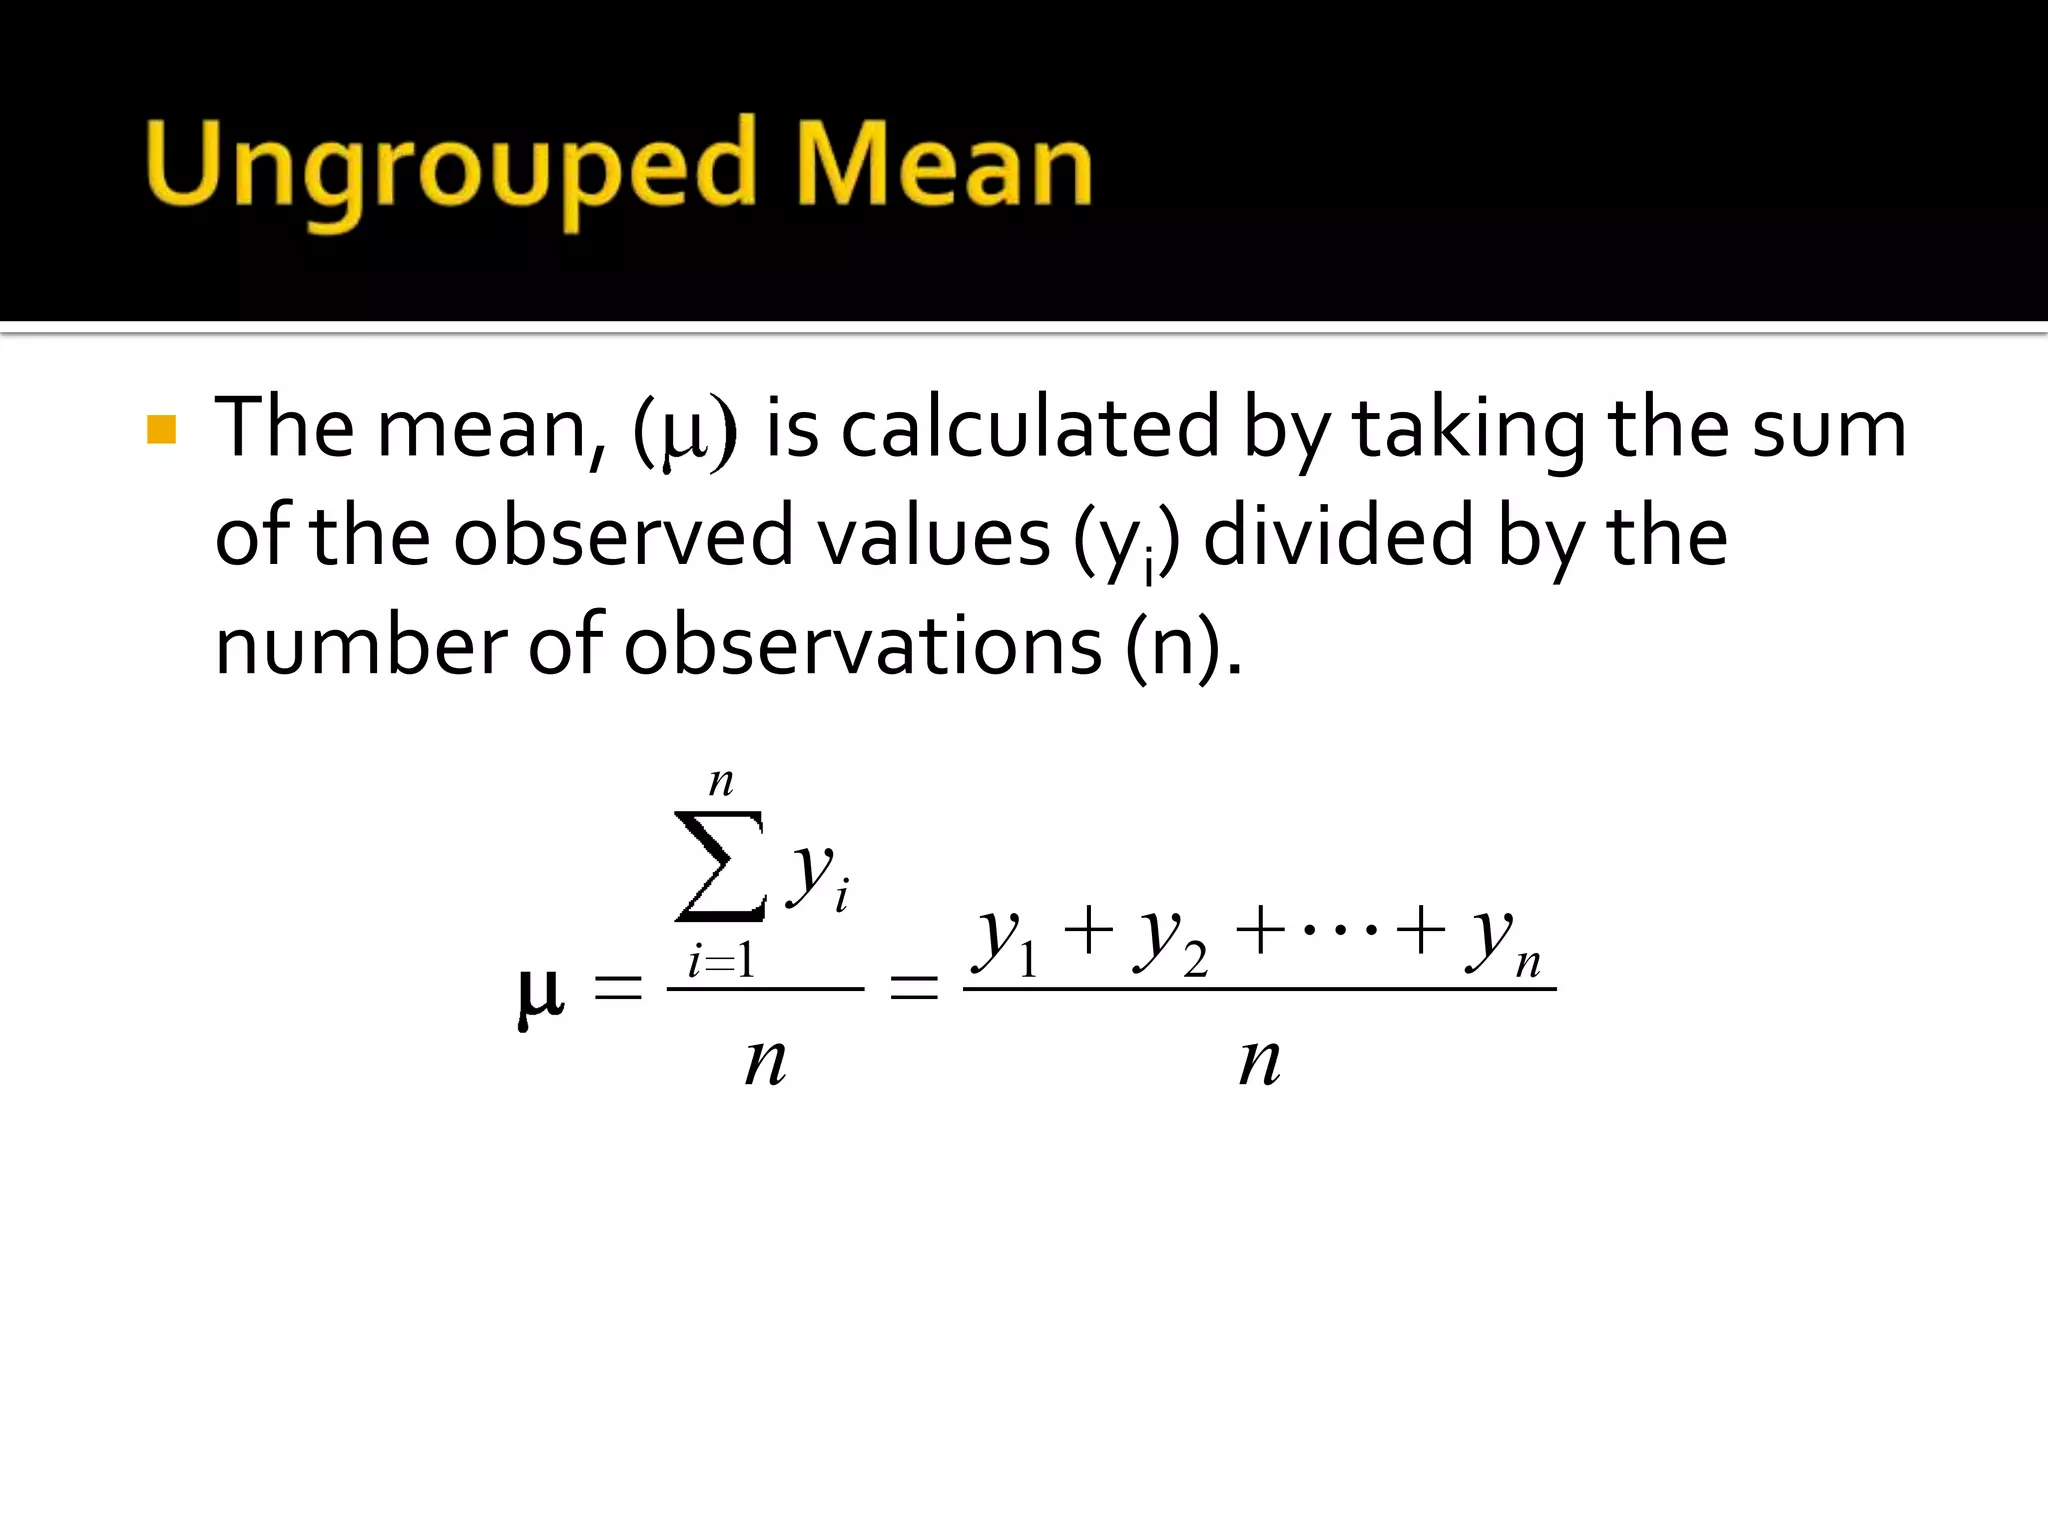
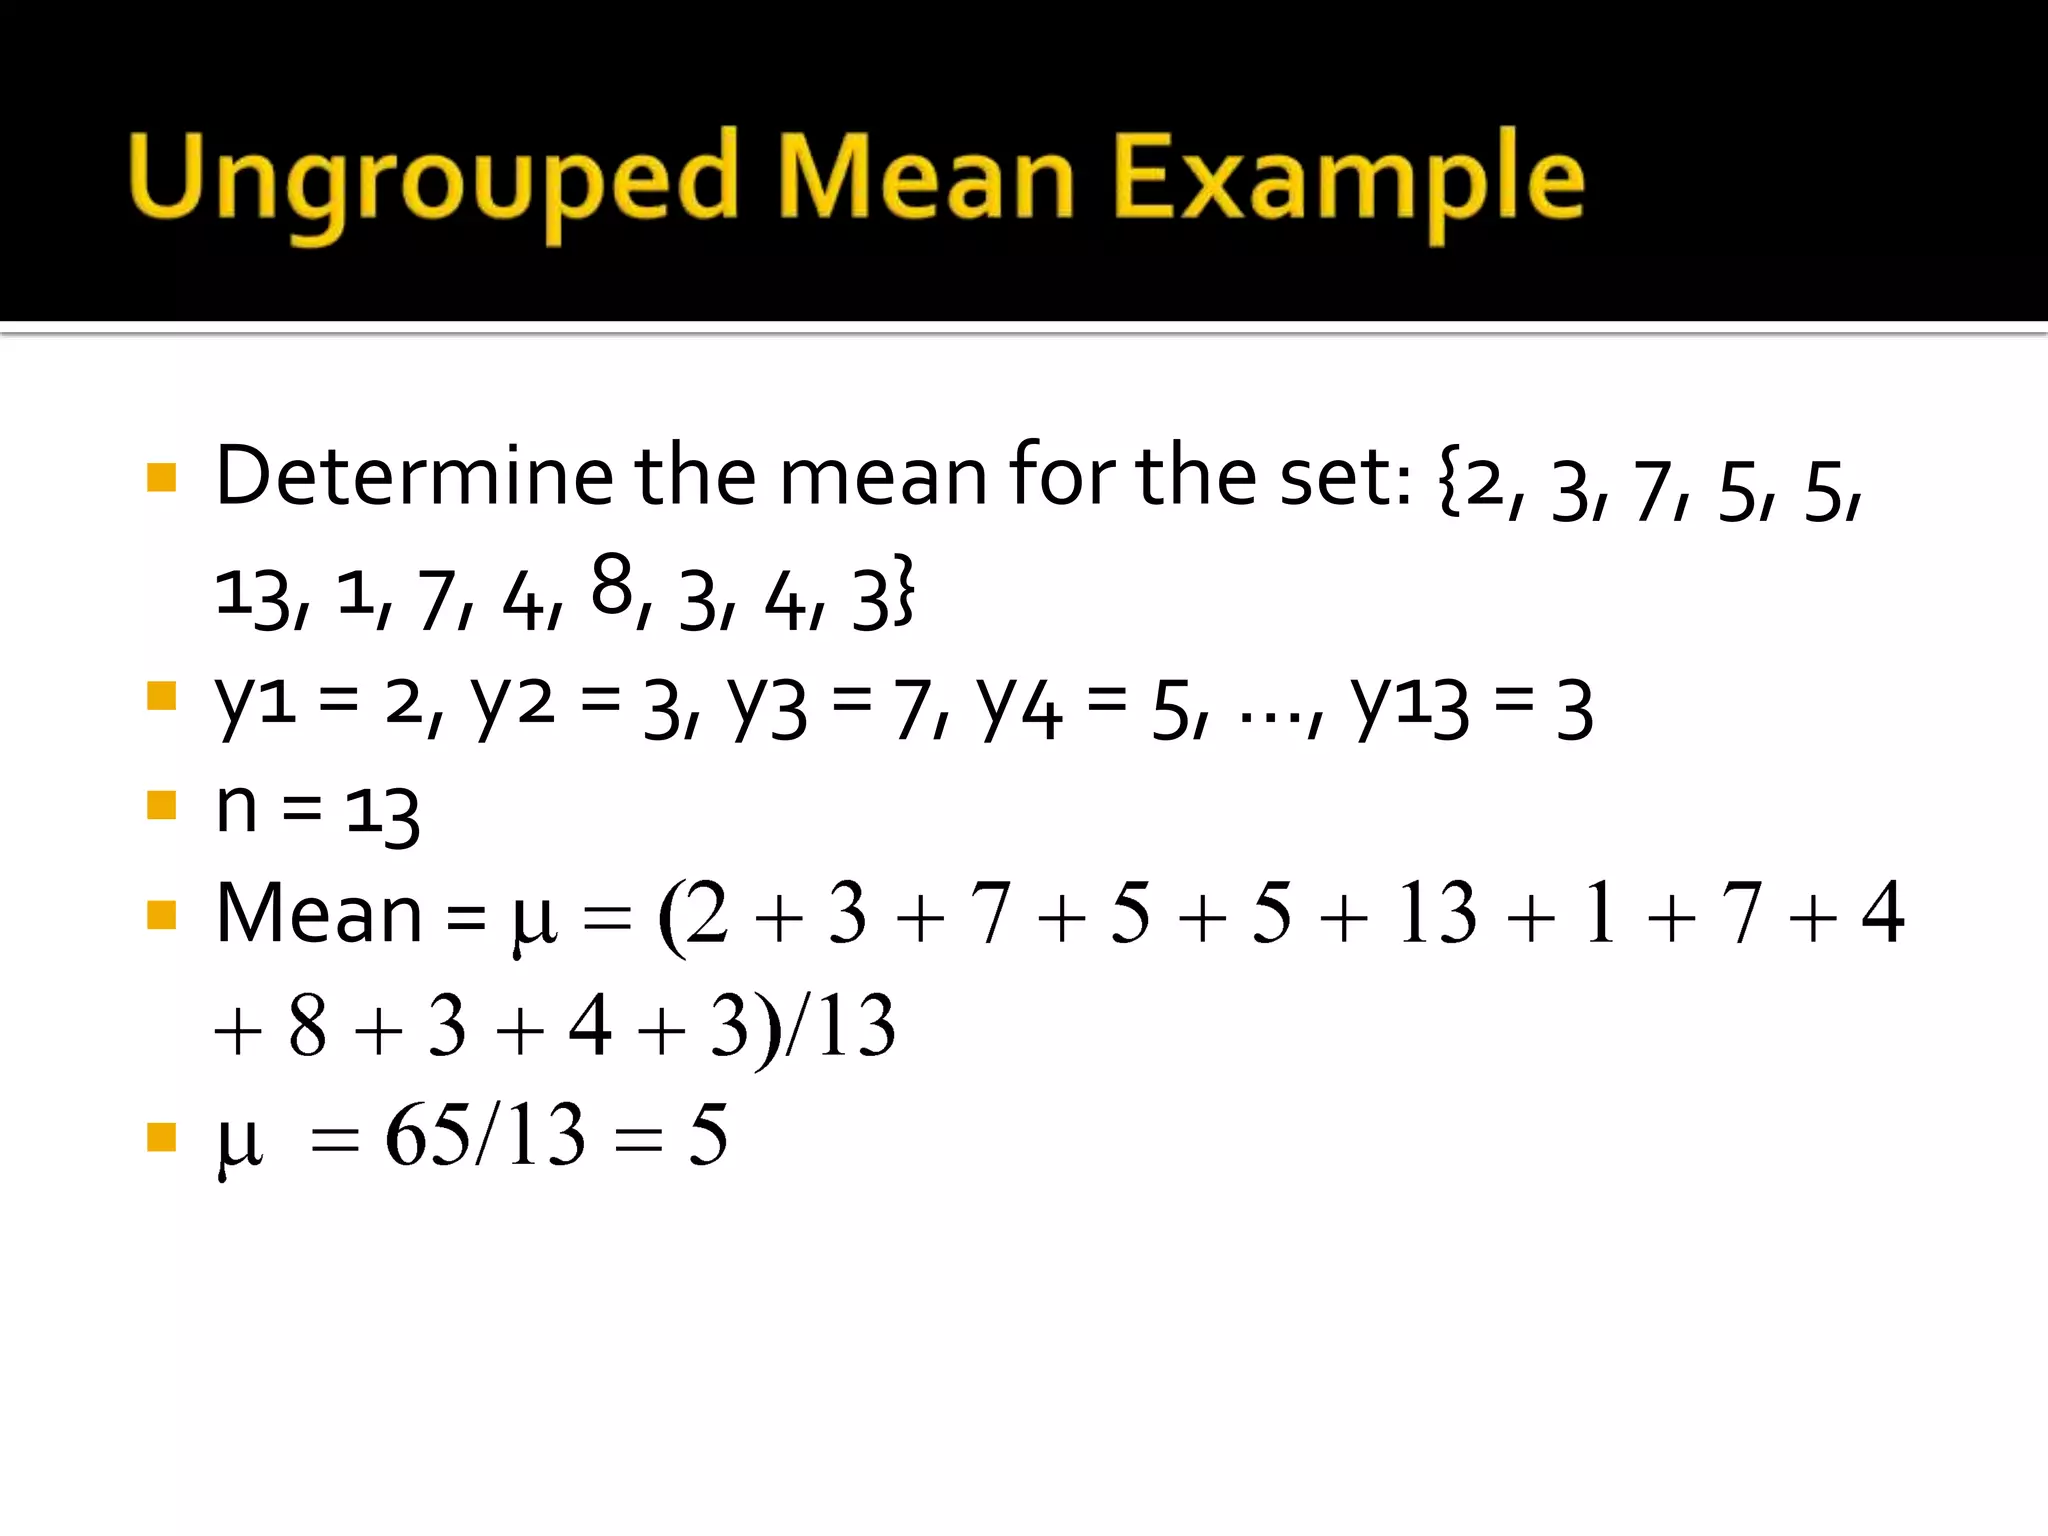
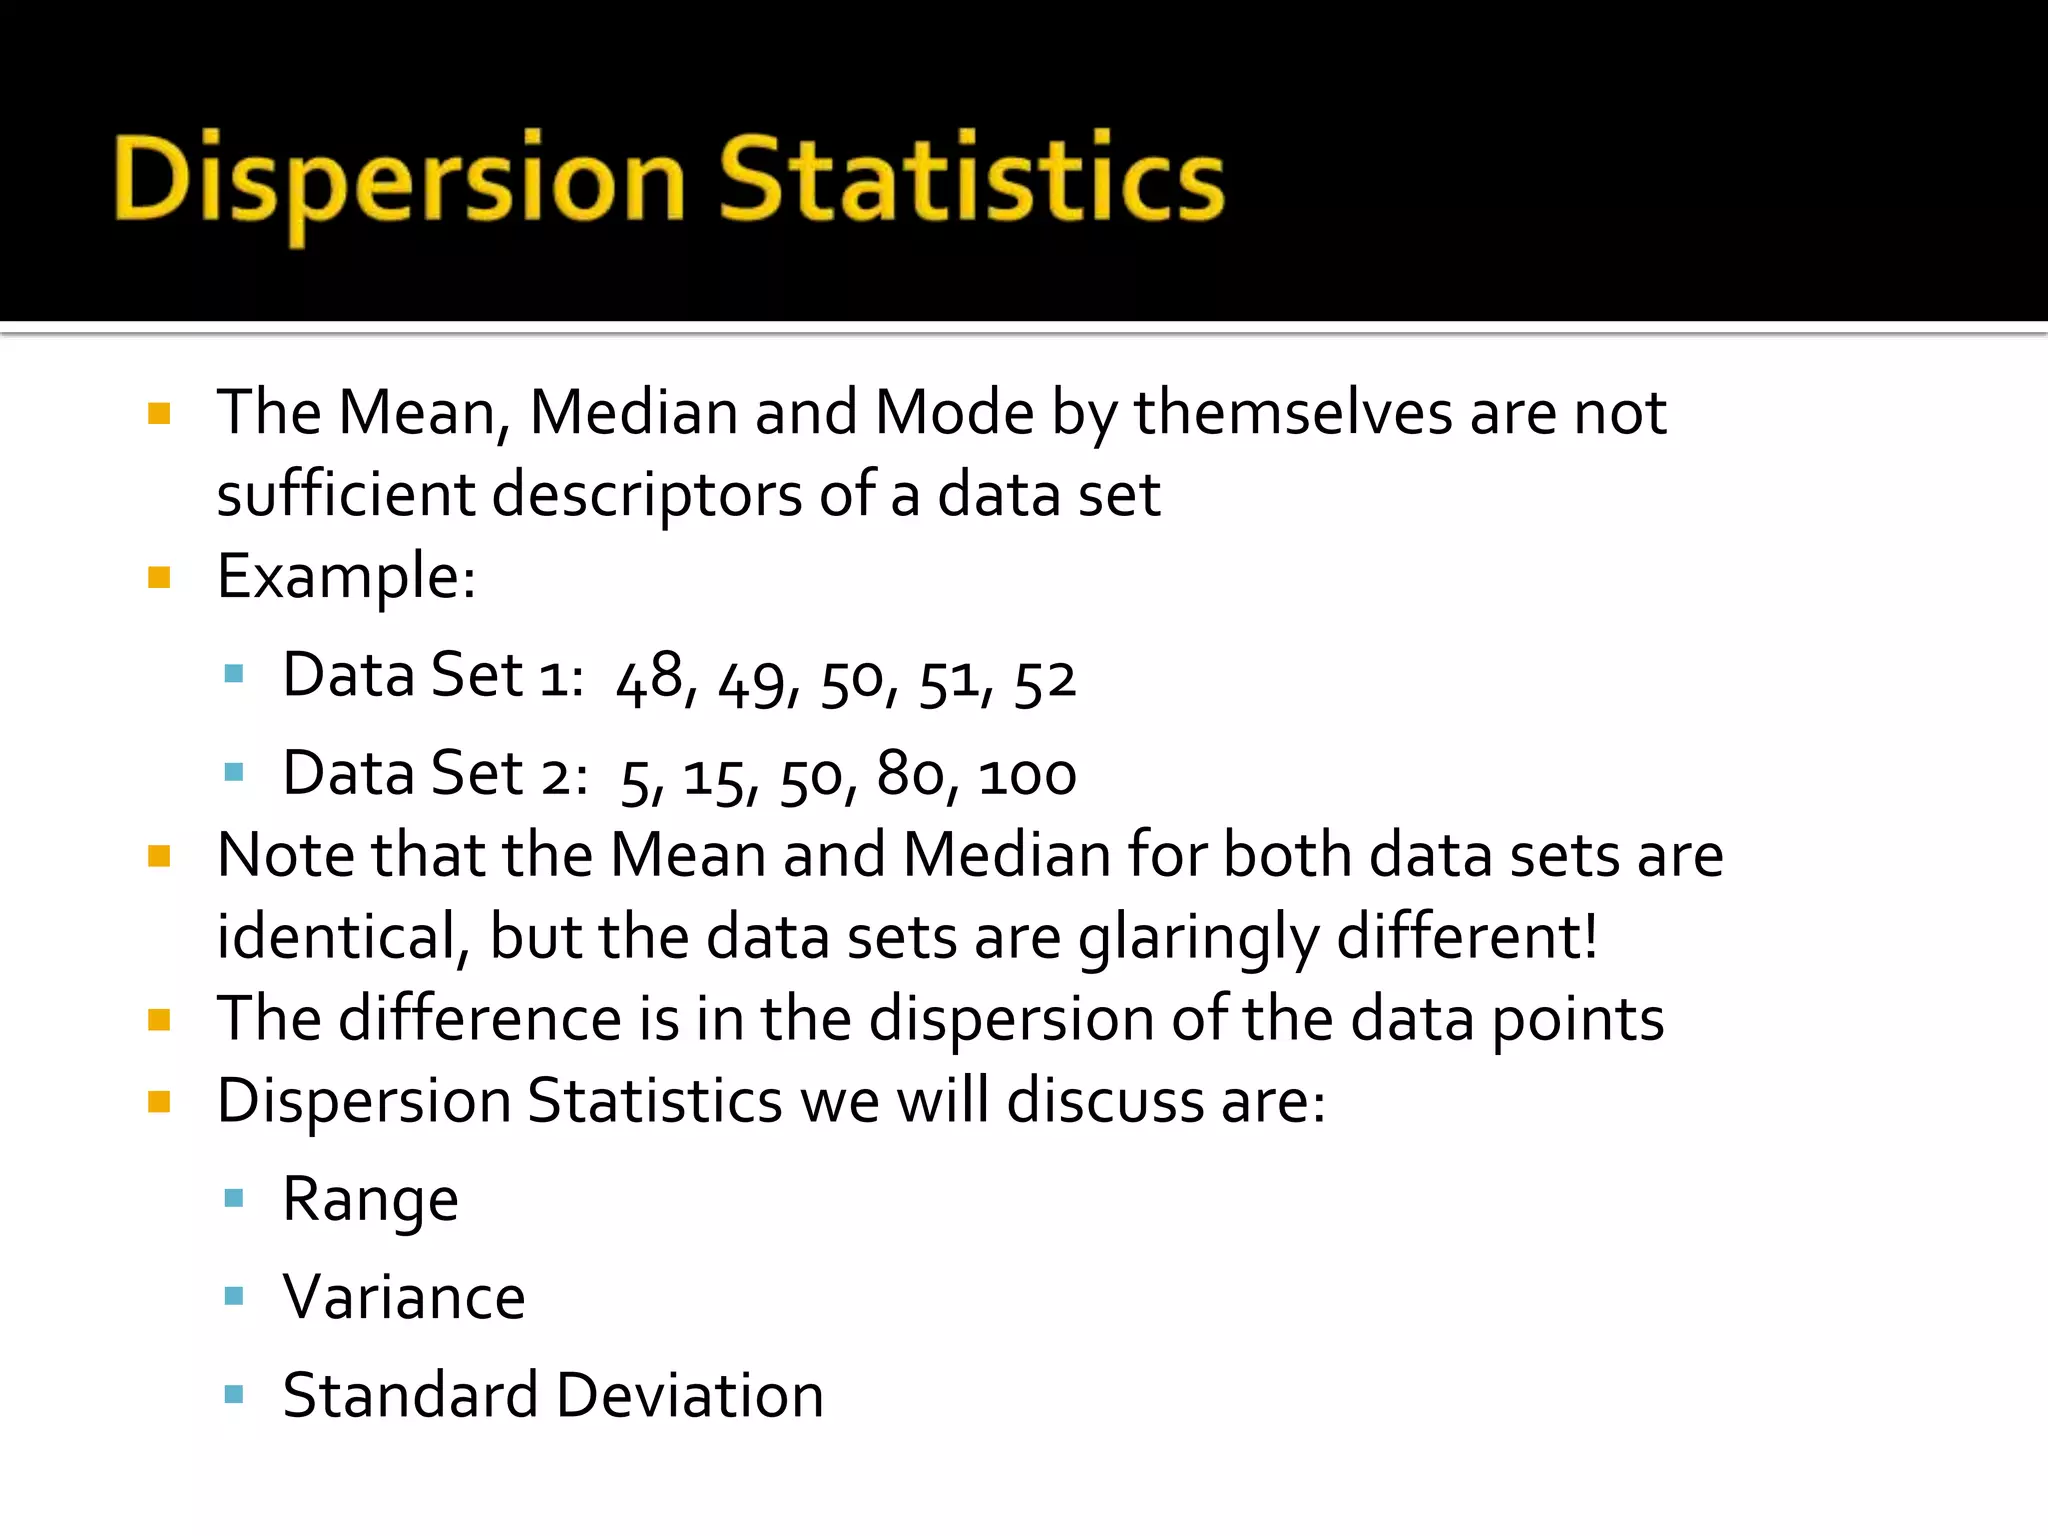
Statistics (P5)
 Data that has not been organized into groups.
 Ungrouped data looks like a big list of numbers.
 These statistics describe the “middle region” of the sample.
 Mean
▪ The arithmetic average of the data set.
 Median
▪ The “middle” of the data set.
 Mode
▪ The value in the data set that occurs most frequently.
 These are almost never the same, unless you have a perfectly symmetric
distribution. Mode Median
Mean
Mode = Median = Mean
 The Median is the middle observation of an ordered (from
low to high) data set
 Examples:
 1, 2, 4, 5, 5, 6, 8
▪ Here, the middle observation is 5, so the median is 5
 1, 3, 4, 4, 5, 7, 8, 8
▪ Here, there is no “middle” observation so we take the
average of the two observations at the center
5.4
2
54
Median
 The Mode is the value of the data set that occurs most frequently
 Example:
 1, 2, 4, 5, 5, 6, 8
▪ Here the Mode is 5, since 5 occurred twice and no other value
occurred more than once
 Data sets can have more than one mode, while the mean and
median have one unique value
 Data sets can also have NO mode, for example:
 1, 3, 5, 6, 7, 8, 9
▪ Here, no value occurs more frequently than any other,
therefore no mode exists
▪ You could also argue that this data set contains 7 modes since
each value occurs as frequently as every other
 The mean, ( is calculated by taking the sum
of the observed values (yi) divided by the
number of observations (n).
n
yyy
n
y
n
n
i
i
211
y
 Determine the mean for the set: {2, 3, 7, 5, 5,
13, 1, 7, 4, 8, 3, 4, 3}
 y1 = 2, y2 = 3, y3 = 7, y4 = 5, …, y13 = 3
 n = 13
 Mean =

 The Mean, Median and Mode by themselves are not
sufficient descriptors of a data set
 Example:
 Data Set 1: 48, 49, 50, 51, 52
 Data Set 2: 5, 15, 50, 80, 100
 Note that the Mean and Median for both data sets are
identical, but the data sets are glaringly different!
 The difference is in the dispersion of the data points
 Dispersion Statistics we will discuss are:
 Range
 Variance
 Standard Deviation
 The Range is simply the difference between the
smallest and largest observation in a data set
 Example
 Data Set 1: 48, 49, 50, 51, 52
 Data Set 2: 5, 15, 50, 80, 100
 The Range of data set 1 is 52 - 48 = 4
 The Range of data set 2 is 100 - 5 = 95
 So, while both data sets have the same mean
and median, the dispersion of the data, as
depicted by the range, is much smaller in data
set 1
 It gives the amount of dispersion or scatter in the data from
the central tendency (mean).
N
yi
2
)(
 Determine the standard deviation of the set:
{5, 6, 8, 4, 10, 3}
 Mean = y =
 (y - )2 = (5 - )2 + (6 - )2 + (8 - )2 + (4 - )2 +
(10 - )2 + (3 - )2
 (y - )2 = 12 + 02 + 22 + (-2) 2 + 42 + (-3) 2
 (y - )2 = 1 + 0 + 4 + 4 + 16 + 9 = 34
 Standard deviation = σ = √( (y - )2 / n)
 σ = √ 34 / 6 = √ 5.666 = 2.380
 TheVariance, σ 2, represents the amount of variability of
the data relative to their mean
N
yi
2
2
)(
 Determine the variance of the set of the set:
{5, 6, 8, 4, 10, 3}
 As previously shown:
 Mean =
 (y - )2 = 34
 n = 6
 Variance = σ2 = (y - )2 / n = 34/6 = 5.666

P5 ungrouped data

  • 1.
  • 2.
     Data thathas not been organized into groups.  Ungrouped data looks like a big list of numbers.
  • 3.
     These statisticsdescribe the “middle region” of the sample.  Mean ▪ The arithmetic average of the data set.  Median ▪ The “middle” of the data set.  Mode ▪ The value in the data set that occurs most frequently.  These are almost never the same, unless you have a perfectly symmetric distribution. Mode Median Mean Mode = Median = Mean
  • 4.
     The Medianis the middle observation of an ordered (from low to high) data set  Examples:  1, 2, 4, 5, 5, 6, 8 ▪ Here, the middle observation is 5, so the median is 5  1, 3, 4, 4, 5, 7, 8, 8 ▪ Here, there is no “middle” observation so we take the average of the two observations at the center 5.4 2 54 Median
  • 5.
     The Modeis the value of the data set that occurs most frequently  Example:  1, 2, 4, 5, 5, 6, 8 ▪ Here the Mode is 5, since 5 occurred twice and no other value occurred more than once  Data sets can have more than one mode, while the mean and median have one unique value  Data sets can also have NO mode, for example:  1, 3, 5, 6, 7, 8, 9 ▪ Here, no value occurs more frequently than any other, therefore no mode exists ▪ You could also argue that this data set contains 7 modes since each value occurs as frequently as every other
  • 6.
     The mean,( is calculated by taking the sum of the observed values (yi) divided by the number of observations (n). n yyy n y n n i i 211 y
  • 7.
     Determine themean for the set: {2, 3, 7, 5, 5, 13, 1, 7, 4, 8, 3, 4, 3}  y1 = 2, y2 = 3, y3 = 7, y4 = 5, …, y13 = 3  n = 13  Mean = 
  • 8.
     The Mean,Median and Mode by themselves are not sufficient descriptors of a data set  Example:  Data Set 1: 48, 49, 50, 51, 52  Data Set 2: 5, 15, 50, 80, 100  Note that the Mean and Median for both data sets are identical, but the data sets are glaringly different!  The difference is in the dispersion of the data points  Dispersion Statistics we will discuss are:  Range  Variance  Standard Deviation
  • 9.
     The Rangeis simply the difference between the smallest and largest observation in a data set  Example  Data Set 1: 48, 49, 50, 51, 52  Data Set 2: 5, 15, 50, 80, 100  The Range of data set 1 is 52 - 48 = 4  The Range of data set 2 is 100 - 5 = 95  So, while both data sets have the same mean and median, the dispersion of the data, as depicted by the range, is much smaller in data set 1
  • 11.
     It givesthe amount of dispersion or scatter in the data from the central tendency (mean). N yi 2 )(
  • 12.
     Determine thestandard deviation of the set: {5, 6, 8, 4, 10, 3}  Mean = y =  (y - )2 = (5 - )2 + (6 - )2 + (8 - )2 + (4 - )2 + (10 - )2 + (3 - )2  (y - )2 = 12 + 02 + 22 + (-2) 2 + 42 + (-3) 2  (y - )2 = 1 + 0 + 4 + 4 + 16 + 9 = 34  Standard deviation = σ = √( (y - )2 / n)  σ = √ 34 / 6 = √ 5.666 = 2.380
  • 13.
     TheVariance, σ2, represents the amount of variability of the data relative to their mean N yi 2 2 )(
  • 14.
     Determine thevariance of the set of the set: {5, 6, 8, 4, 10, 3}  As previously shown:  Mean =  (y - )2 = 34  n = 6  Variance = σ2 = (y - )2 / n = 34/6 = 5.666