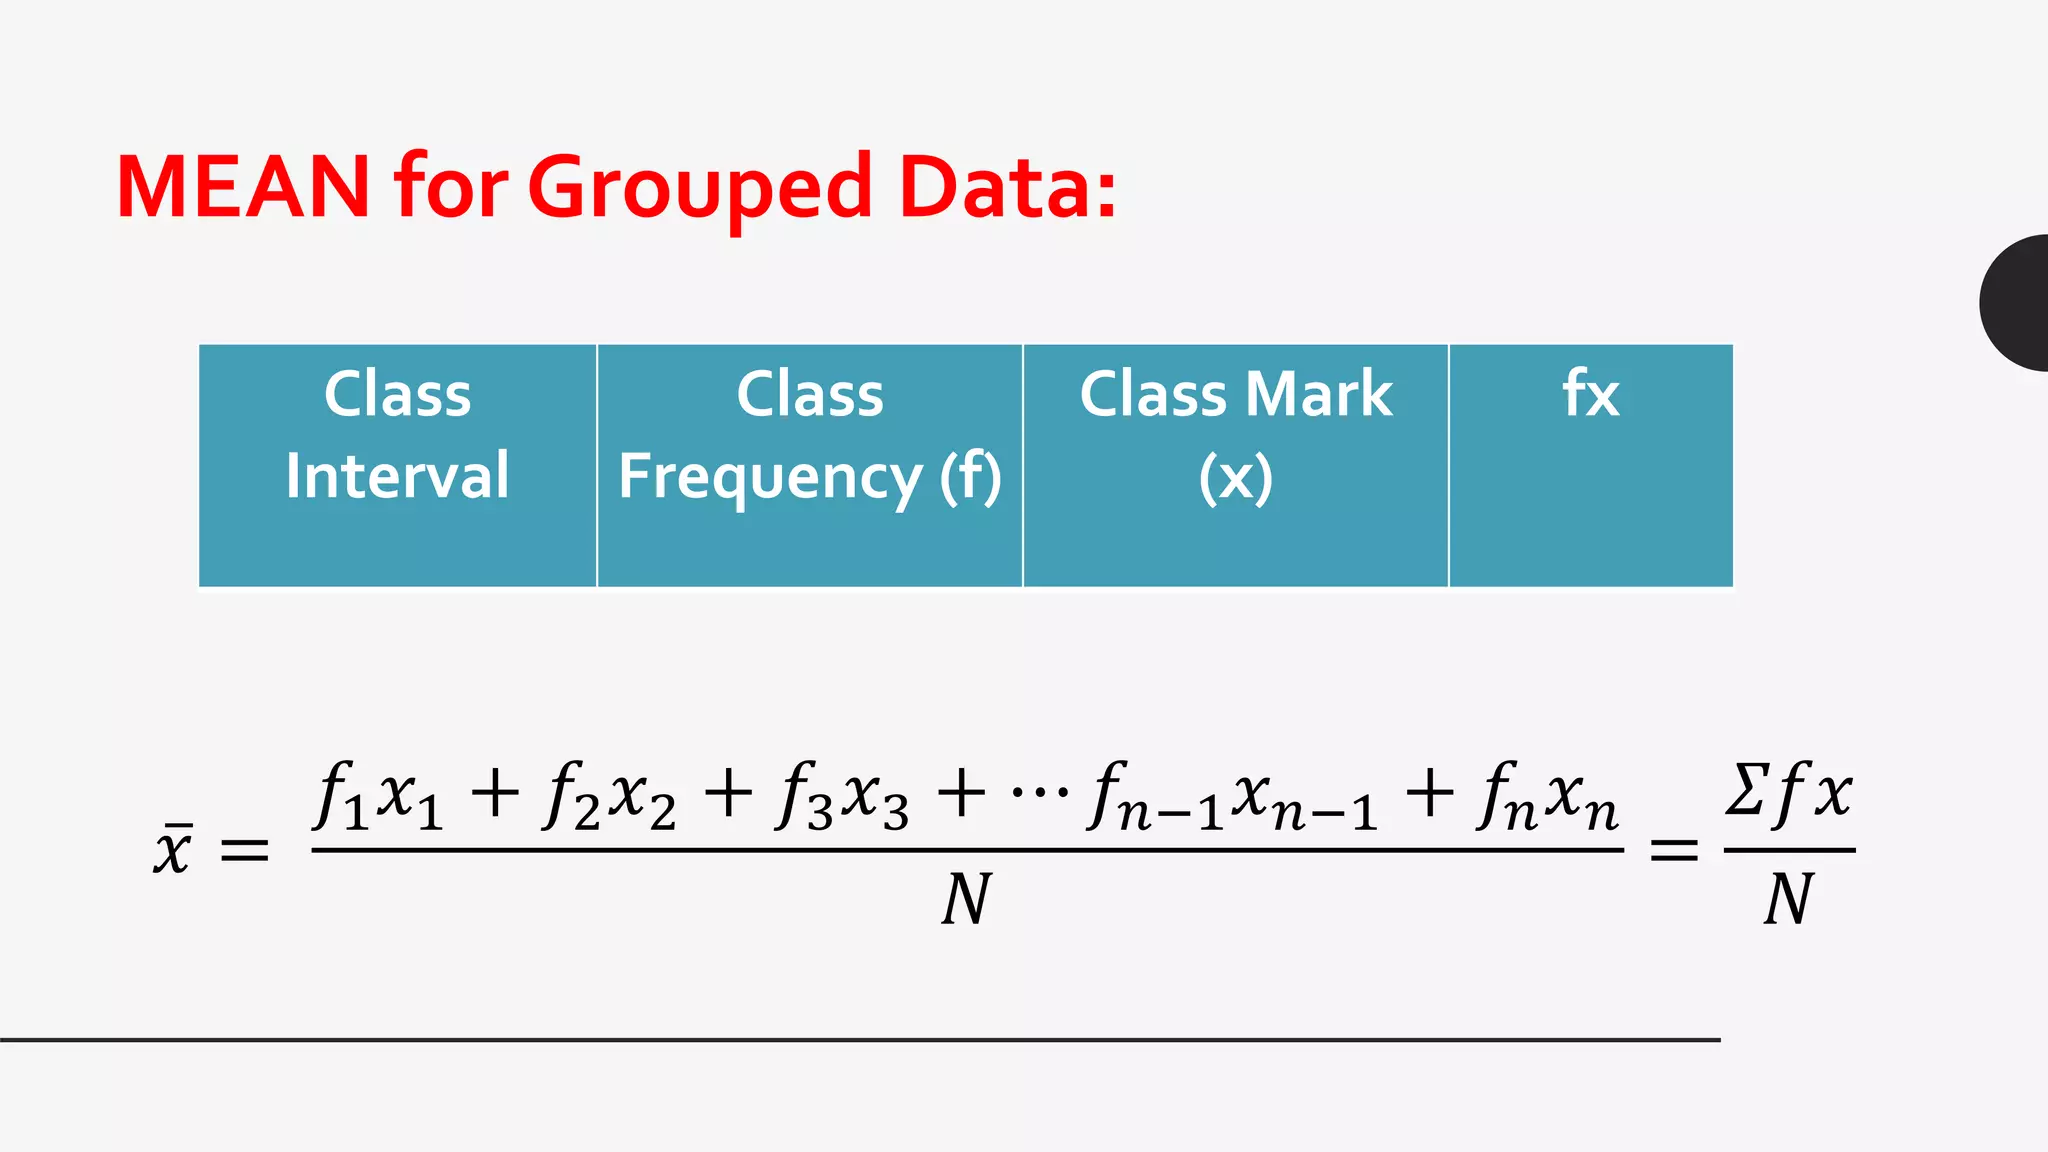
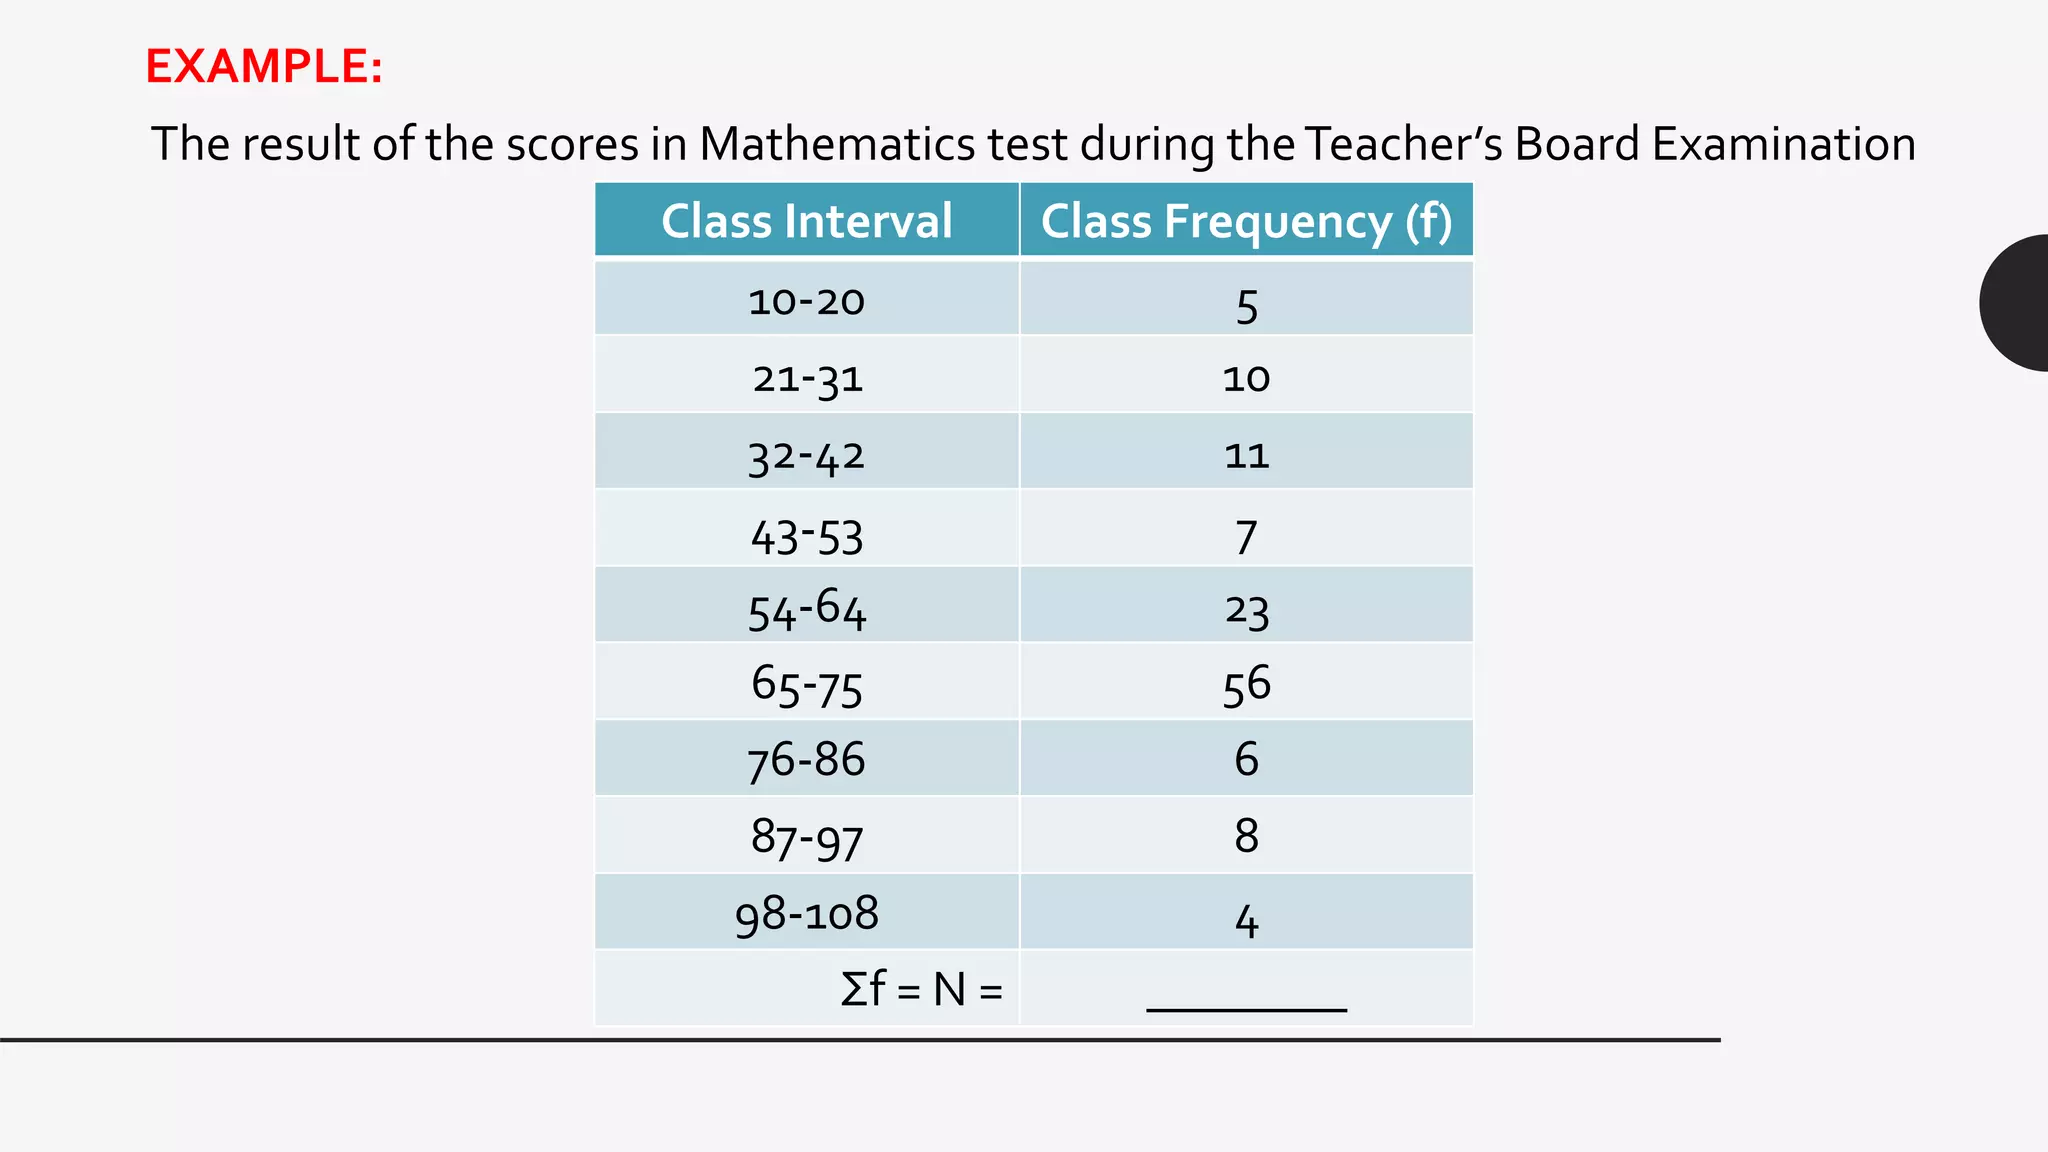
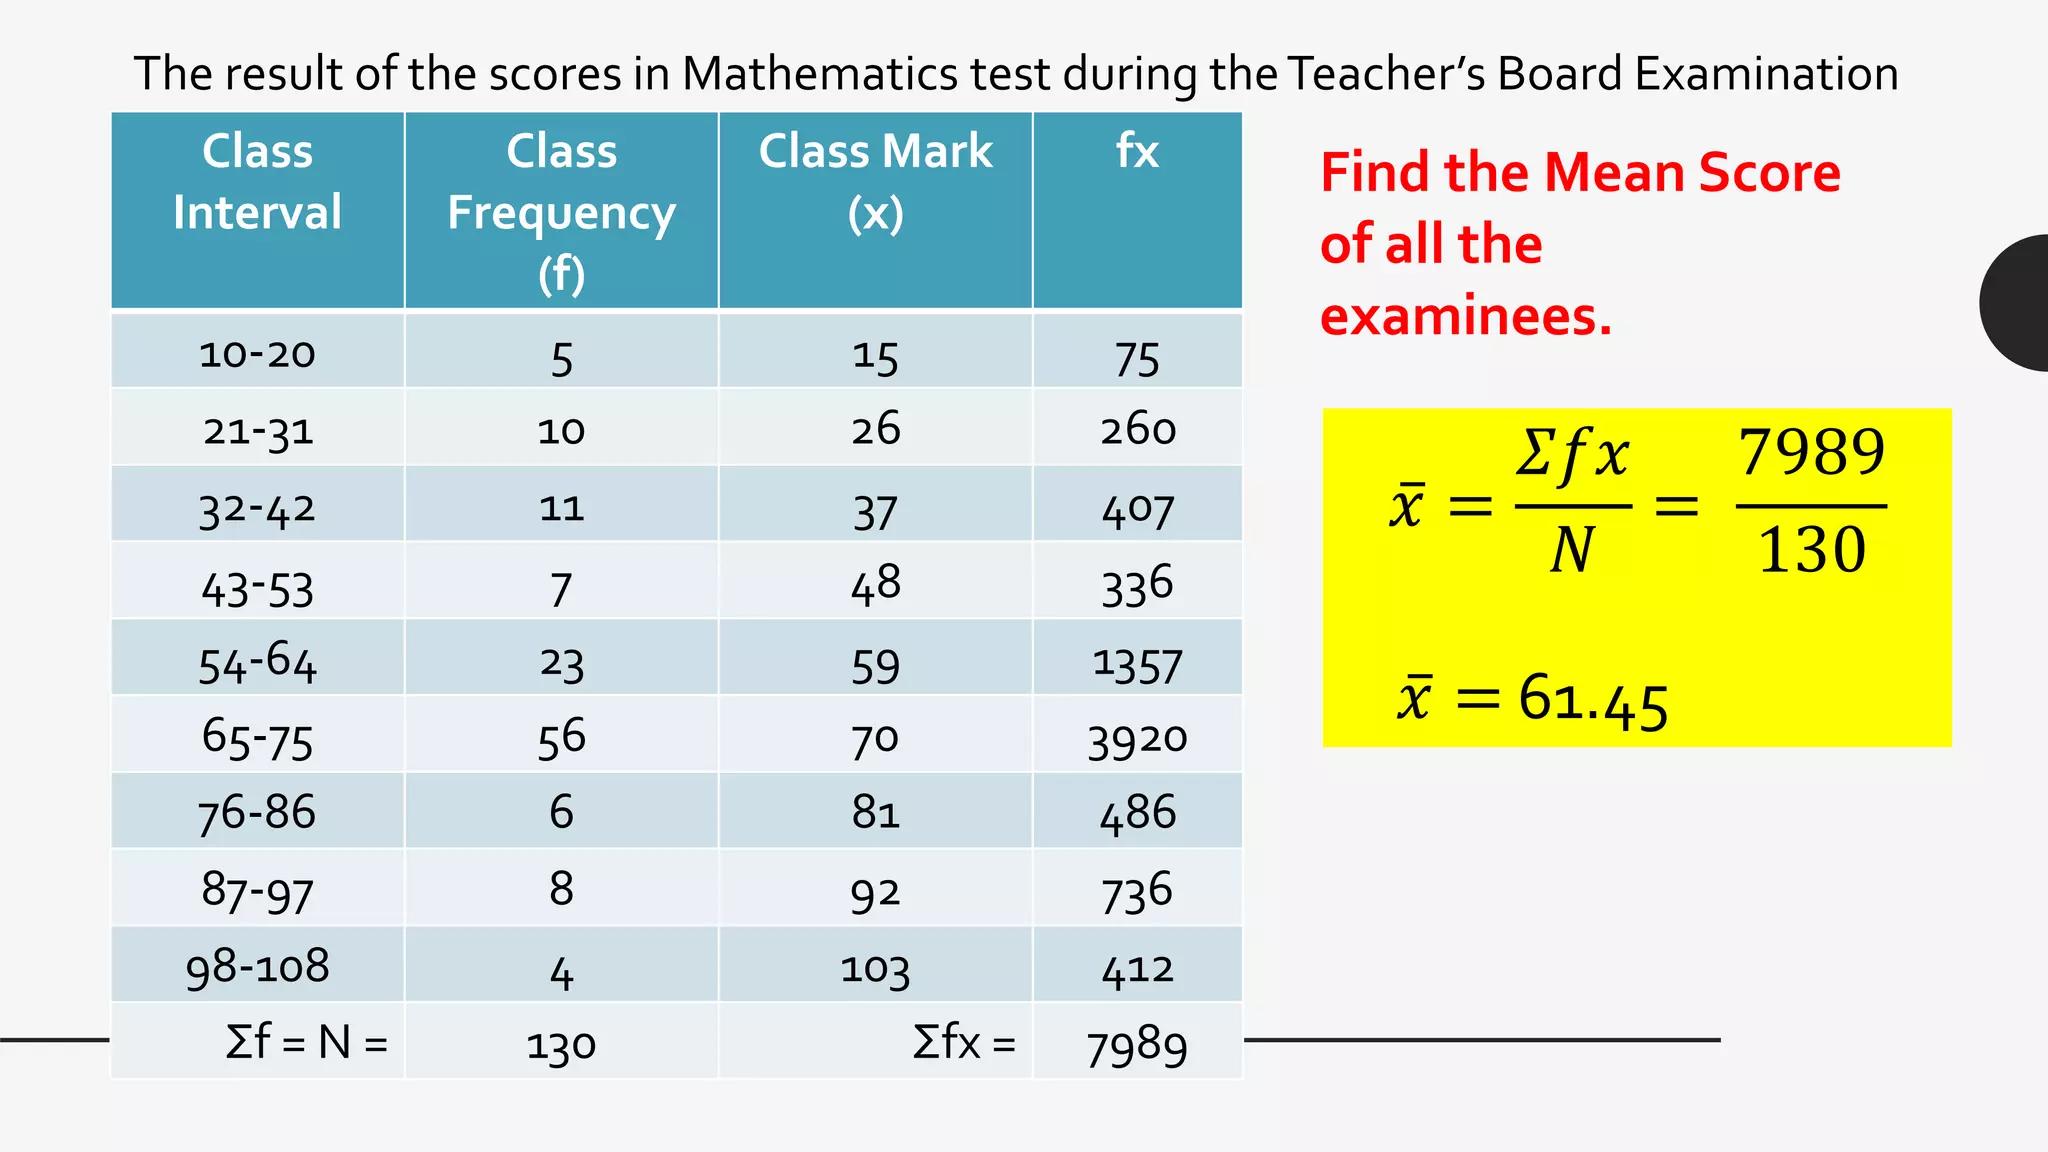
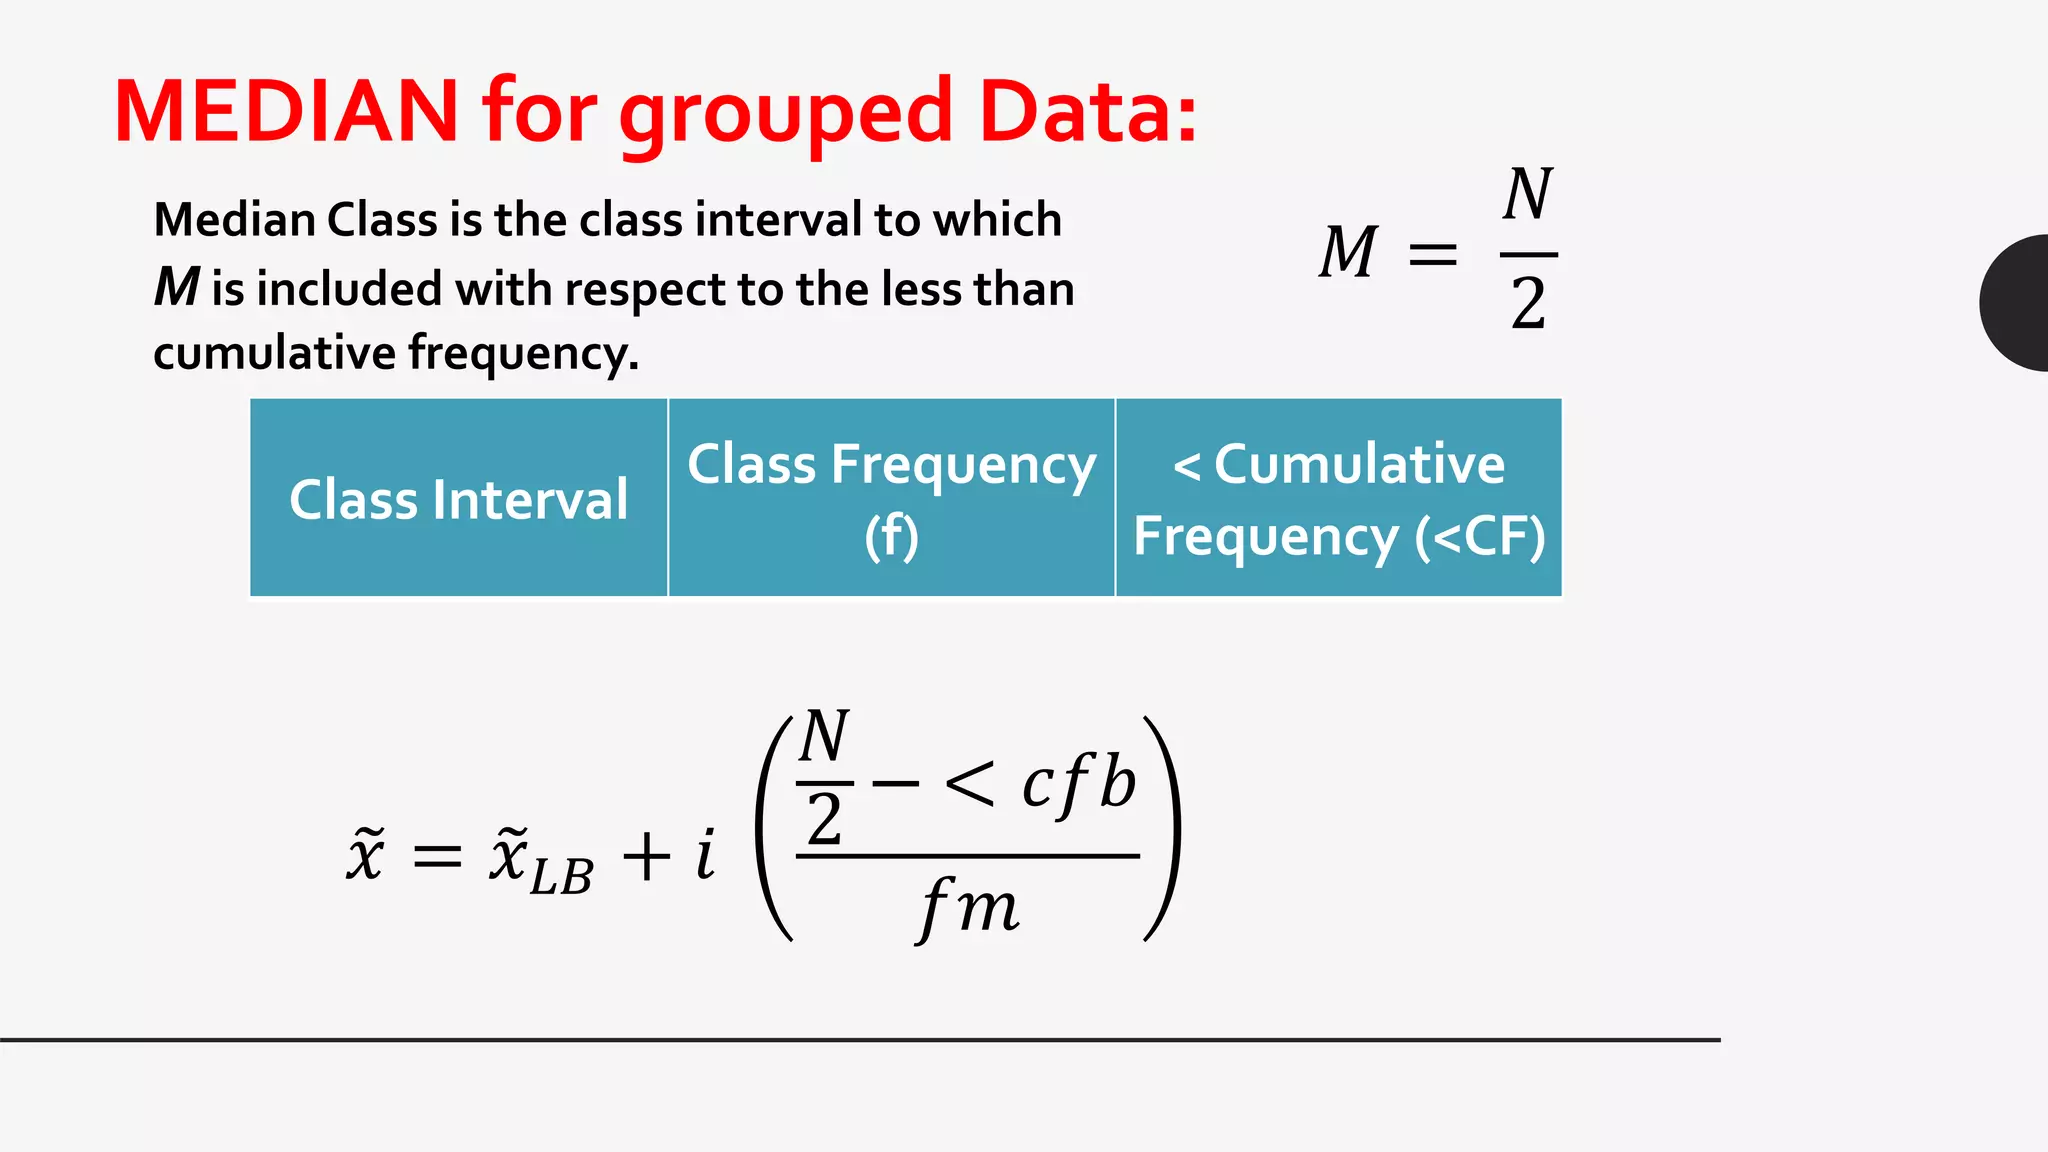
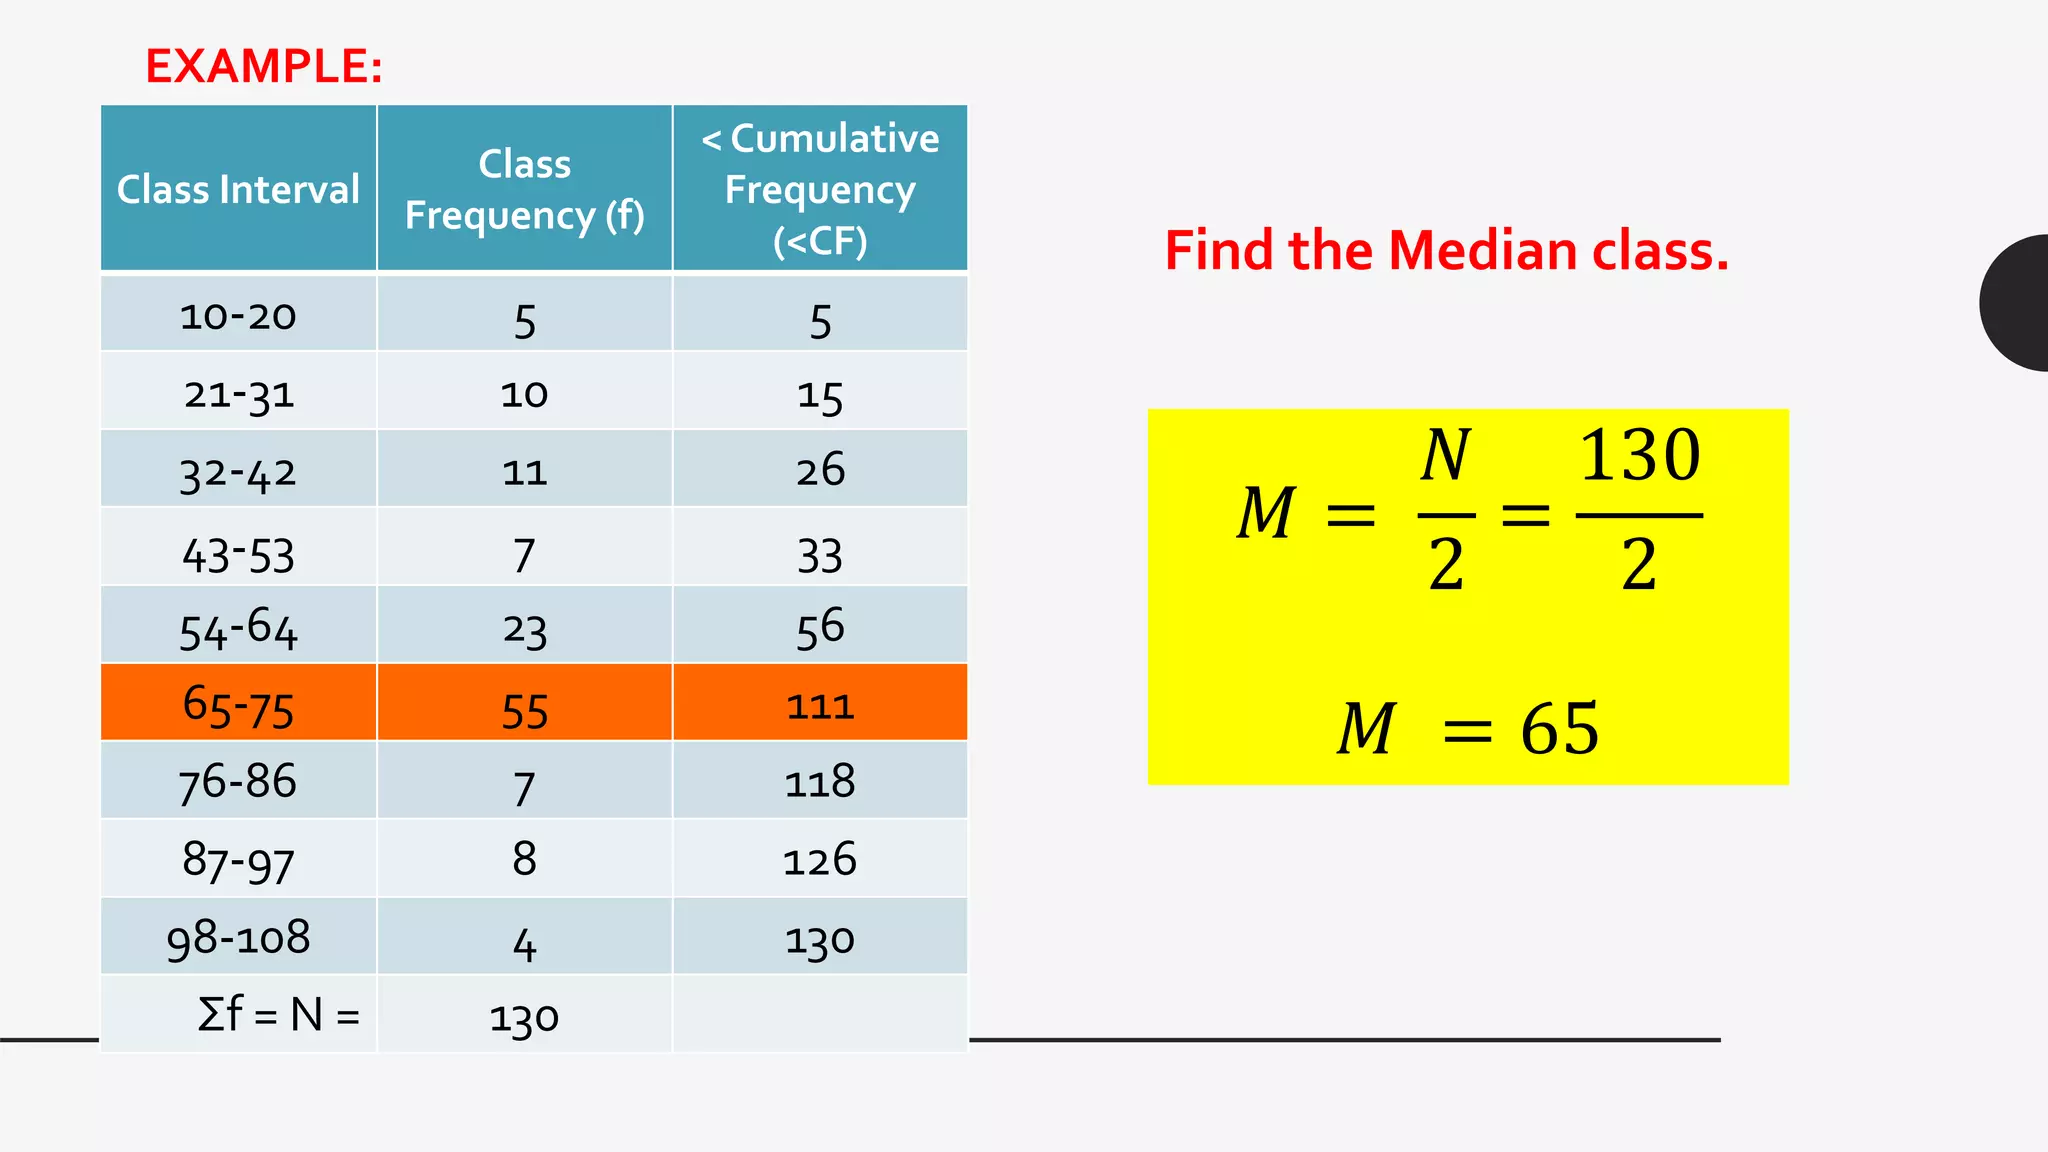
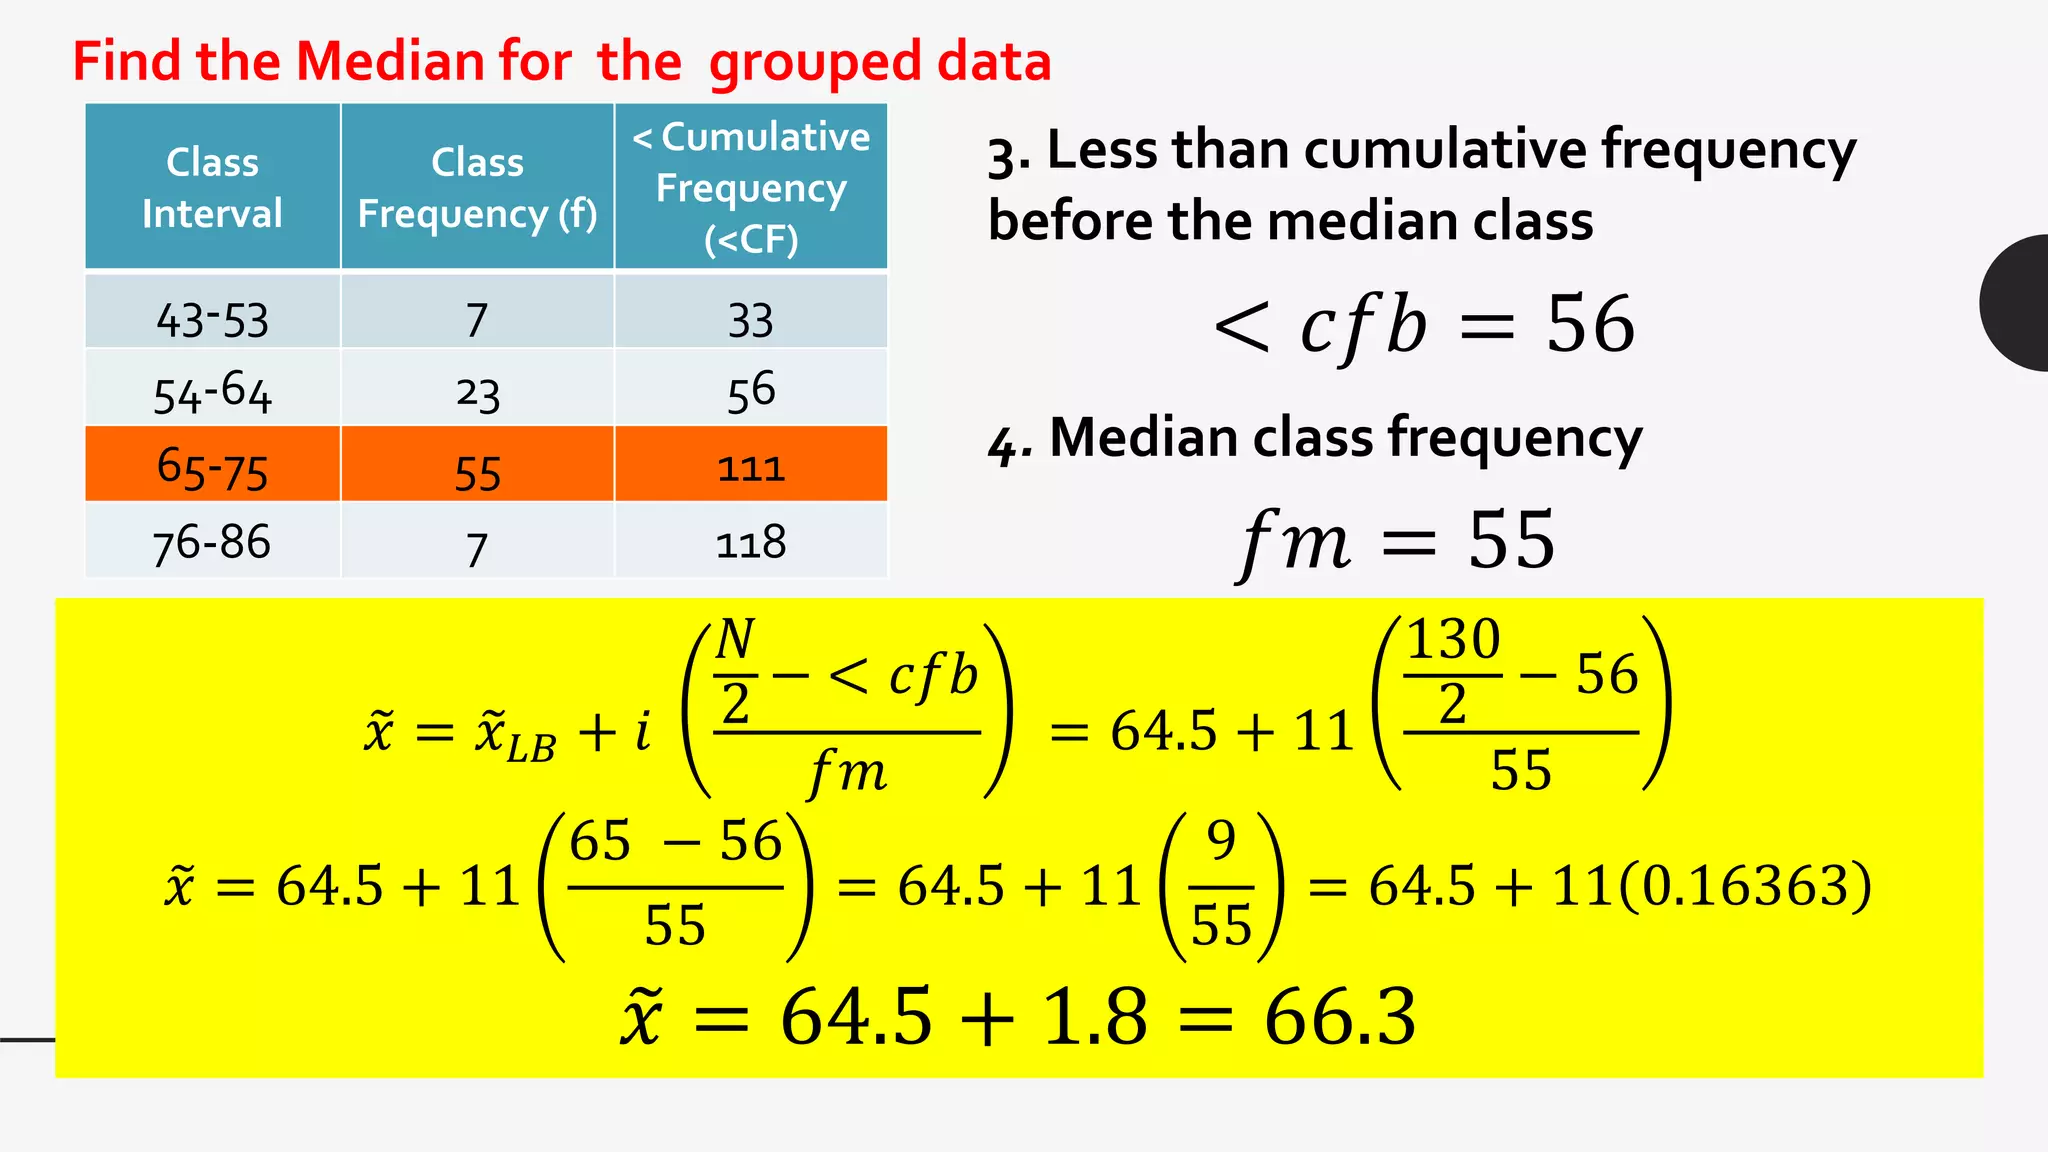
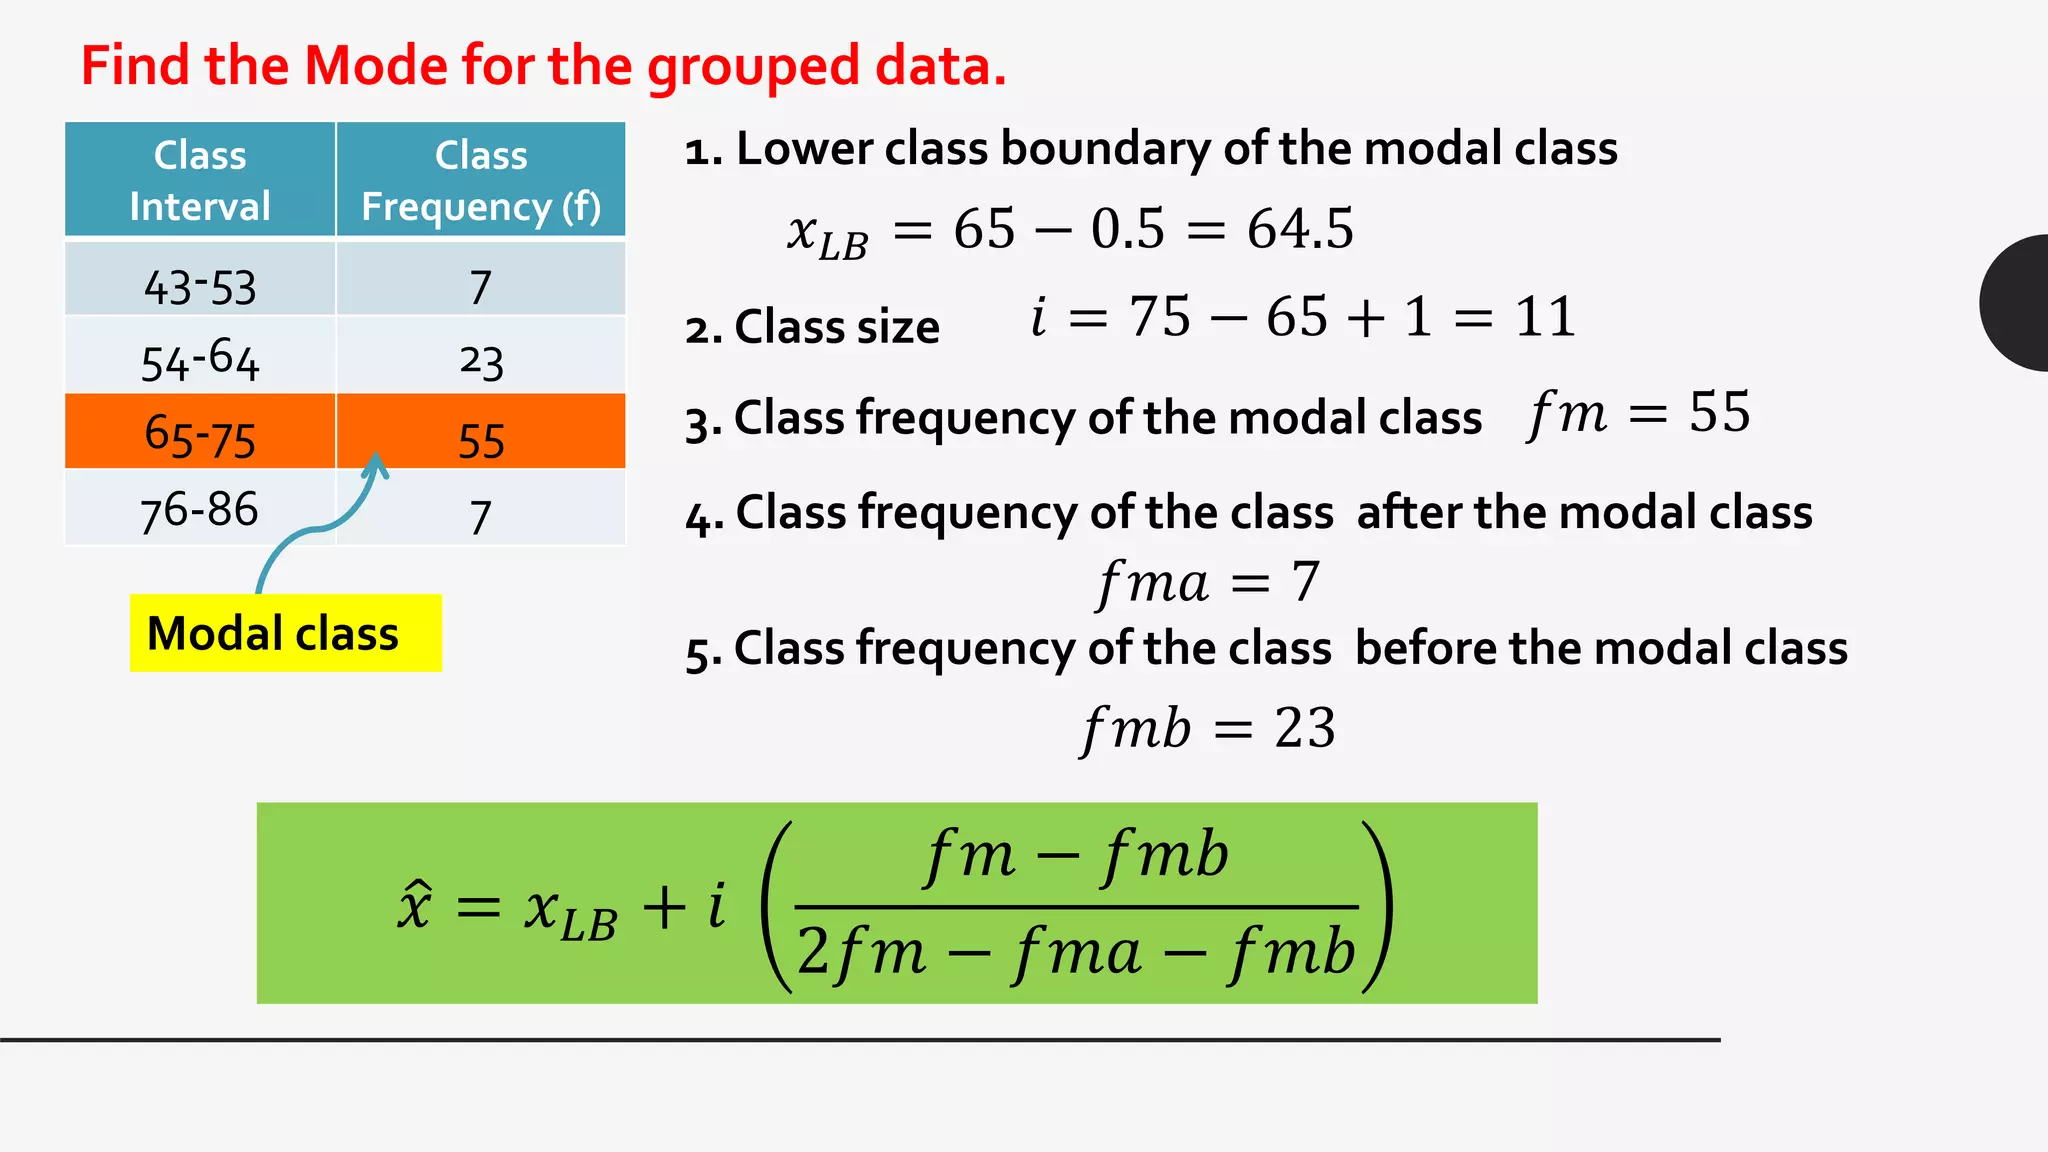
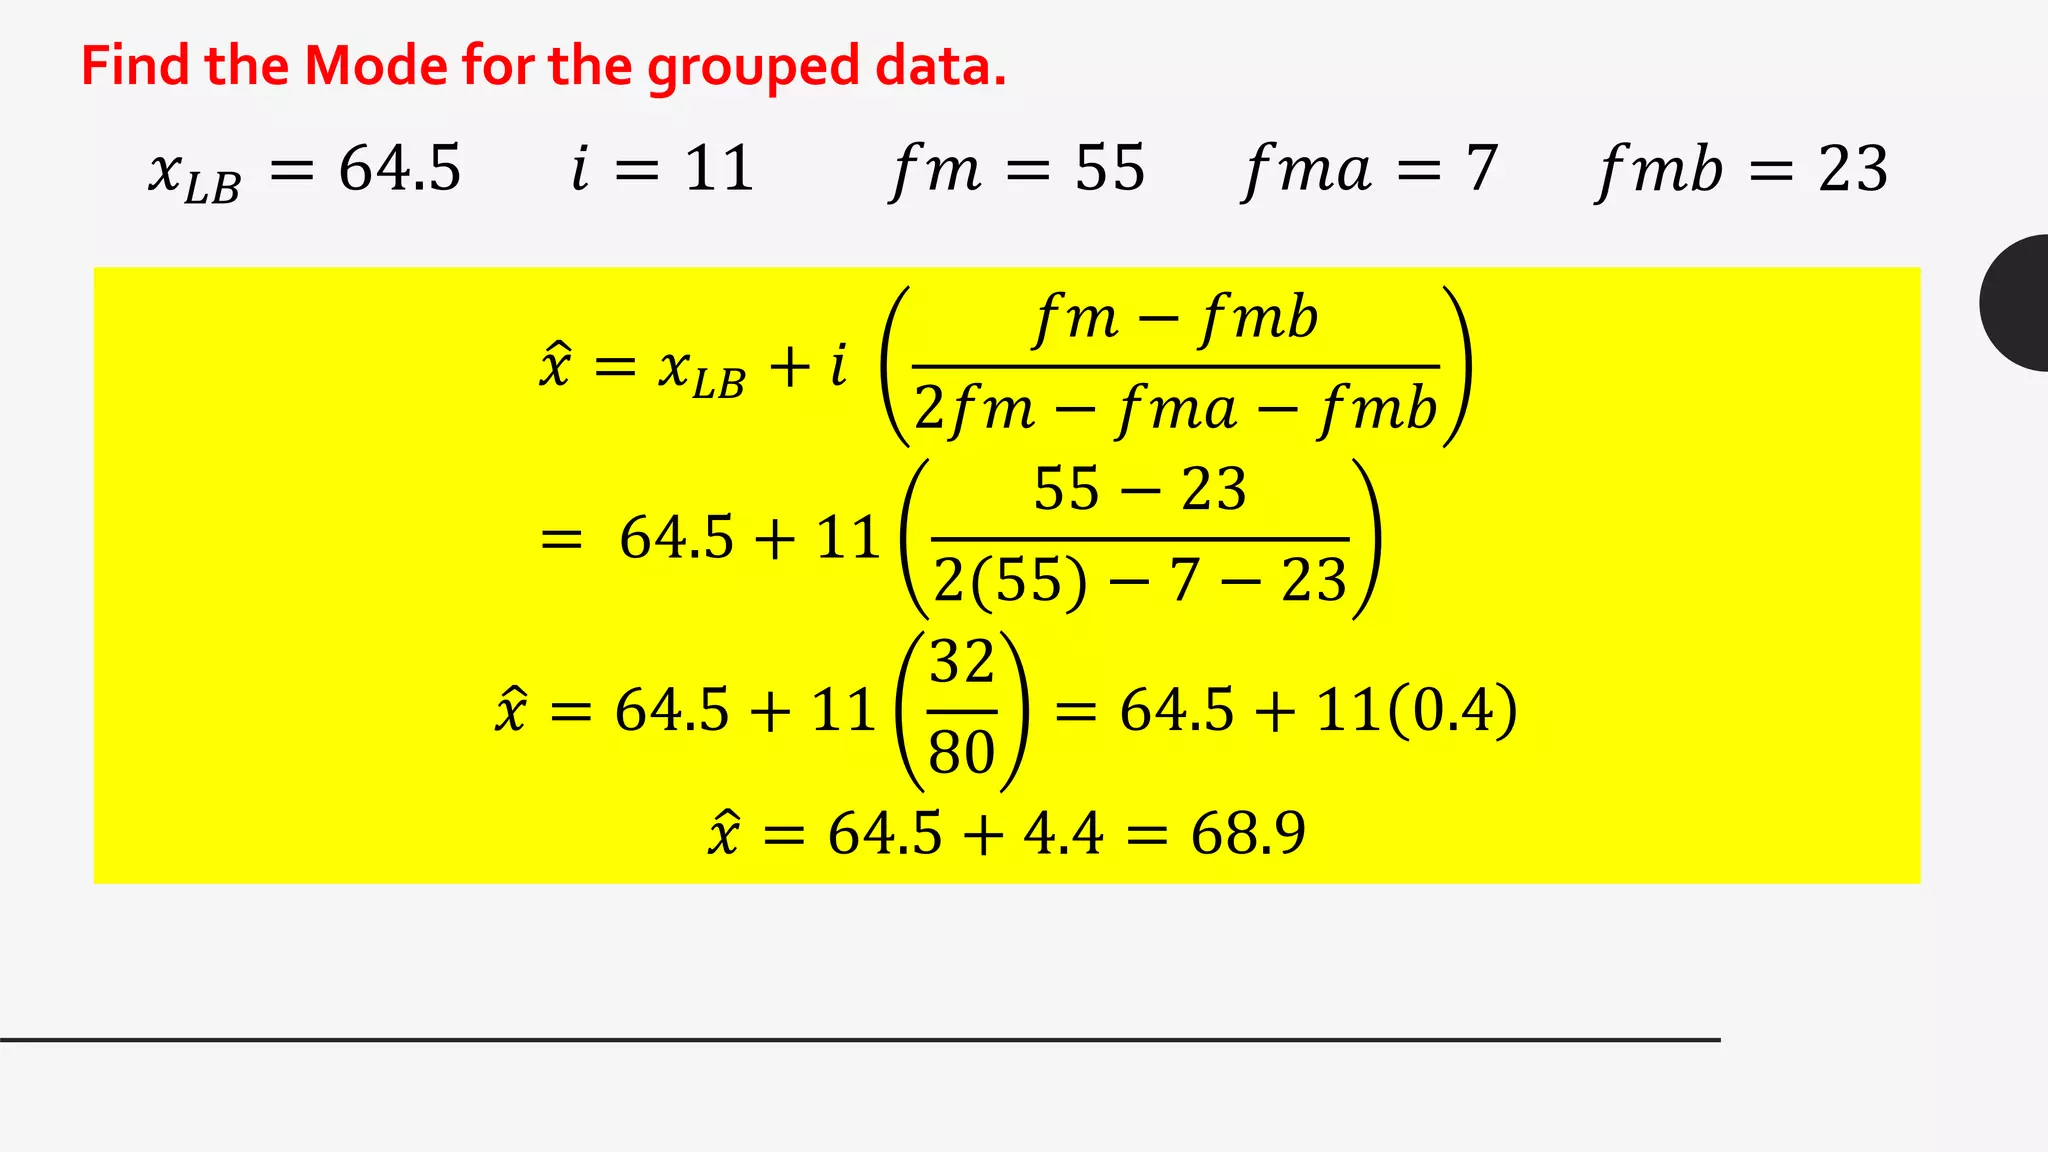
SlideShare a Scribd company logo
STATISTICS AND
PROBABILITY
Lesson 6 and Lesson 7
Ms. Maria Christita Polinag
Miriam College Adult Education
MEASURES OF
CENTRAL
TENDENCY
LESSON 6
Frequency distribution table of the monthly income of 35
families residing in a nearby barangay/village
1. What is the highest monthly family income? Lowest?
2.What monthly family income is most frequent in the village?
3. If you list down individually the values of the monthly family
income from lowest to highest, what is the monthly family
income where half of the total number of families have monthly
family income less than or equal to that value while the other
half have monthly family income greater than that value?
4.What is the average monthly family income?
1. What is the highest monthly family income? Lowest?
Maximum and Minimum
- summary measures of a data set
- these measures do not give
a measure of location in the center of the distribution
Answer: Highest monthly family income is 60,000 pesos
while the lowest is 12,000 pesos.
2. What monthly family income is most frequent in the village?
ModalValue or Mode
-the value with the highest frequency
-is the most fashionable value in the data set
Answer: Monthly family income that is most frequent is
32,250 pesos.
3. If you list down individually the values of the monthly
family income from lowest to highest, what is the monthly
family income where half of the total number of families
have monthly family income less than or equal to that value
while the other half have monthly family income greater
than that value?
Median
32, 250
When arranged in increasing order or the data come in
an array as in the following:
12,000; 12,000; 20,000; 20,000; 20,000; 24,000; 24,000;
24,000; 24,000; 25,000; 25,000;25,000; 25,000; 25,000;
25,000; 25,000; 25,000; 32,250; 32,250; 32,250; 32,250;
32,250; 32,250; 32,250; 32,250; 32,250; 36,000; 36,000;
36,000; 36,000; 36,000; 40,000; 40,000; 60,000; 60,000;
Median
- is found in the center of the distribution.
If N is odd the Median is the observation in the
array
If N is even the Median is the average of the two middle
values or it is average of the and
observation s
4. What is the average monthly family income?
Arithmetic Mean or Mean
-is computed by adding all the values and then the sum
is divided by the number of values included in the sum
- is also found somewhere in the center of the
distribution
Answer: When computed using the data values, the average
is 30,007.14 pesos.
Summation: ‘sum of observations represented by xi
where i takes the values from1 to N,
and N refers to the total number of
observations being added’
Arithmetic Mean or Mean
Using the example with 35 observations of family
income, the mean is computed as:
Mean :
μ = 30, 007.14
PROPERTIES OFTHE MEAN, MEDIAN AND MODE
 basis for determining what measure to use to represent
the center of the distribution
Arithmetic Mean or Mean
 computed only for quantitative variables that are
measured at least in the interval scale
 linked to a “center of gravity”
 each observation has a contribution to the
value of the mean
 are also amenable to further computation; you
can combine subgroup means to come up with
the mean for all observations
Arithmetic Mean or Mean
Example:
If there are 3 groups with means equal to 10, 5 and 7
computed from 5, 15, and 10 observations respectively.
Arithmetic Mean or Mean
 outliers do affect the value of the mean
-If there are extreme large values, the mean will tend to
be ‘pulled upward’
-if there are extreme small values, the mean will tend to
be ‘pulled downward’
 In the presence of extreme values or outliers, the mean is not
a good measure of the center
Median
 computed for quantitative variables
 but can be computed for variables measured in at
least in the ordinal scale, in determining the center of
the distribution
 it is not easily affected by extreme values or outliers
ModalValue or Mode
 computed for the data set which are mainly measured in the
nominal scale of measurement; sometimes referred to as the
nominal average
 can easily be picked out by ocular inspection, especially if the
data are not too many
 more helpful measure for discrete and qualitative data with
numeric codes than for other types of data
ModalValue or Mode
o unimodal if there is a unique mode
o bimodal if there are two modes
o multimodal if there are more than two modes
A measure of central tendency is a location measure that
pinpoints the center or middle value.
OTHER
MEASURES OF
LOCATION
LESSON 7
Distribution of scores in a 50-item long test of
150 Grade 11 students of a nearby Senior High School
1. What is the highest score? Lowest score?
2.What is the most frequent score?
3.What is the median score?
4.What is the average or mean score?
1.What is the highest score? Lowest score?
Answer: Highest score is 50 while the lowest is 10.
2.What is the most frequent score?
Answer: Most frequent score is 38 which is the score of 28
students.
3.What is the median score?
Answer: The median score is 33 which implies that 50% of the
students or around 75 students have score at most 33.
4.What is the average or mean score?
Answer: On the average, the students got 32.04667 or 32
(rounded off) out of 50 items correctly.
1. What is the score where at most 75% of the 150
students scored less or equal to it?
2. Do you think the long test is easy since 75 students
have scores at most 33 out of 50?
3. Do you need to be alarmed when 10% of the class got a
score of at most 20 out of 50?
Questions could be answered by knowing other
measures of location:
Measures of Location: Maximum, Minimum, Percentiles,
Deciles and Quatiles
Percentile is a measure that pinpoints a location that
divides distribution into 100 equal parts.
It is usually represented by Pj, that value which
separates the bottom j% of the distribution from the
top (100-j)%.
 It is usually represented by Pj, that value which separates the
bottom j% of the distribution from the top (100-j)%.
- P30 is the value that separates the bottom 30% of the
distribution to the top 70%
- we say 30% of the total number of observations in the data
set are said to be less than or equal to P30 while the remaining
70% have values greater than P30.
Step 1: Arrange the data values in ascending order of
magnitude.
Step 2: Find the location of Pj in the arranged list by
computing L = (j/100) x N, where N is the total number of
observations in the data set.
Step 3:
a. If L is a whole number, then Pj is the mean or average of
the values in the Lth and (L+1)th positions.
b. If L is not a whole number, then Pj is the value of the next
higher position.
Steps in finding the jth percentile (Pj)
Example 2 Distribution of scores in a 50-item long test of
150 Grade 11 students of a nearby Senior High School
Step 1: Arrange the data values in ascending order of
magnitude.
To find P30 we note that j = 30
Distribution of scores in a 50-item long test of
150 Grade 11 students of a nearby Senior High SchoolExample 2
Step 2: Find the location of Pj in the arranged list by
computing L = (j/100) x N, where N is the total number of
observations in the data set.
Step 3:
a. If L is a whole number, then Pj is the mean or average of the values
in the Lth and (L+1)th positions.
b. If L is not a whole number, then Pj is the value of the next higher
position.
Distribution of scores in a 50-item long test of
150 Grade 11 students of a nearby Senior High School
Example 2
 45 is a whole number and thus we follow the first rule
 the average or mean of the values found in the 45th and 46th
positions, which are both 25
 the bottom 30% of the scores are said to be less than or
equal to 25
 while the top 70% of the observations (which is around 105)
are greater than 25
Example 2 Distribution of scores in a 50-item long test of
150 Grade 11 students of a nearby Senior High School
Deciles
divide the distribution into 10 equal parts
Quartiles
divide the distribution into 4 equal parts
Deciles and Quartiles
HOW DOWE USETHE
PERCENTILE IN
FINDINGTHE DECILES
AND QUARTILES OF A
DISTRIBUTION?
 Compute for the 3rd Decile or D3
 Compute for the 3rd Quartile or Q3
Using the steps in finding the Percentile:
 Compute for the 3rd Decile or D3
D3 = P30
 Compute for the 3rd Quartile or Q3
Q3 = P75
Using the steps in finding the Percentile:
MEAN, MEDIAN &
MODE (FOR
GROUPED DATA)
MEAN for Grouped Data:
Class
Interval
Class
Frequency (f)
Class Mark
(x)
fx
𝑥 =
𝑓1 𝑥1 + 𝑓2 𝑥2 + 𝑓3 𝑥3 + ⋯ 𝑓𝑛−1 𝑥 𝑛−1 + 𝑓𝑛 𝑥 𝑛
𝑁
=
𝛴𝑓𝑥
𝑁
EXAMPLE:
Class Interval Class Frequency (f)
10-20 5
21-31 10
32-42 11
43-53 7
54-64 23
65-75 56
76-86 6
87-97 8
98-108 4
Σf = N = ________
The result of the scores in Mathematics test during theTeacher’s Board Examination
Find the Mean Score
of all the
examinees.
Class
Interval
Class
Frequency
(f)
Class Mark
(x)
fx
10-20 5 15 75
21-31 10 26 260
32-42 11 37 407
43-53 7 48 336
54-64 23 59 1357
65-75 56 70 3920
76-86 6 81 486
87-97 8 92 736
98-108 4 103 412
Σf = N = 130 Σfx = 7989
The result of the scores in Mathematics test during theTeacher’s Board Examination
𝑥 =
𝛴𝑓𝑥
𝑁
=
7989
130
𝑥 = 61.45
MEDIAN for grouped Data:
Class Interval
Class Frequency
(f)
< Cumulative
Frequency (<CF)
𝑀 =
𝑁
2
Median Class is the class interval to which
M is included with respect to the less than
cumulative frequency.
𝑥 = 𝑥 𝐿𝐵 + 𝑖
𝑁
2
− < 𝑐𝑓𝑏
𝑓𝑚
EXAMPLE:
Class Interval
Class
Frequency (f)
< Cumulative
Frequency
(<CF)
10-20 5 5
21-31 10 15
32-42 11 26
43-53 7 33
54-64 23 56
65-75 55 111
76-86 7 118
87-97 8 126
98-108 4 130
Σf = N = 130
Find the Median class.
𝑀 =
𝑁
2
=
130
2
𝑀 = 65
Class Interval
Class
Frequency (f)
< Cumulative
Frequency
(<CF)
43-53 7 33
54-64 23 56
65-75 55 111
76-86 7 118
Find the Median for the grouped data
𝑥 = 𝑥 𝐿𝐵 + 𝑖
𝑁
2
− < 𝑐𝑓𝑏
𝑓𝑚
1. Lower class boundary of M
𝑥 𝐿𝐵 = 𝐿𝐿 − 0.5
𝑥 𝐿𝐵= 65 − 0.5 = 64.5
2. Class size (i)
𝑖 = 𝑈𝐿 − 𝐿𝐿 + 1
𝑖 = 75 − 65 + 1 = 11
Class
Interval
Class
Frequency (f)
< Cumulative
Frequency
(<CF)
43-53 7 33
54-64 23 56
65-75 55 111
76-86 7 118
Find the Median for the grouped data
𝑥 = 𝑥 𝐿𝐵 + 𝑖
𝑁
2
− < 𝑐𝑓𝑏
𝑓𝑚
= 64.5 + 11
130
2
− 56
55
𝑥 = 64.5 + 11
65 − 56
55
= 64.5 + 11
9
55
= 64.5 + 11 0.16363
𝑥 = 64.5 + 1.8 = 66.3
3. Less than cumulative frequency
before the median class
< 𝑐𝑓𝑏 = 56
4. Median class frequency
𝑓𝑚 = 55
MODE for grouped Data:
Class Interval Class Frequency (f)
Modal Class is the class interval with the
heights class frequency.
𝑥 = 𝑥 𝐿𝐵 + 𝑖
𝑓𝑚 − 𝑓𝑚𝑏
2𝑓𝑚 − 𝑓𝑚𝑎 − 𝑓𝑚𝑏
Find the Mode for the grouped data.
Class
Interval
Class
Frequency (f)
43-53 7
54-64 23
65-75 55
76-86 7
𝑥 𝐿𝐵 = 65 − 0.5 = 64.5
1. Lower class boundary of the modal class
2. Class size 𝑖 = 75 − 65 + 1 = 11
3. Class frequency of the modal class 𝑓𝑚 = 55
4. Class frequency of the class after the modal class
𝑓𝑚𝑎 = 7
5. Class frequency of the class before the modal class
𝑓𝑚𝑏 = 23
𝑥 = 𝑥 𝐿𝐵 + 𝑖
𝑓𝑚 − 𝑓𝑚𝑏
2𝑓𝑚 − 𝑓𝑚𝑎 − 𝑓𝑚𝑏
Modal class
Find the Mode for the grouped data.
𝑥 𝐿𝐵 = 64.5 𝑖 = 11 𝑓𝑚 = 55 𝑓𝑚𝑎 = 7 𝑓𝑚𝑏 = 23
𝑥 = 𝑥 𝐿𝐵 + 𝑖
𝑓𝑚 − 𝑓𝑚𝑏
2𝑓𝑚 − 𝑓𝑚𝑎 − 𝑓𝑚𝑏
= 64.5 + 11
55 − 23
2(55) − 7 − 23
𝑥 = 64.5 + 11
32
80
= 64.5 + 11 0.4
𝑥 = 64.5 + 4.4 = 68.9
Reference:
• TEACHING GUIDE FOR SENIOR HIGH SCHOOL - Statistics and Probability by CHED in
collaboration with the Philippine NormalUniversity

More Related Content

What's hot

Chapter 2 understanding the normal curve distribution
Chapter 2   understanding the normal curve distributionChapter 2   understanding the normal curve distribution
Chapter 2 understanding the normal curve distribution
Antonio F. Balatar Jr.
 
Measures of Variability of Grouped and Ungrouped Data
Measures of Variability of Grouped and Ungrouped DataMeasures of Variability of Grouped and Ungrouped Data
Measures of Variability of Grouped and Ungrouped Data
Junila Tejada
 
Chapter 1 random variables and probability distributions
Chapter 1   random variables and probability distributionsChapter 1   random variables and probability distributions
Chapter 1 random variables and probability distributions
Antonio F. Balatar Jr.
 
Measures of central tendency (ungrouped data)
Measures of central tendency (ungrouped data)Measures of central tendency (ungrouped data)
Measures of central tendency (ungrouped data)LilianneSoriano
 
QUARTILES : MEASURES OF POSITION FOR GROUPED DATA
QUARTILES : MEASURES OF POSITION FOR GROUPED DATAQUARTILES : MEASURES OF POSITION FOR GROUPED DATA
QUARTILES : MEASURES OF POSITION FOR GROUPED DATA
Chuckry Maunes
 
Summative Test on Measures of Position
Summative Test on Measures of PositionSummative Test on Measures of Position
Summative Test on Measures of Position
Joey Valdriz
 
Statistics and probability lesson5
Statistics and probability lesson5Statistics and probability lesson5
Statistics and probability lesson5
MARIA CHRISTITA POLINAG
 
STATISTICS AND PROBABILITY (TEACHING GUIDE)
STATISTICS AND PROBABILITY (TEACHING GUIDE)STATISTICS AND PROBABILITY (TEACHING GUIDE)
STATISTICS AND PROBABILITY (TEACHING GUIDE)
PRINTDESK by Dan
 
PERCENTILE : MEASURES OF POSITION FOR GROUPED DATA
PERCENTILE : MEASURES OF POSITION FOR GROUPED DATA PERCENTILE : MEASURES OF POSITION FOR GROUPED DATA
PERCENTILE : MEASURES OF POSITION FOR GROUPED DATA
Chuckry Maunes
 
Measures of Central Tendency: Ungrouped and Grouped
Measures of Central Tendency: Ungrouped and GroupedMeasures of Central Tendency: Ungrouped and Grouped
Measures of Central Tendency: Ungrouped and Grouped
MaryGraceRecaaAgusti
 
PERCENTILE RANK
PERCENTILE RANKPERCENTILE RANK
PERCENTILE RANK
Chuckry Maunes
 
Mean, variance, and standard deviation of a Discrete Random Variable
Mean, variance, and standard deviation of a Discrete Random VariableMean, variance, and standard deviation of a Discrete Random Variable
Mean, variance, and standard deviation of a Discrete Random Variable
Michael Ogoy
 
MEASURES OF POSITION FOR UNGROUPED DATA : QUARTILES , DECILES , & PERCENTILES
MEASURES OF POSITION FOR UNGROUPED DATA : QUARTILES , DECILES , & PERCENTILESMEASURES OF POSITION FOR UNGROUPED DATA : QUARTILES , DECILES , & PERCENTILES
MEASURES OF POSITION FOR UNGROUPED DATA : QUARTILES , DECILES , & PERCENTILES
Chuckry Maunes
 
random variable and distribution
random variable and distributionrandom variable and distribution
random variable and distribution
lovemucheca
 
MEASURES OF CENTRAL TENDENCY AND VARIABILITY
MEASURES OF CENTRAL TENDENCY AND VARIABILITYMEASURES OF CENTRAL TENDENCY AND VARIABILITY
MEASURES OF CENTRAL TENDENCY AND VARIABILITYMariele Brutas
 
Measures of Position for Ungroup Data
Measures of Position for Ungroup DataMeasures of Position for Ungroup Data
Measures of Position for Ungroup Data
patricia rolle
 
MEASURES OF POSITION
MEASURES OF POSITIONMEASURES OF POSITION
MEASURES OF POSITION
Hazel Charise Gonzales
 
PERCENTILES FOR GROUPED DATA AND PERCENTILE RANK.pptx
PERCENTILES FOR GROUPED DATA AND PERCENTILE RANK.pptxPERCENTILES FOR GROUPED DATA AND PERCENTILE RANK.pptx
PERCENTILES FOR GROUPED DATA AND PERCENTILE RANK.pptx
rich_26
 
Math 10 Curriculum Guide
Math 10 Curriculum GuideMath 10 Curriculum Guide
Math 10 Curriculum Guide
leybrigs
 
Random sampling
Random samplingRandom sampling
Random sampling
JesusDel2
 

What's hot (20)

Chapter 2 understanding the normal curve distribution
Chapter 2   understanding the normal curve distributionChapter 2   understanding the normal curve distribution
Chapter 2 understanding the normal curve distribution
 
Measures of Variability of Grouped and Ungrouped Data
Measures of Variability of Grouped and Ungrouped DataMeasures of Variability of Grouped and Ungrouped Data
Measures of Variability of Grouped and Ungrouped Data
 
Chapter 1 random variables and probability distributions
Chapter 1   random variables and probability distributionsChapter 1   random variables and probability distributions
Chapter 1 random variables and probability distributions
 
Measures of central tendency (ungrouped data)
Measures of central tendency (ungrouped data)Measures of central tendency (ungrouped data)
Measures of central tendency (ungrouped data)
 
QUARTILES : MEASURES OF POSITION FOR GROUPED DATA
QUARTILES : MEASURES OF POSITION FOR GROUPED DATAQUARTILES : MEASURES OF POSITION FOR GROUPED DATA
QUARTILES : MEASURES OF POSITION FOR GROUPED DATA
 
Summative Test on Measures of Position
Summative Test on Measures of PositionSummative Test on Measures of Position
Summative Test on Measures of Position
 
Statistics and probability lesson5
Statistics and probability lesson5Statistics and probability lesson5
Statistics and probability lesson5
 
STATISTICS AND PROBABILITY (TEACHING GUIDE)
STATISTICS AND PROBABILITY (TEACHING GUIDE)STATISTICS AND PROBABILITY (TEACHING GUIDE)
STATISTICS AND PROBABILITY (TEACHING GUIDE)
 
PERCENTILE : MEASURES OF POSITION FOR GROUPED DATA
PERCENTILE : MEASURES OF POSITION FOR GROUPED DATA PERCENTILE : MEASURES OF POSITION FOR GROUPED DATA
PERCENTILE : MEASURES OF POSITION FOR GROUPED DATA
 
Measures of Central Tendency: Ungrouped and Grouped
Measures of Central Tendency: Ungrouped and GroupedMeasures of Central Tendency: Ungrouped and Grouped
Measures of Central Tendency: Ungrouped and Grouped
 
PERCENTILE RANK
PERCENTILE RANKPERCENTILE RANK
PERCENTILE RANK
 
Mean, variance, and standard deviation of a Discrete Random Variable
Mean, variance, and standard deviation of a Discrete Random VariableMean, variance, and standard deviation of a Discrete Random Variable
Mean, variance, and standard deviation of a Discrete Random Variable
 
MEASURES OF POSITION FOR UNGROUPED DATA : QUARTILES , DECILES , & PERCENTILES
MEASURES OF POSITION FOR UNGROUPED DATA : QUARTILES , DECILES , & PERCENTILESMEASURES OF POSITION FOR UNGROUPED DATA : QUARTILES , DECILES , & PERCENTILES
MEASURES OF POSITION FOR UNGROUPED DATA : QUARTILES , DECILES , & PERCENTILES
 
random variable and distribution
random variable and distributionrandom variable and distribution
random variable and distribution
 
MEASURES OF CENTRAL TENDENCY AND VARIABILITY
MEASURES OF CENTRAL TENDENCY AND VARIABILITYMEASURES OF CENTRAL TENDENCY AND VARIABILITY
MEASURES OF CENTRAL TENDENCY AND VARIABILITY
 
Measures of Position for Ungroup Data
Measures of Position for Ungroup DataMeasures of Position for Ungroup Data
Measures of Position for Ungroup Data
 
MEASURES OF POSITION
MEASURES OF POSITIONMEASURES OF POSITION
MEASURES OF POSITION
 
PERCENTILES FOR GROUPED DATA AND PERCENTILE RANK.pptx
PERCENTILES FOR GROUPED DATA AND PERCENTILE RANK.pptxPERCENTILES FOR GROUPED DATA AND PERCENTILE RANK.pptx
PERCENTILES FOR GROUPED DATA AND PERCENTILE RANK.pptx
 
Math 10 Curriculum Guide
Math 10 Curriculum GuideMath 10 Curriculum Guide
Math 10 Curriculum Guide
 
Random sampling
Random samplingRandom sampling
Random sampling
 

Viewers also liked

Statistics & probability lesson 8&9
Statistics & probability lesson 8&9Statistics & probability lesson 8&9
Statistics & probability lesson 8&9
MARIA CHRISTITA POLINAG
 
Grade 10 unit 2 timetable
Grade 10 unit 2 timetableGrade 10 unit 2 timetable
Grade 10 unit 2 timetableISM
 
Statistics and probability 1
Statistics and probability 1Statistics and probability 1
Statistics and probability 1
Irfan Yaqoob
 
Research g11 unit 1
Research g11 unit 1Research g11 unit 1
Research g11 unit 1ISM
 
Top ten motivational quotations
Top ten motivational quotationsTop ten motivational quotations
Top ten motivational quotations
Irfan Yaqoob
 
Introduction to statistics
Introduction to statisticsIntroduction to statistics
Introduction to statisticsakbhanj
 
Statistics lesson 1
Statistics   lesson 1Statistics   lesson 1
Statistics lesson 1
Katrina Mae
 
Introduction To Statistics
Introduction To StatisticsIntroduction To Statistics
Introduction To Statisticsalbertlaporte
 

Viewers also liked (8)

Statistics & probability lesson 8&9
Statistics & probability lesson 8&9Statistics & probability lesson 8&9
Statistics & probability lesson 8&9
 
Grade 10 unit 2 timetable
Grade 10 unit 2 timetableGrade 10 unit 2 timetable
Grade 10 unit 2 timetable
 
Statistics and probability 1
Statistics and probability 1Statistics and probability 1
Statistics and probability 1
 
Research g11 unit 1
Research g11 unit 1Research g11 unit 1
Research g11 unit 1
 
Top ten motivational quotations
Top ten motivational quotationsTop ten motivational quotations
Top ten motivational quotations
 
Introduction to statistics
Introduction to statisticsIntroduction to statistics
Introduction to statistics
 
Statistics lesson 1
Statistics   lesson 1Statistics   lesson 1
Statistics lesson 1
 
Introduction To Statistics
Introduction To StatisticsIntroduction To Statistics
Introduction To Statistics
 

Similar to Statistics and probability lesson6&7

STATISTICS AND PROBABILITY.pptx
STATISTICS AND PROBABILITY.pptxSTATISTICS AND PROBABILITY.pptx
STATISTICS AND PROBABILITY.pptx
Bharathiar University
 
QT1 - 03 - Measures of Central Tendency
QT1 - 03 - Measures of Central TendencyQT1 - 03 - Measures of Central Tendency
QT1 - 03 - Measures of Central Tendency
Prithwis Mukerjee
 
QT1 - 03 - Measures of Central Tendency
QT1 - 03 - Measures of Central TendencyQT1 - 03 - Measures of Central Tendency
QT1 - 03 - Measures of Central Tendency
Prithwis Mukerjee
 
Other Measures of Location
Other Measures of LocationOther Measures of Location
Other Measures of Location
Samuel John Parreño
 
polar pojhjgfnbhggnbh hnhghgnhbhnhbjnhhhhhh
polar pojhjgfnbhggnbh hnhghgnhbhnhbjnhhhhhhpolar pojhjgfnbhggnbh hnhghgnhbhnhbjnhhhhhh
polar pojhjgfnbhggnbh hnhghgnhbhnhbjnhhhhhh
NathanAndreiBoongali
 
Statistics(Basic)
Statistics(Basic)Statistics(Basic)
Statistics(Basic)
chanu Bhattacharya
 
Analysis of students’ performance
Analysis of students’ performanceAnalysis of students’ performance
Analysis of students’ performance
Gautam Kumar
 
Tabulation of Data, Frequency Distribution, Contingency table
Tabulation of Data, Frequency Distribution, Contingency tableTabulation of Data, Frequency Distribution, Contingency table
Tabulation of Data, Frequency Distribution, Contingency table
Jagdish Powar
 
Frequency distribution, central tendency, measures of dispersion
Frequency distribution, central tendency, measures of dispersionFrequency distribution, central tendency, measures of dispersion
Frequency distribution, central tendency, measures of dispersion
Dhwani Shah
 
I. central tendency
I. central tendencyI. central tendency
I. central tendency
MaryFlorCaalim
 
Lesson 7 other measures of location
Lesson 7  other measures of locationLesson 7  other measures of location
Lesson 7 other measures of location
Maris Ganace
 
Group 3 measures of central tendency and variation - (mean, median, mode, ra...
Group 3  measures of central tendency and variation - (mean, median, mode, ra...Group 3  measures of central tendency and variation - (mean, median, mode, ra...
Group 3 measures of central tendency and variation - (mean, median, mode, ra...
reymartyvette_0611
 
Topic 8a Basic Statistics
Topic 8a Basic StatisticsTopic 8a Basic Statistics
Topic 8a Basic StatisticsYee Bee Choo
 
Statistics " Measurements of central location chapter 2"
Statistics " Measurements of central location chapter 2"Statistics " Measurements of central location chapter 2"
Statistics " Measurements of central location chapter 2"
GanizaniBarnet
 
Introduction-to-Analyzing-Statistical-Data.pdf
Introduction-to-Analyzing-Statistical-Data.pdfIntroduction-to-Analyzing-Statistical-Data.pdf
Introduction-to-Analyzing-Statistical-Data.pdf
chrisv1443
 
Measures of central tendency
Measures of central tendencyMeasures of central tendency
Measures of central tendency
Jincy Raj
 
Mean, Median, Mode: Measures of Central Tendency
Mean, Median, Mode: Measures of Central Tendency Mean, Median, Mode: Measures of Central Tendency
Mean, Median, Mode: Measures of Central Tendency Jan Nah
 
Measures of Central Tendency
Measures of Central TendencyMeasures of Central Tendency
Measures of Central Tendency
Samuel John Parreño
 

Similar to Statistics and probability lesson6&7 (20)

STATISTICS AND PROBABILITY.pptx
STATISTICS AND PROBABILITY.pptxSTATISTICS AND PROBABILITY.pptx
STATISTICS AND PROBABILITY.pptx
 
QT1 - 03 - Measures of Central Tendency
QT1 - 03 - Measures of Central TendencyQT1 - 03 - Measures of Central Tendency
QT1 - 03 - Measures of Central Tendency
 
QT1 - 03 - Measures of Central Tendency
QT1 - 03 - Measures of Central TendencyQT1 - 03 - Measures of Central Tendency
QT1 - 03 - Measures of Central Tendency
 
Other Measures of Location
Other Measures of LocationOther Measures of Location
Other Measures of Location
 
polar pojhjgfnbhggnbh hnhghgnhbhnhbjnhhhhhh
polar pojhjgfnbhggnbh hnhghgnhbhnhbjnhhhhhhpolar pojhjgfnbhggnbh hnhghgnhbhnhbjnhhhhhh
polar pojhjgfnbhggnbh hnhghgnhbhnhbjnhhhhhh
 
Statistics(Basic)
Statistics(Basic)Statistics(Basic)
Statistics(Basic)
 
Analysis of students’ performance
Analysis of students’ performanceAnalysis of students’ performance
Analysis of students’ performance
 
Tabulation of Data, Frequency Distribution, Contingency table
Tabulation of Data, Frequency Distribution, Contingency tableTabulation of Data, Frequency Distribution, Contingency table
Tabulation of Data, Frequency Distribution, Contingency table
 
Frequency distribution, central tendency, measures of dispersion
Frequency distribution, central tendency, measures of dispersionFrequency distribution, central tendency, measures of dispersion
Frequency distribution, central tendency, measures of dispersion
 
I. central tendency
I. central tendencyI. central tendency
I. central tendency
 
Lesson 7 other measures of location
Lesson 7  other measures of locationLesson 7  other measures of location
Lesson 7 other measures of location
 
Group 3 measures of central tendency and variation - (mean, median, mode, ra...
Group 3  measures of central tendency and variation - (mean, median, mode, ra...Group 3  measures of central tendency and variation - (mean, median, mode, ra...
Group 3 measures of central tendency and variation - (mean, median, mode, ra...
 
just to download
just to downloadjust to download
just to download
 
Topic 8a Basic Statistics
Topic 8a Basic StatisticsTopic 8a Basic Statistics
Topic 8a Basic Statistics
 
Statistics " Measurements of central location chapter 2"
Statistics " Measurements of central location chapter 2"Statistics " Measurements of central location chapter 2"
Statistics " Measurements of central location chapter 2"
 
Introduction-to-Analyzing-Statistical-Data.pdf
Introduction-to-Analyzing-Statistical-Data.pdfIntroduction-to-Analyzing-Statistical-Data.pdf
Introduction-to-Analyzing-Statistical-Data.pdf
 
Measures of central tendency
Measures of central tendencyMeasures of central tendency
Measures of central tendency
 
Mean, Median, Mode: Measures of Central Tendency
Mean, Median, Mode: Measures of Central Tendency Mean, Median, Mode: Measures of Central Tendency
Mean, Median, Mode: Measures of Central Tendency
 
Central tendency m,m,m 1.2
Central tendency m,m,m 1.2Central tendency m,m,m 1.2
Central tendency m,m,m 1.2
 
Measures of Central Tendency
Measures of Central TendencyMeasures of Central Tendency
Measures of Central Tendency
 

Recently uploaded

Polish students' mobility in the Czech Republic
Polish students' mobility in the Czech RepublicPolish students' mobility in the Czech Republic
Polish students' mobility in the Czech Republic
Anna Sz.
 
CACJapan - GROUP Presentation 1- Wk 4.pdf
CACJapan - GROUP Presentation 1- Wk 4.pdfCACJapan - GROUP Presentation 1- Wk 4.pdf
CACJapan - GROUP Presentation 1- Wk 4.pdf
camakaiclarkmusic
 
678020731-Sumas-y-Restas-Para-Colorear.pdf
678020731-Sumas-y-Restas-Para-Colorear.pdf678020731-Sumas-y-Restas-Para-Colorear.pdf
678020731-Sumas-y-Restas-Para-Colorear.pdf
CarlosHernanMontoyab2
 
Sha'Carri Richardson Presentation 202345
Sha'Carri Richardson Presentation 202345Sha'Carri Richardson Presentation 202345
Sha'Carri Richardson Presentation 202345
beazzy04
 
Operation Blue Star - Saka Neela Tara
Operation Blue Star   -  Saka Neela TaraOperation Blue Star   -  Saka Neela Tara
Operation Blue Star - Saka Neela Tara
Balvir Singh
 
Embracing GenAI - A Strategic Imperative
Embracing GenAI - A Strategic ImperativeEmbracing GenAI - A Strategic Imperative
Embracing GenAI - A Strategic Imperative
Peter Windle
 
Lapbook sobre os Regimes Totalitários.pdf
Lapbook sobre os Regimes Totalitários.pdfLapbook sobre os Regimes Totalitários.pdf
Lapbook sobre os Regimes Totalitários.pdf
Jean Carlos Nunes Paixão
 
Additional Benefits for Employee Website.pdf
Additional Benefits for Employee Website.pdfAdditional Benefits for Employee Website.pdf
Additional Benefits for Employee Website.pdf
joachimlavalley1
 
June 3, 2024 Anti-Semitism Letter Sent to MIT President Kornbluth and MIT Cor...
June 3, 2024 Anti-Semitism Letter Sent to MIT President Kornbluth and MIT Cor...June 3, 2024 Anti-Semitism Letter Sent to MIT President Kornbluth and MIT Cor...
June 3, 2024 Anti-Semitism Letter Sent to MIT President Kornbluth and MIT Cor...
Levi Shapiro
 
"Protectable subject matters, Protection in biotechnology, Protection of othe...
"Protectable subject matters, Protection in biotechnology, Protection of othe..."Protectable subject matters, Protection in biotechnology, Protection of othe...
"Protectable subject matters, Protection in biotechnology, Protection of othe...
SACHIN R KONDAGURI
 
TESDA TM1 REVIEWER FOR NATIONAL ASSESSMENT WRITTEN AND ORAL QUESTIONS WITH A...
TESDA TM1 REVIEWER  FOR NATIONAL ASSESSMENT WRITTEN AND ORAL QUESTIONS WITH A...TESDA TM1 REVIEWER  FOR NATIONAL ASSESSMENT WRITTEN AND ORAL QUESTIONS WITH A...
TESDA TM1 REVIEWER FOR NATIONAL ASSESSMENT WRITTEN AND ORAL QUESTIONS WITH A...
EugeneSaldivar
 
Palestine last event orientationfvgnh .pptx
Palestine last event orientationfvgnh .pptxPalestine last event orientationfvgnh .pptx
Palestine last event orientationfvgnh .pptx
RaedMohamed3
 
Francesca Gottschalk - How can education support child empowerment.pptx
Francesca Gottschalk - How can education support child empowerment.pptxFrancesca Gottschalk - How can education support child empowerment.pptx
Francesca Gottschalk - How can education support child empowerment.pptx
EduSkills OECD
 
Guidance_and_Counselling.pdf B.Ed. 4th Semester
Guidance_and_Counselling.pdf B.Ed. 4th SemesterGuidance_and_Counselling.pdf B.Ed. 4th Semester
Guidance_and_Counselling.pdf B.Ed. 4th Semester
Atul Kumar Singh
 
Unit 2- Research Aptitude (UGC NET Paper I).pdf
Unit 2- Research Aptitude (UGC NET Paper I).pdfUnit 2- Research Aptitude (UGC NET Paper I).pdf
Unit 2- Research Aptitude (UGC NET Paper I).pdf
Thiyagu K
 
The approach at University of Liverpool.pptx
The approach at University of Liverpool.pptxThe approach at University of Liverpool.pptx
The approach at University of Liverpool.pptx
Jisc
 
Language Across the Curriculm LAC B.Ed.
Language Across the  Curriculm LAC B.Ed.Language Across the  Curriculm LAC B.Ed.
Language Across the Curriculm LAC B.Ed.
Atul Kumar Singh
 
Thesis Statement for students diagnonsed withADHD.ppt
Thesis Statement for students diagnonsed withADHD.pptThesis Statement for students diagnonsed withADHD.ppt
Thesis Statement for students diagnonsed withADHD.ppt
EverAndrsGuerraGuerr
 
Introduction to AI for Nonprofits with Tapp Network
Introduction to AI for Nonprofits with Tapp NetworkIntroduction to AI for Nonprofits with Tapp Network
Introduction to AI for Nonprofits with Tapp Network
TechSoup
 
Chapter 3 - Islamic Banking Products and Services.pptx
Chapter 3 - Islamic Banking Products and Services.pptxChapter 3 - Islamic Banking Products and Services.pptx
Chapter 3 - Islamic Banking Products and Services.pptx
Mohd Adib Abd Muin, Senior Lecturer at Universiti Utara Malaysia
 

Recently uploaded (20)

Polish students' mobility in the Czech Republic
Polish students' mobility in the Czech RepublicPolish students' mobility in the Czech Republic
Polish students' mobility in the Czech Republic
 
CACJapan - GROUP Presentation 1- Wk 4.pdf
CACJapan - GROUP Presentation 1- Wk 4.pdfCACJapan - GROUP Presentation 1- Wk 4.pdf
CACJapan - GROUP Presentation 1- Wk 4.pdf
 
678020731-Sumas-y-Restas-Para-Colorear.pdf
678020731-Sumas-y-Restas-Para-Colorear.pdf678020731-Sumas-y-Restas-Para-Colorear.pdf
678020731-Sumas-y-Restas-Para-Colorear.pdf
 
Sha'Carri Richardson Presentation 202345
Sha'Carri Richardson Presentation 202345Sha'Carri Richardson Presentation 202345
Sha'Carri Richardson Presentation 202345
 
Operation Blue Star - Saka Neela Tara
Operation Blue Star   -  Saka Neela TaraOperation Blue Star   -  Saka Neela Tara
Operation Blue Star - Saka Neela Tara
 
Embracing GenAI - A Strategic Imperative
Embracing GenAI - A Strategic ImperativeEmbracing GenAI - A Strategic Imperative
Embracing GenAI - A Strategic Imperative
 
Lapbook sobre os Regimes Totalitários.pdf
Lapbook sobre os Regimes Totalitários.pdfLapbook sobre os Regimes Totalitários.pdf
Lapbook sobre os Regimes Totalitários.pdf
 
Additional Benefits for Employee Website.pdf
Additional Benefits for Employee Website.pdfAdditional Benefits for Employee Website.pdf
Additional Benefits for Employee Website.pdf
 
June 3, 2024 Anti-Semitism Letter Sent to MIT President Kornbluth and MIT Cor...
June 3, 2024 Anti-Semitism Letter Sent to MIT President Kornbluth and MIT Cor...June 3, 2024 Anti-Semitism Letter Sent to MIT President Kornbluth and MIT Cor...
June 3, 2024 Anti-Semitism Letter Sent to MIT President Kornbluth and MIT Cor...
 
"Protectable subject matters, Protection in biotechnology, Protection of othe...
"Protectable subject matters, Protection in biotechnology, Protection of othe..."Protectable subject matters, Protection in biotechnology, Protection of othe...
"Protectable subject matters, Protection in biotechnology, Protection of othe...
 
TESDA TM1 REVIEWER FOR NATIONAL ASSESSMENT WRITTEN AND ORAL QUESTIONS WITH A...
TESDA TM1 REVIEWER  FOR NATIONAL ASSESSMENT WRITTEN AND ORAL QUESTIONS WITH A...TESDA TM1 REVIEWER  FOR NATIONAL ASSESSMENT WRITTEN AND ORAL QUESTIONS WITH A...
TESDA TM1 REVIEWER FOR NATIONAL ASSESSMENT WRITTEN AND ORAL QUESTIONS WITH A...
 
Palestine last event orientationfvgnh .pptx
Palestine last event orientationfvgnh .pptxPalestine last event orientationfvgnh .pptx
Palestine last event orientationfvgnh .pptx
 
Francesca Gottschalk - How can education support child empowerment.pptx
Francesca Gottschalk - How can education support child empowerment.pptxFrancesca Gottschalk - How can education support child empowerment.pptx
Francesca Gottschalk - How can education support child empowerment.pptx
 
Guidance_and_Counselling.pdf B.Ed. 4th Semester
Guidance_and_Counselling.pdf B.Ed. 4th SemesterGuidance_and_Counselling.pdf B.Ed. 4th Semester
Guidance_and_Counselling.pdf B.Ed. 4th Semester
 
Unit 2- Research Aptitude (UGC NET Paper I).pdf
Unit 2- Research Aptitude (UGC NET Paper I).pdfUnit 2- Research Aptitude (UGC NET Paper I).pdf
Unit 2- Research Aptitude (UGC NET Paper I).pdf
 
The approach at University of Liverpool.pptx
The approach at University of Liverpool.pptxThe approach at University of Liverpool.pptx
The approach at University of Liverpool.pptx
 
Language Across the Curriculm LAC B.Ed.
Language Across the  Curriculm LAC B.Ed.Language Across the  Curriculm LAC B.Ed.
Language Across the Curriculm LAC B.Ed.
 
Thesis Statement for students diagnonsed withADHD.ppt
Thesis Statement for students diagnonsed withADHD.pptThesis Statement for students diagnonsed withADHD.ppt
Thesis Statement for students diagnonsed withADHD.ppt
 
Introduction to AI for Nonprofits with Tapp Network
Introduction to AI for Nonprofits with Tapp NetworkIntroduction to AI for Nonprofits with Tapp Network
Introduction to AI for Nonprofits with Tapp Network
 
Chapter 3 - Islamic Banking Products and Services.pptx
Chapter 3 - Islamic Banking Products and Services.pptxChapter 3 - Islamic Banking Products and Services.pptx
Chapter 3 - Islamic Banking Products and Services.pptx
 

Statistics and probability lesson6&7

  • 1. STATISTICS AND PROBABILITY Lesson 6 and Lesson 7 Ms. Maria Christita Polinag Miriam College Adult Education
  • 3. Frequency distribution table of the monthly income of 35 families residing in a nearby barangay/village
  • 4. 1. What is the highest monthly family income? Lowest? 2.What monthly family income is most frequent in the village? 3. If you list down individually the values of the monthly family income from lowest to highest, what is the monthly family income where half of the total number of families have monthly family income less than or equal to that value while the other half have monthly family income greater than that value? 4.What is the average monthly family income?
  • 5. 1. What is the highest monthly family income? Lowest? Maximum and Minimum - summary measures of a data set - these measures do not give a measure of location in the center of the distribution Answer: Highest monthly family income is 60,000 pesos while the lowest is 12,000 pesos.
  • 6. 2. What monthly family income is most frequent in the village? ModalValue or Mode -the value with the highest frequency -is the most fashionable value in the data set Answer: Monthly family income that is most frequent is 32,250 pesos.
  • 7. 3. If you list down individually the values of the monthly family income from lowest to highest, what is the monthly family income where half of the total number of families have monthly family income less than or equal to that value while the other half have monthly family income greater than that value?
  • 8. Median 32, 250 When arranged in increasing order or the data come in an array as in the following: 12,000; 12,000; 20,000; 20,000; 20,000; 24,000; 24,000; 24,000; 24,000; 25,000; 25,000;25,000; 25,000; 25,000; 25,000; 25,000; 25,000; 32,250; 32,250; 32,250; 32,250; 32,250; 32,250; 32,250; 32,250; 32,250; 36,000; 36,000; 36,000; 36,000; 36,000; 40,000; 40,000; 60,000; 60,000;
  • 9. Median - is found in the center of the distribution. If N is odd the Median is the observation in the array If N is even the Median is the average of the two middle values or it is average of the and observation s
  • 10. 4. What is the average monthly family income? Arithmetic Mean or Mean -is computed by adding all the values and then the sum is divided by the number of values included in the sum - is also found somewhere in the center of the distribution Answer: When computed using the data values, the average is 30,007.14 pesos.
  • 11. Summation: ‘sum of observations represented by xi where i takes the values from1 to N, and N refers to the total number of observations being added’ Arithmetic Mean or Mean
  • 12. Using the example with 35 observations of family income, the mean is computed as: Mean : μ = 30, 007.14
  • 13.
  • 14. PROPERTIES OFTHE MEAN, MEDIAN AND MODE  basis for determining what measure to use to represent the center of the distribution Arithmetic Mean or Mean  computed only for quantitative variables that are measured at least in the interval scale  linked to a “center of gravity”
  • 15.  each observation has a contribution to the value of the mean
  • 16.  are also amenable to further computation; you can combine subgroup means to come up with the mean for all observations Arithmetic Mean or Mean Example: If there are 3 groups with means equal to 10, 5 and 7 computed from 5, 15, and 10 observations respectively.
  • 17. Arithmetic Mean or Mean  outliers do affect the value of the mean -If there are extreme large values, the mean will tend to be ‘pulled upward’ -if there are extreme small values, the mean will tend to be ‘pulled downward’  In the presence of extreme values or outliers, the mean is not a good measure of the center
  • 18. Median  computed for quantitative variables  but can be computed for variables measured in at least in the ordinal scale, in determining the center of the distribution  it is not easily affected by extreme values or outliers
  • 19. ModalValue or Mode  computed for the data set which are mainly measured in the nominal scale of measurement; sometimes referred to as the nominal average  can easily be picked out by ocular inspection, especially if the data are not too many  more helpful measure for discrete and qualitative data with numeric codes than for other types of data
  • 20. ModalValue or Mode o unimodal if there is a unique mode o bimodal if there are two modes o multimodal if there are more than two modes
  • 21. A measure of central tendency is a location measure that pinpoints the center or middle value.
  • 23. Distribution of scores in a 50-item long test of 150 Grade 11 students of a nearby Senior High School
  • 24. 1. What is the highest score? Lowest score? 2.What is the most frequent score? 3.What is the median score? 4.What is the average or mean score?
  • 25. 1.What is the highest score? Lowest score? Answer: Highest score is 50 while the lowest is 10. 2.What is the most frequent score? Answer: Most frequent score is 38 which is the score of 28 students. 3.What is the median score? Answer: The median score is 33 which implies that 50% of the students or around 75 students have score at most 33. 4.What is the average or mean score? Answer: On the average, the students got 32.04667 or 32 (rounded off) out of 50 items correctly.
  • 26. 1. What is the score where at most 75% of the 150 students scored less or equal to it? 2. Do you think the long test is easy since 75 students have scores at most 33 out of 50? 3. Do you need to be alarmed when 10% of the class got a score of at most 20 out of 50? Questions could be answered by knowing other measures of location:
  • 27. Measures of Location: Maximum, Minimum, Percentiles, Deciles and Quatiles Percentile is a measure that pinpoints a location that divides distribution into 100 equal parts. It is usually represented by Pj, that value which separates the bottom j% of the distribution from the top (100-j)%.
  • 28.  It is usually represented by Pj, that value which separates the bottom j% of the distribution from the top (100-j)%. - P30 is the value that separates the bottom 30% of the distribution to the top 70% - we say 30% of the total number of observations in the data set are said to be less than or equal to P30 while the remaining 70% have values greater than P30.
  • 29. Step 1: Arrange the data values in ascending order of magnitude. Step 2: Find the location of Pj in the arranged list by computing L = (j/100) x N, where N is the total number of observations in the data set. Step 3: a. If L is a whole number, then Pj is the mean or average of the values in the Lth and (L+1)th positions. b. If L is not a whole number, then Pj is the value of the next higher position. Steps in finding the jth percentile (Pj)
  • 30. Example 2 Distribution of scores in a 50-item long test of 150 Grade 11 students of a nearby Senior High School
  • 31. Step 1: Arrange the data values in ascending order of magnitude. To find P30 we note that j = 30 Distribution of scores in a 50-item long test of 150 Grade 11 students of a nearby Senior High SchoolExample 2 Step 2: Find the location of Pj in the arranged list by computing L = (j/100) x N, where N is the total number of observations in the data set.
  • 32. Step 3: a. If L is a whole number, then Pj is the mean or average of the values in the Lth and (L+1)th positions. b. If L is not a whole number, then Pj is the value of the next higher position. Distribution of scores in a 50-item long test of 150 Grade 11 students of a nearby Senior High School Example 2  45 is a whole number and thus we follow the first rule  the average or mean of the values found in the 45th and 46th positions, which are both 25  the bottom 30% of the scores are said to be less than or equal to 25  while the top 70% of the observations (which is around 105) are greater than 25
  • 33. Example 2 Distribution of scores in a 50-item long test of 150 Grade 11 students of a nearby Senior High School
  • 34. Deciles divide the distribution into 10 equal parts Quartiles divide the distribution into 4 equal parts Deciles and Quartiles
  • 35. HOW DOWE USETHE PERCENTILE IN FINDINGTHE DECILES AND QUARTILES OF A DISTRIBUTION?
  • 36.  Compute for the 3rd Decile or D3  Compute for the 3rd Quartile or Q3 Using the steps in finding the Percentile:
  • 37.  Compute for the 3rd Decile or D3 D3 = P30  Compute for the 3rd Quartile or Q3 Q3 = P75 Using the steps in finding the Percentile:
  • 38. MEAN, MEDIAN & MODE (FOR GROUPED DATA)
  • 39. MEAN for Grouped Data: Class Interval Class Frequency (f) Class Mark (x) fx 𝑥 = 𝑓1 𝑥1 + 𝑓2 𝑥2 + 𝑓3 𝑥3 + ⋯ 𝑓𝑛−1 𝑥 𝑛−1 + 𝑓𝑛 𝑥 𝑛 𝑁 = 𝛴𝑓𝑥 𝑁
  • 40. EXAMPLE: Class Interval Class Frequency (f) 10-20 5 21-31 10 32-42 11 43-53 7 54-64 23 65-75 56 76-86 6 87-97 8 98-108 4 Σf = N = ________ The result of the scores in Mathematics test during theTeacher’s Board Examination
  • 41. Find the Mean Score of all the examinees. Class Interval Class Frequency (f) Class Mark (x) fx 10-20 5 15 75 21-31 10 26 260 32-42 11 37 407 43-53 7 48 336 54-64 23 59 1357 65-75 56 70 3920 76-86 6 81 486 87-97 8 92 736 98-108 4 103 412 Σf = N = 130 Σfx = 7989 The result of the scores in Mathematics test during theTeacher’s Board Examination 𝑥 = 𝛴𝑓𝑥 𝑁 = 7989 130 𝑥 = 61.45
  • 42. MEDIAN for grouped Data: Class Interval Class Frequency (f) < Cumulative Frequency (<CF) 𝑀 = 𝑁 2 Median Class is the class interval to which M is included with respect to the less than cumulative frequency. 𝑥 = 𝑥 𝐿𝐵 + 𝑖 𝑁 2 − < 𝑐𝑓𝑏 𝑓𝑚
  • 43. EXAMPLE: Class Interval Class Frequency (f) < Cumulative Frequency (<CF) 10-20 5 5 21-31 10 15 32-42 11 26 43-53 7 33 54-64 23 56 65-75 55 111 76-86 7 118 87-97 8 126 98-108 4 130 Σf = N = 130 Find the Median class. 𝑀 = 𝑁 2 = 130 2 𝑀 = 65
  • 44. Class Interval Class Frequency (f) < Cumulative Frequency (<CF) 43-53 7 33 54-64 23 56 65-75 55 111 76-86 7 118 Find the Median for the grouped data 𝑥 = 𝑥 𝐿𝐵 + 𝑖 𝑁 2 − < 𝑐𝑓𝑏 𝑓𝑚 1. Lower class boundary of M 𝑥 𝐿𝐵 = 𝐿𝐿 − 0.5 𝑥 𝐿𝐵= 65 − 0.5 = 64.5 2. Class size (i) 𝑖 = 𝑈𝐿 − 𝐿𝐿 + 1 𝑖 = 75 − 65 + 1 = 11
  • 45. Class Interval Class Frequency (f) < Cumulative Frequency (<CF) 43-53 7 33 54-64 23 56 65-75 55 111 76-86 7 118 Find the Median for the grouped data 𝑥 = 𝑥 𝐿𝐵 + 𝑖 𝑁 2 − < 𝑐𝑓𝑏 𝑓𝑚 = 64.5 + 11 130 2 − 56 55 𝑥 = 64.5 + 11 65 − 56 55 = 64.5 + 11 9 55 = 64.5 + 11 0.16363 𝑥 = 64.5 + 1.8 = 66.3 3. Less than cumulative frequency before the median class < 𝑐𝑓𝑏 = 56 4. Median class frequency 𝑓𝑚 = 55
  • 46. MODE for grouped Data: Class Interval Class Frequency (f) Modal Class is the class interval with the heights class frequency. 𝑥 = 𝑥 𝐿𝐵 + 𝑖 𝑓𝑚 − 𝑓𝑚𝑏 2𝑓𝑚 − 𝑓𝑚𝑎 − 𝑓𝑚𝑏
  • 47. Find the Mode for the grouped data. Class Interval Class Frequency (f) 43-53 7 54-64 23 65-75 55 76-86 7 𝑥 𝐿𝐵 = 65 − 0.5 = 64.5 1. Lower class boundary of the modal class 2. Class size 𝑖 = 75 − 65 + 1 = 11 3. Class frequency of the modal class 𝑓𝑚 = 55 4. Class frequency of the class after the modal class 𝑓𝑚𝑎 = 7 5. Class frequency of the class before the modal class 𝑓𝑚𝑏 = 23 𝑥 = 𝑥 𝐿𝐵 + 𝑖 𝑓𝑚 − 𝑓𝑚𝑏 2𝑓𝑚 − 𝑓𝑚𝑎 − 𝑓𝑚𝑏 Modal class
  • 48. Find the Mode for the grouped data. 𝑥 𝐿𝐵 = 64.5 𝑖 = 11 𝑓𝑚 = 55 𝑓𝑚𝑎 = 7 𝑓𝑚𝑏 = 23 𝑥 = 𝑥 𝐿𝐵 + 𝑖 𝑓𝑚 − 𝑓𝑚𝑏 2𝑓𝑚 − 𝑓𝑚𝑎 − 𝑓𝑚𝑏 = 64.5 + 11 55 − 23 2(55) − 7 − 23 𝑥 = 64.5 + 11 32 80 = 64.5 + 11 0.4 𝑥 = 64.5 + 4.4 = 68.9
  • 49. Reference: • TEACHING GUIDE FOR SENIOR HIGH SCHOOL - Statistics and Probability by CHED in collaboration with the Philippine NormalUniversity