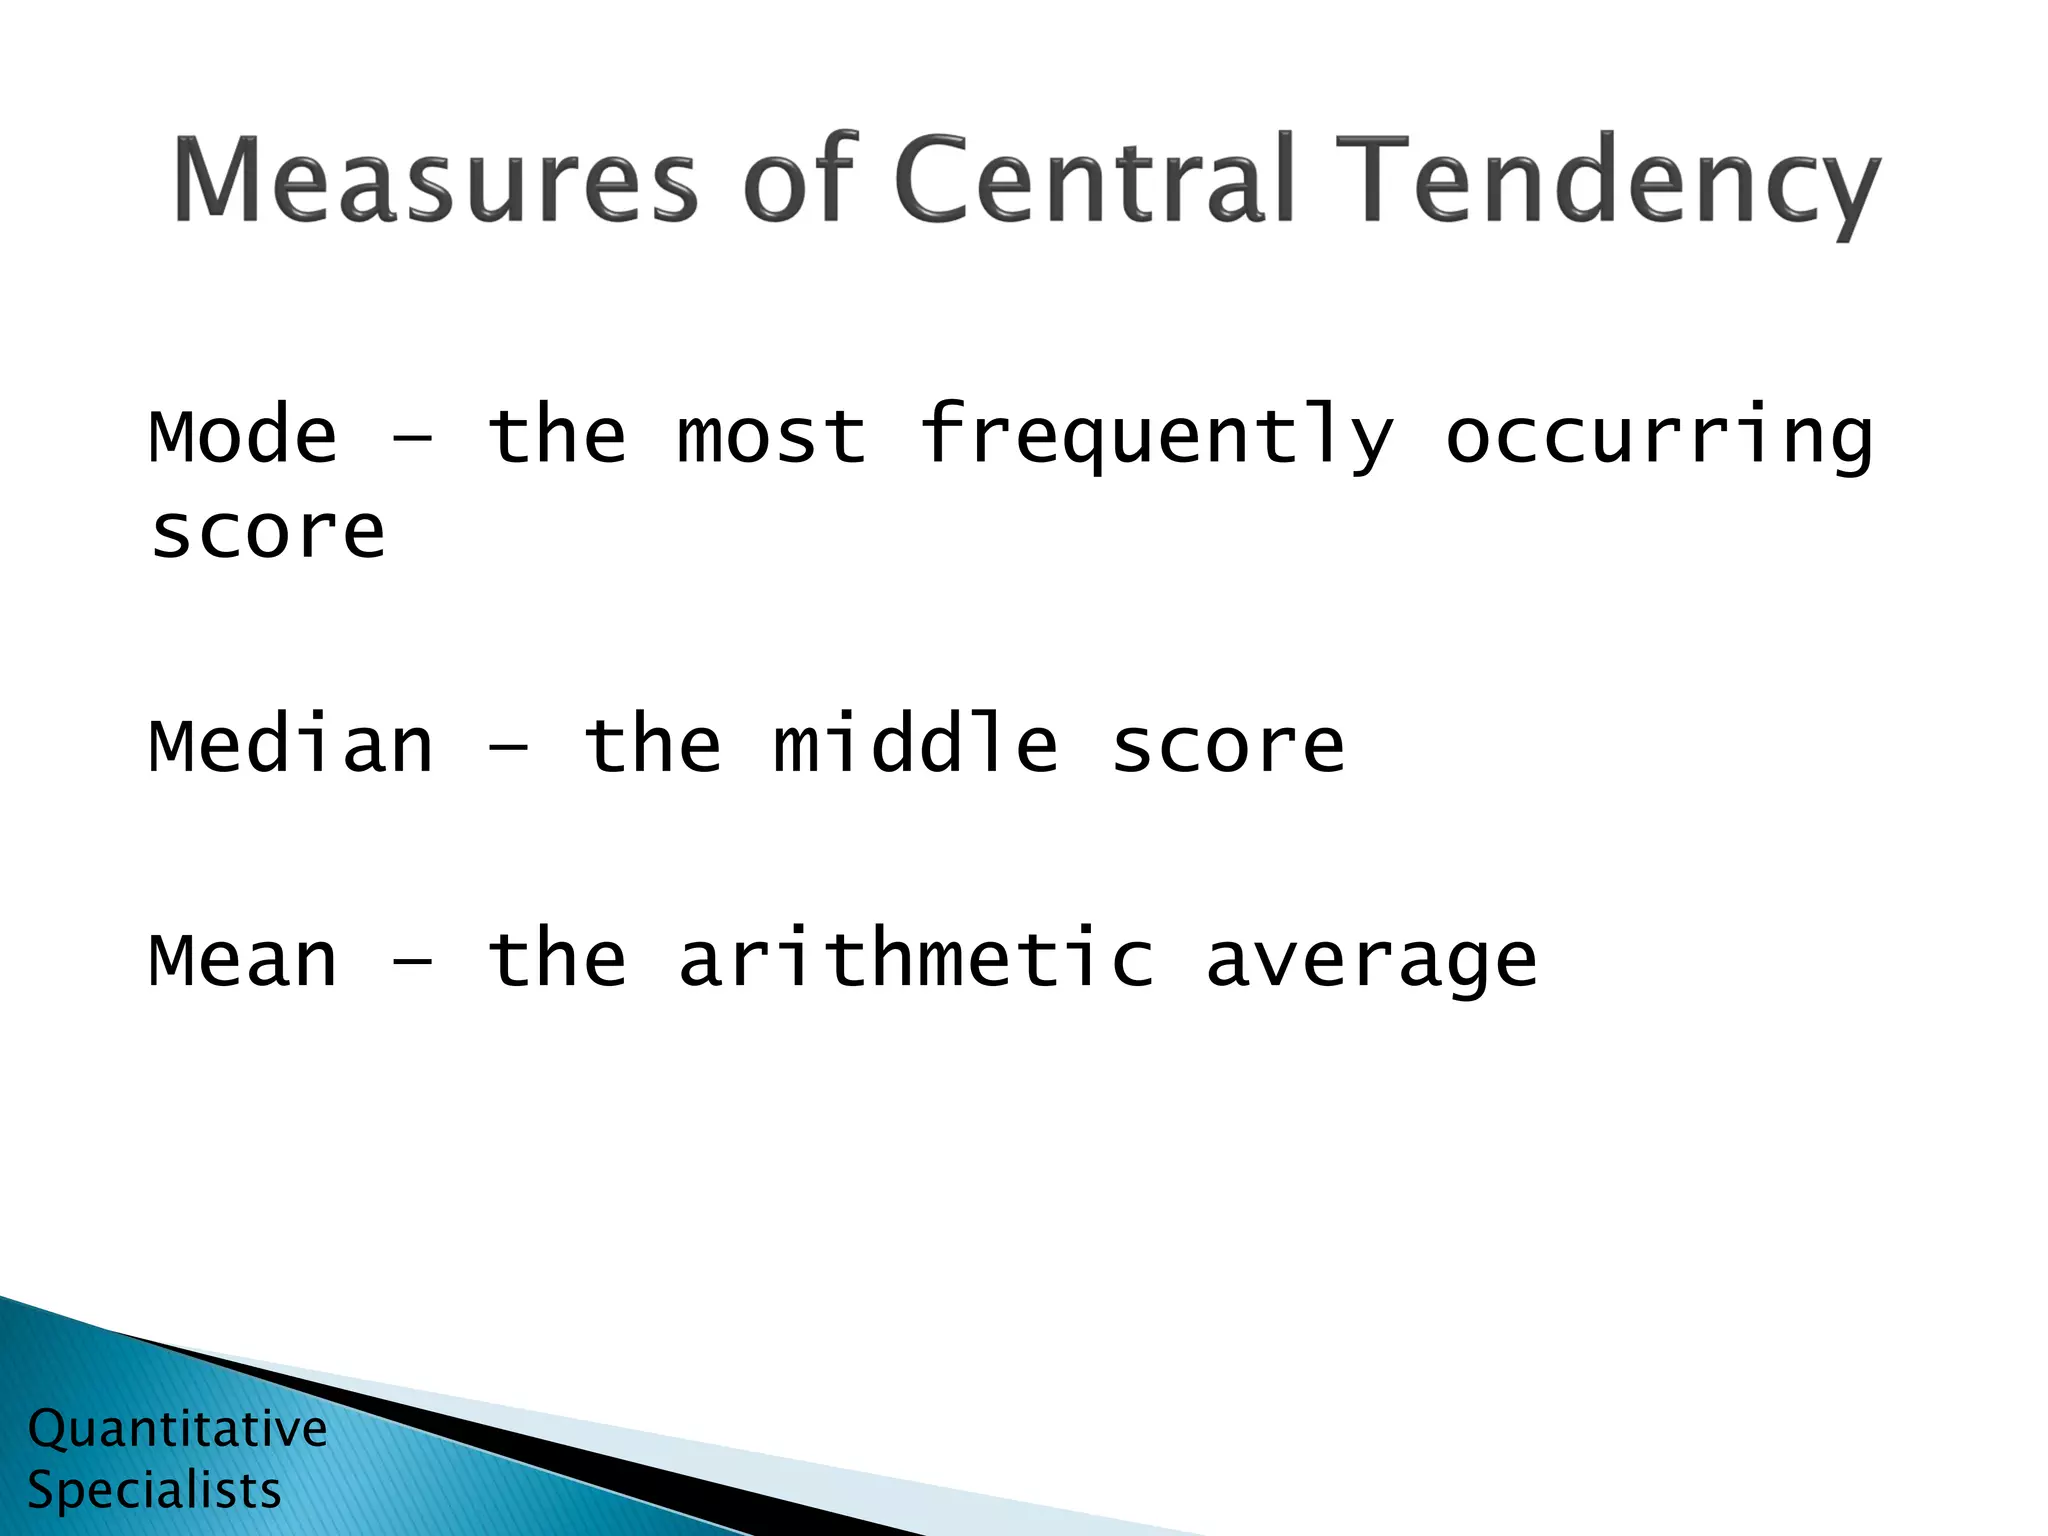
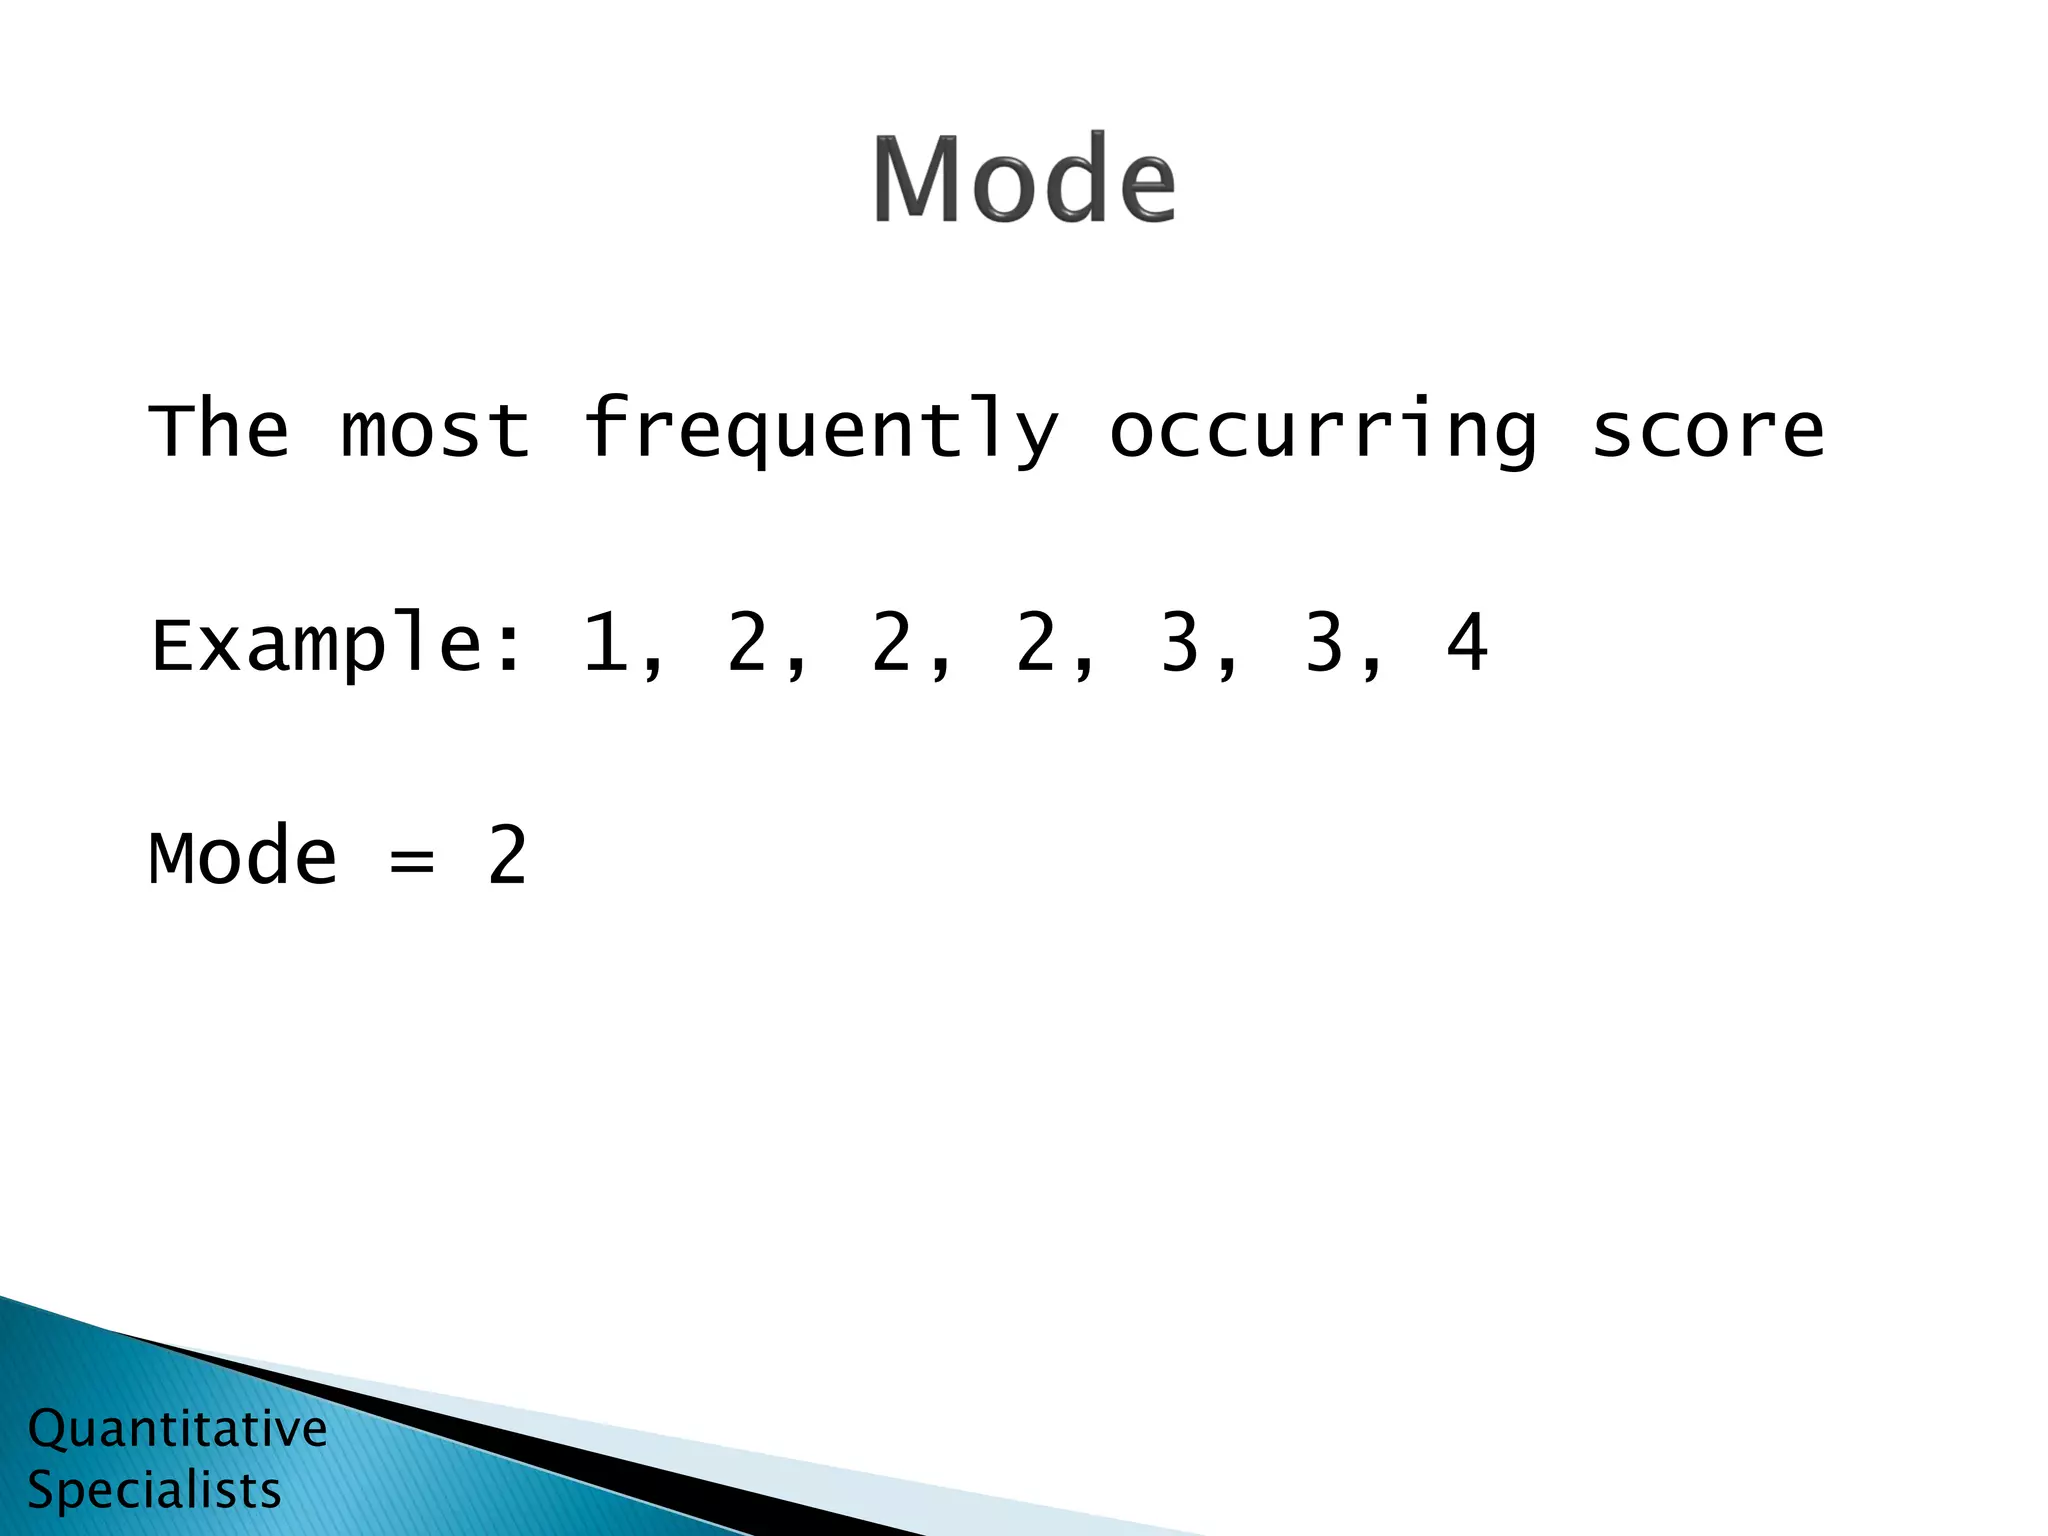
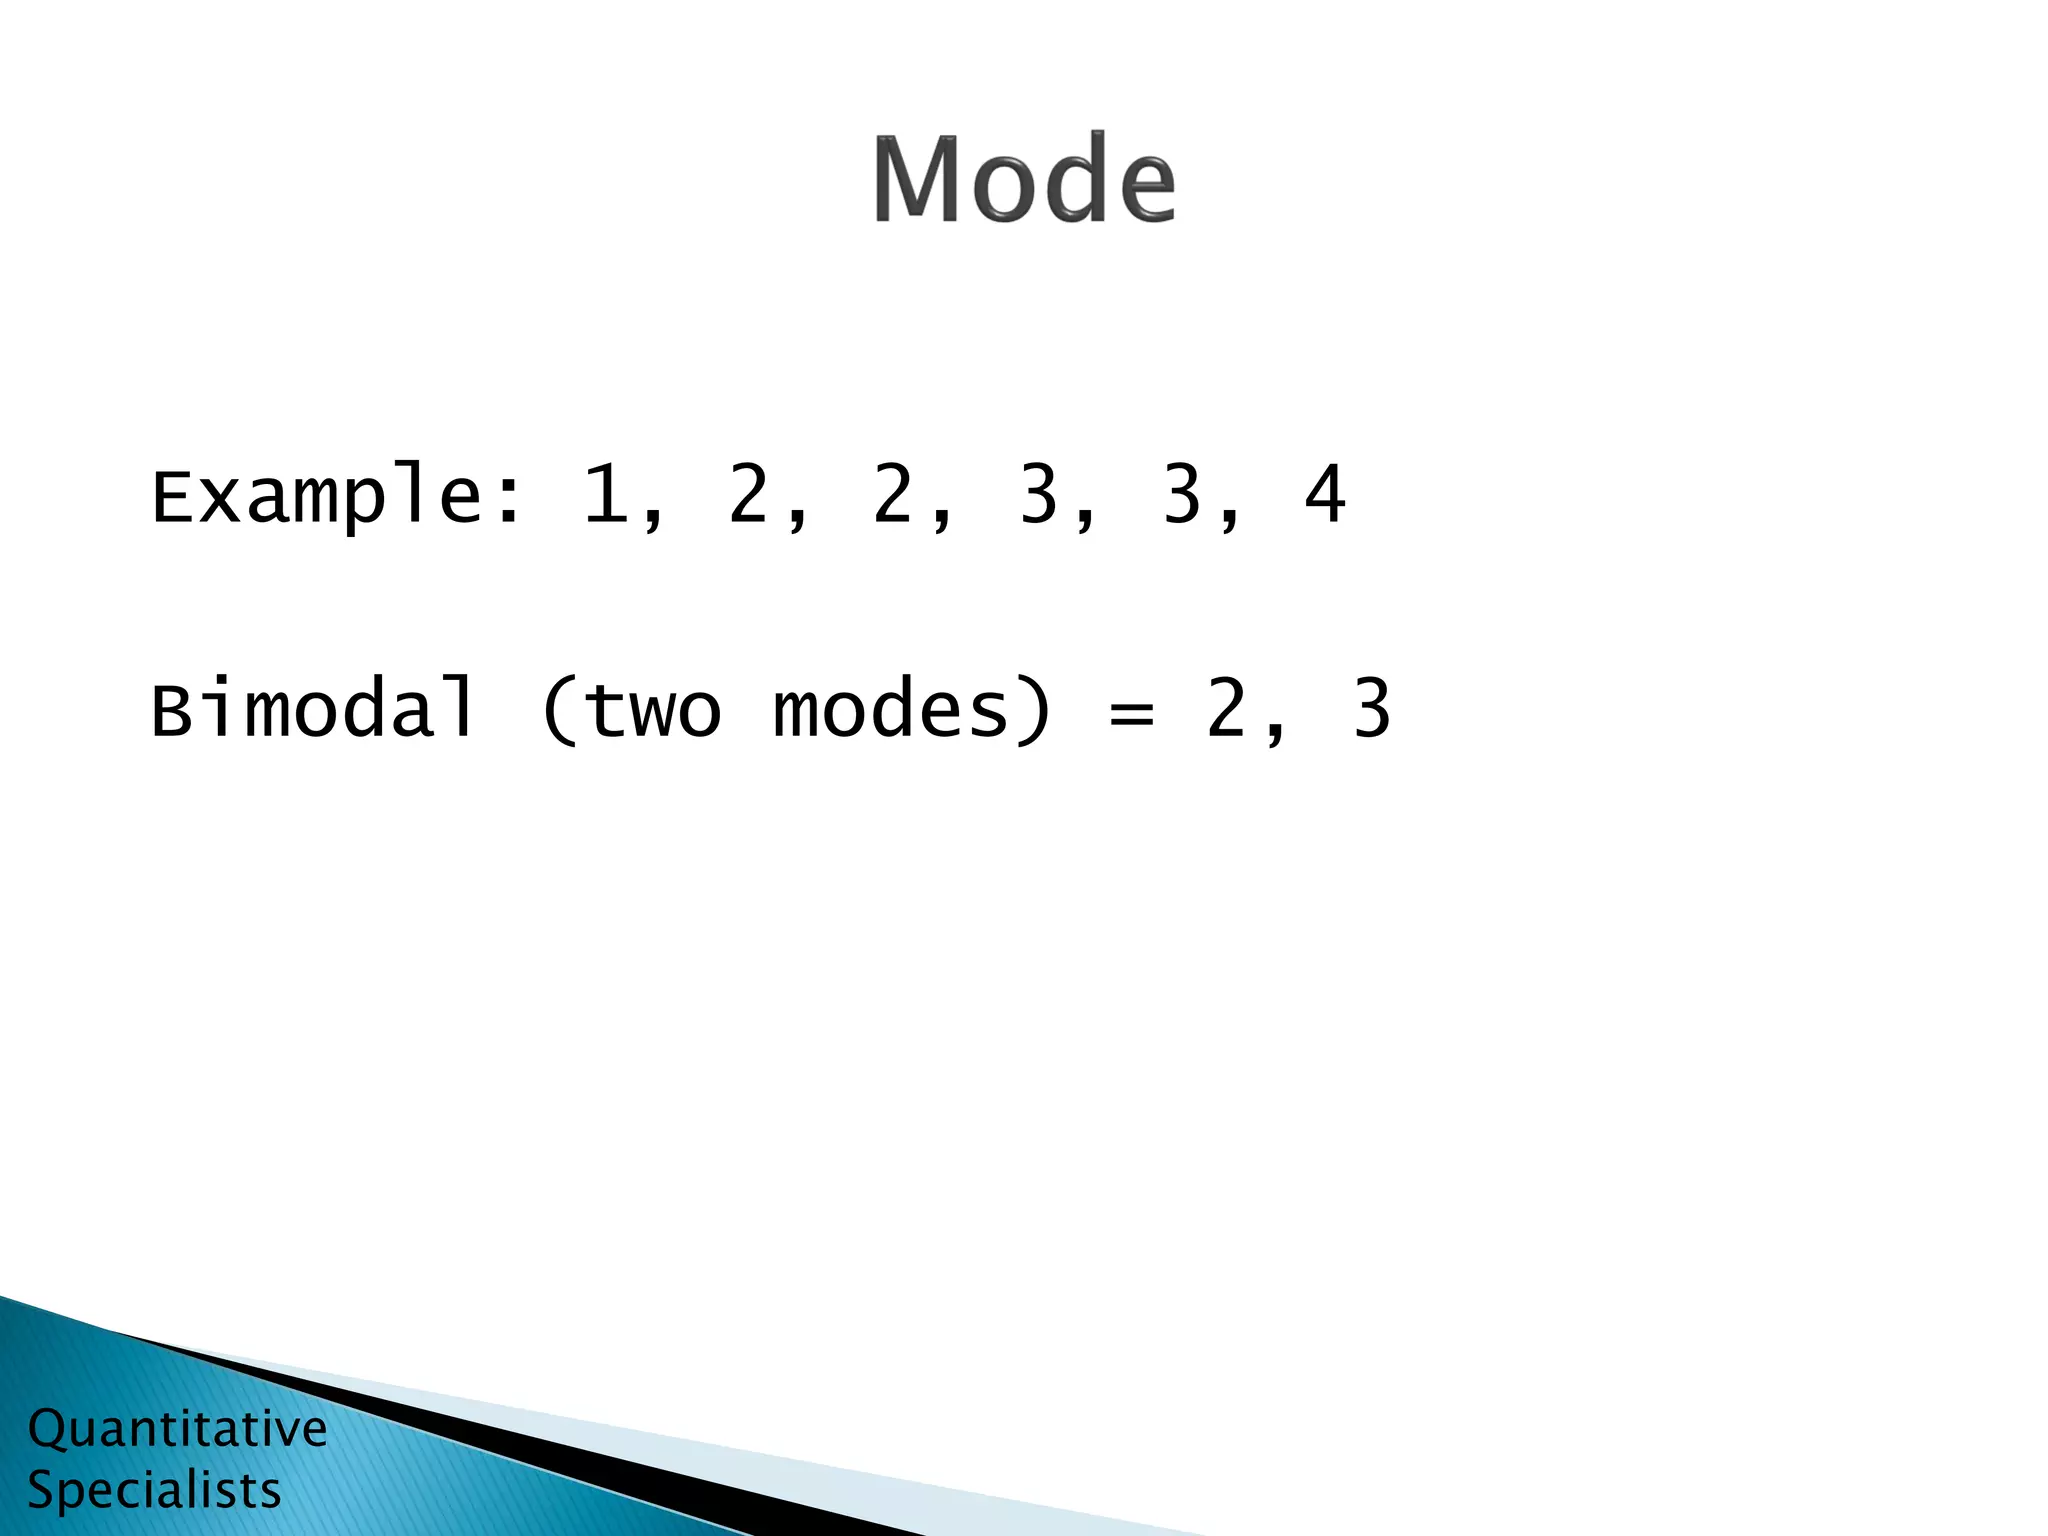
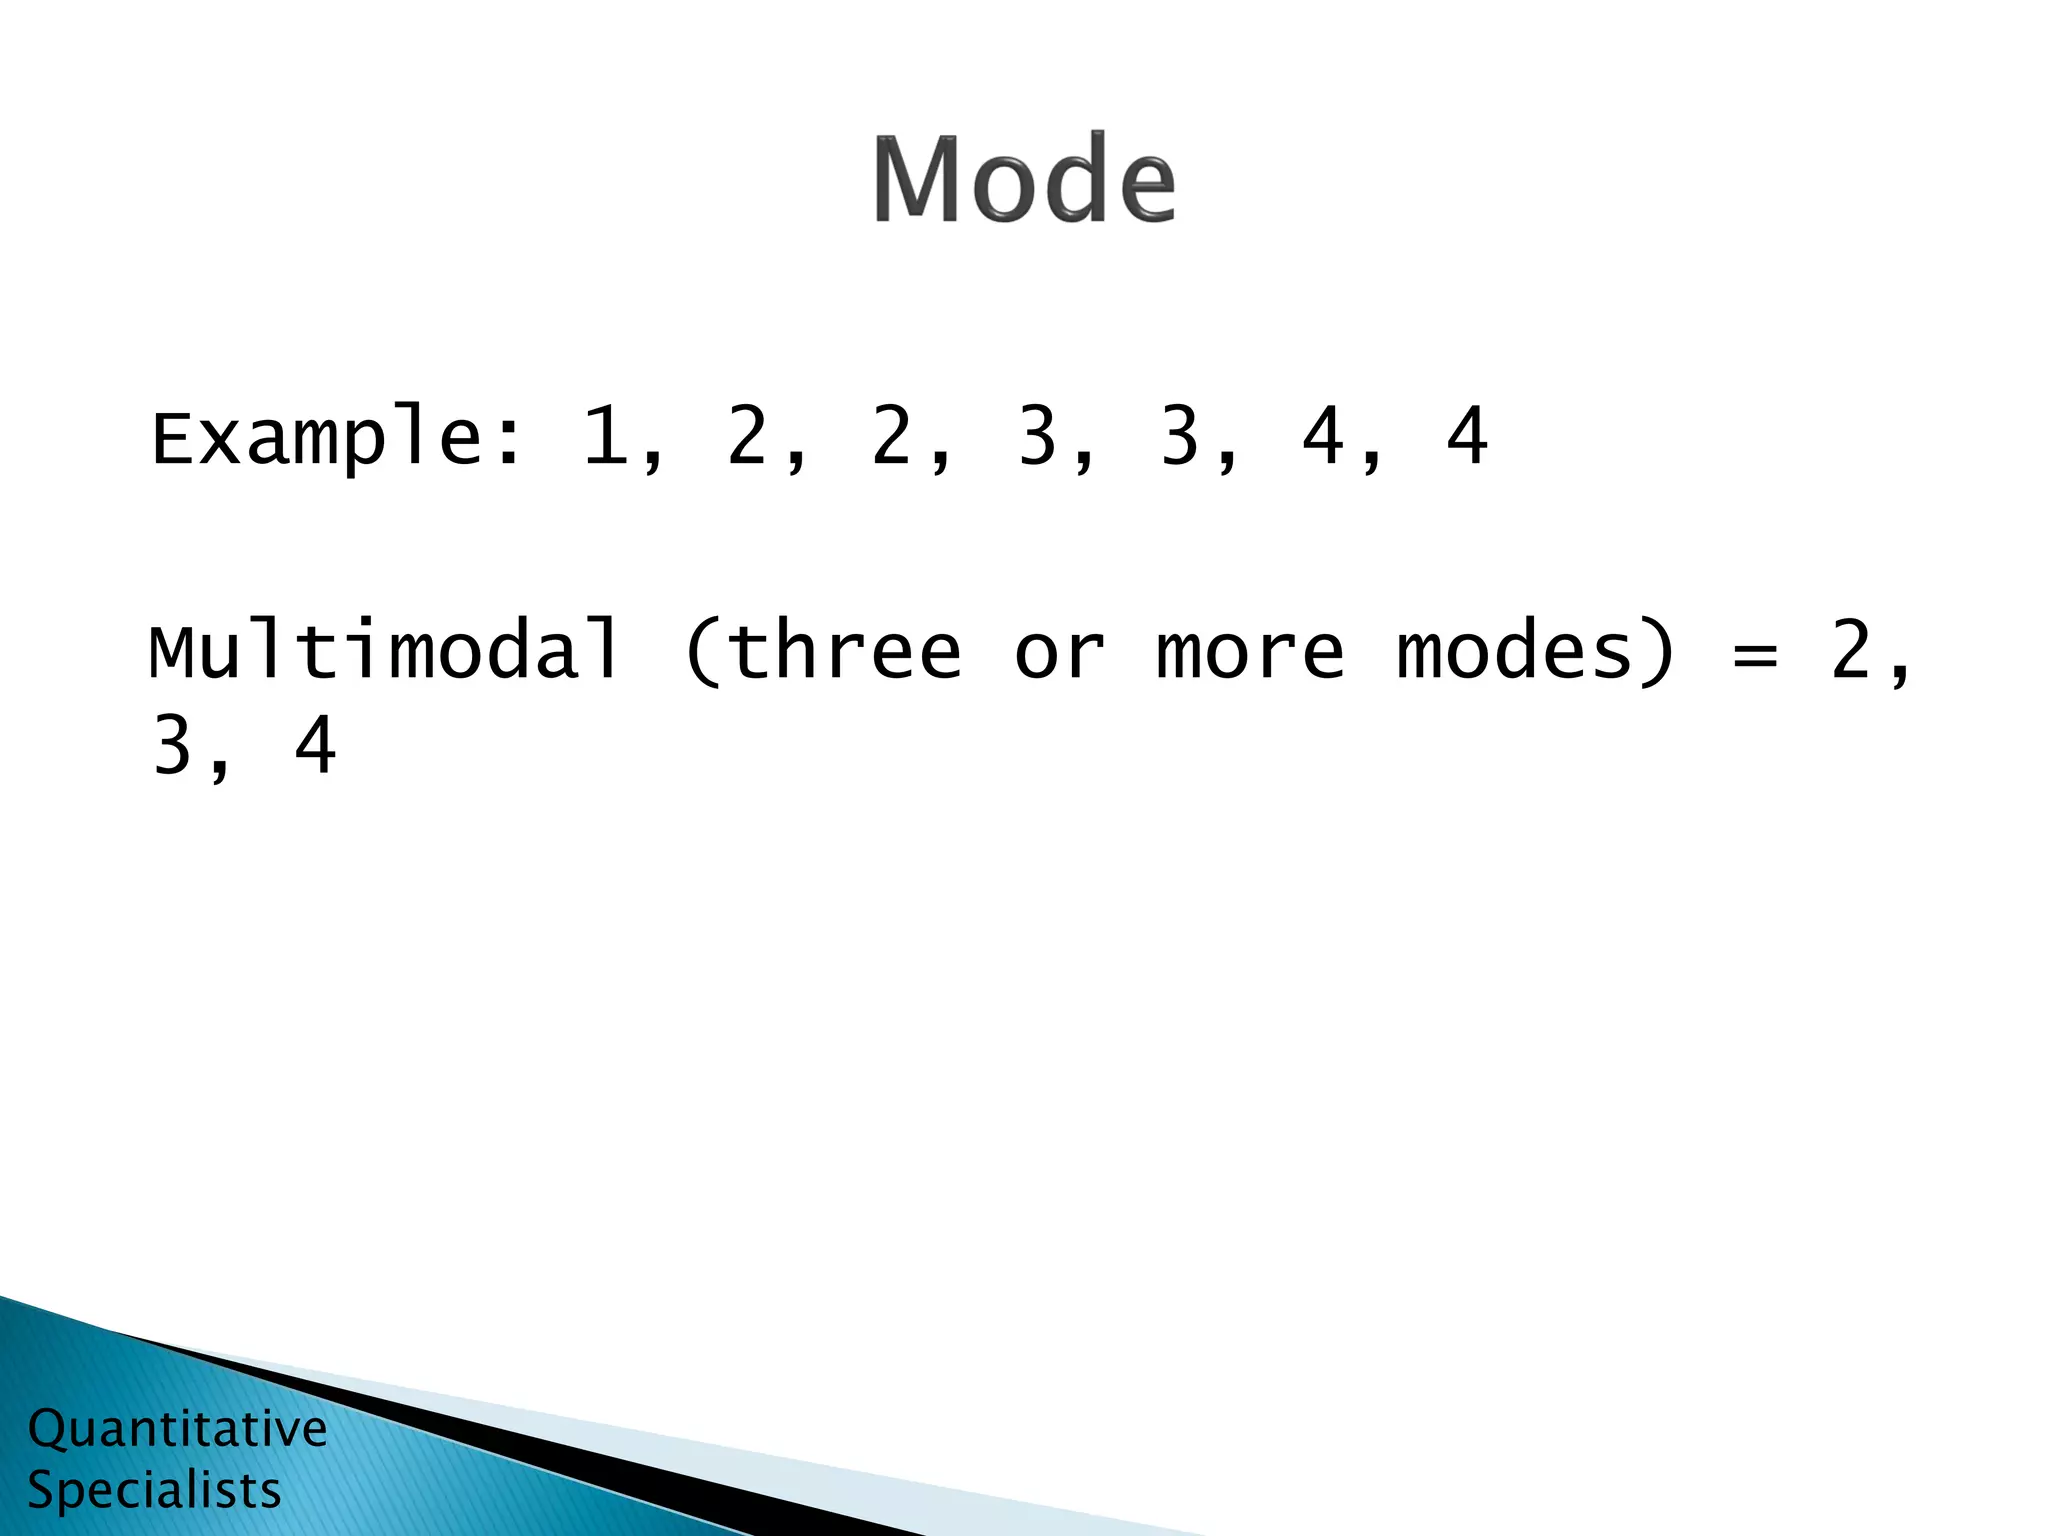
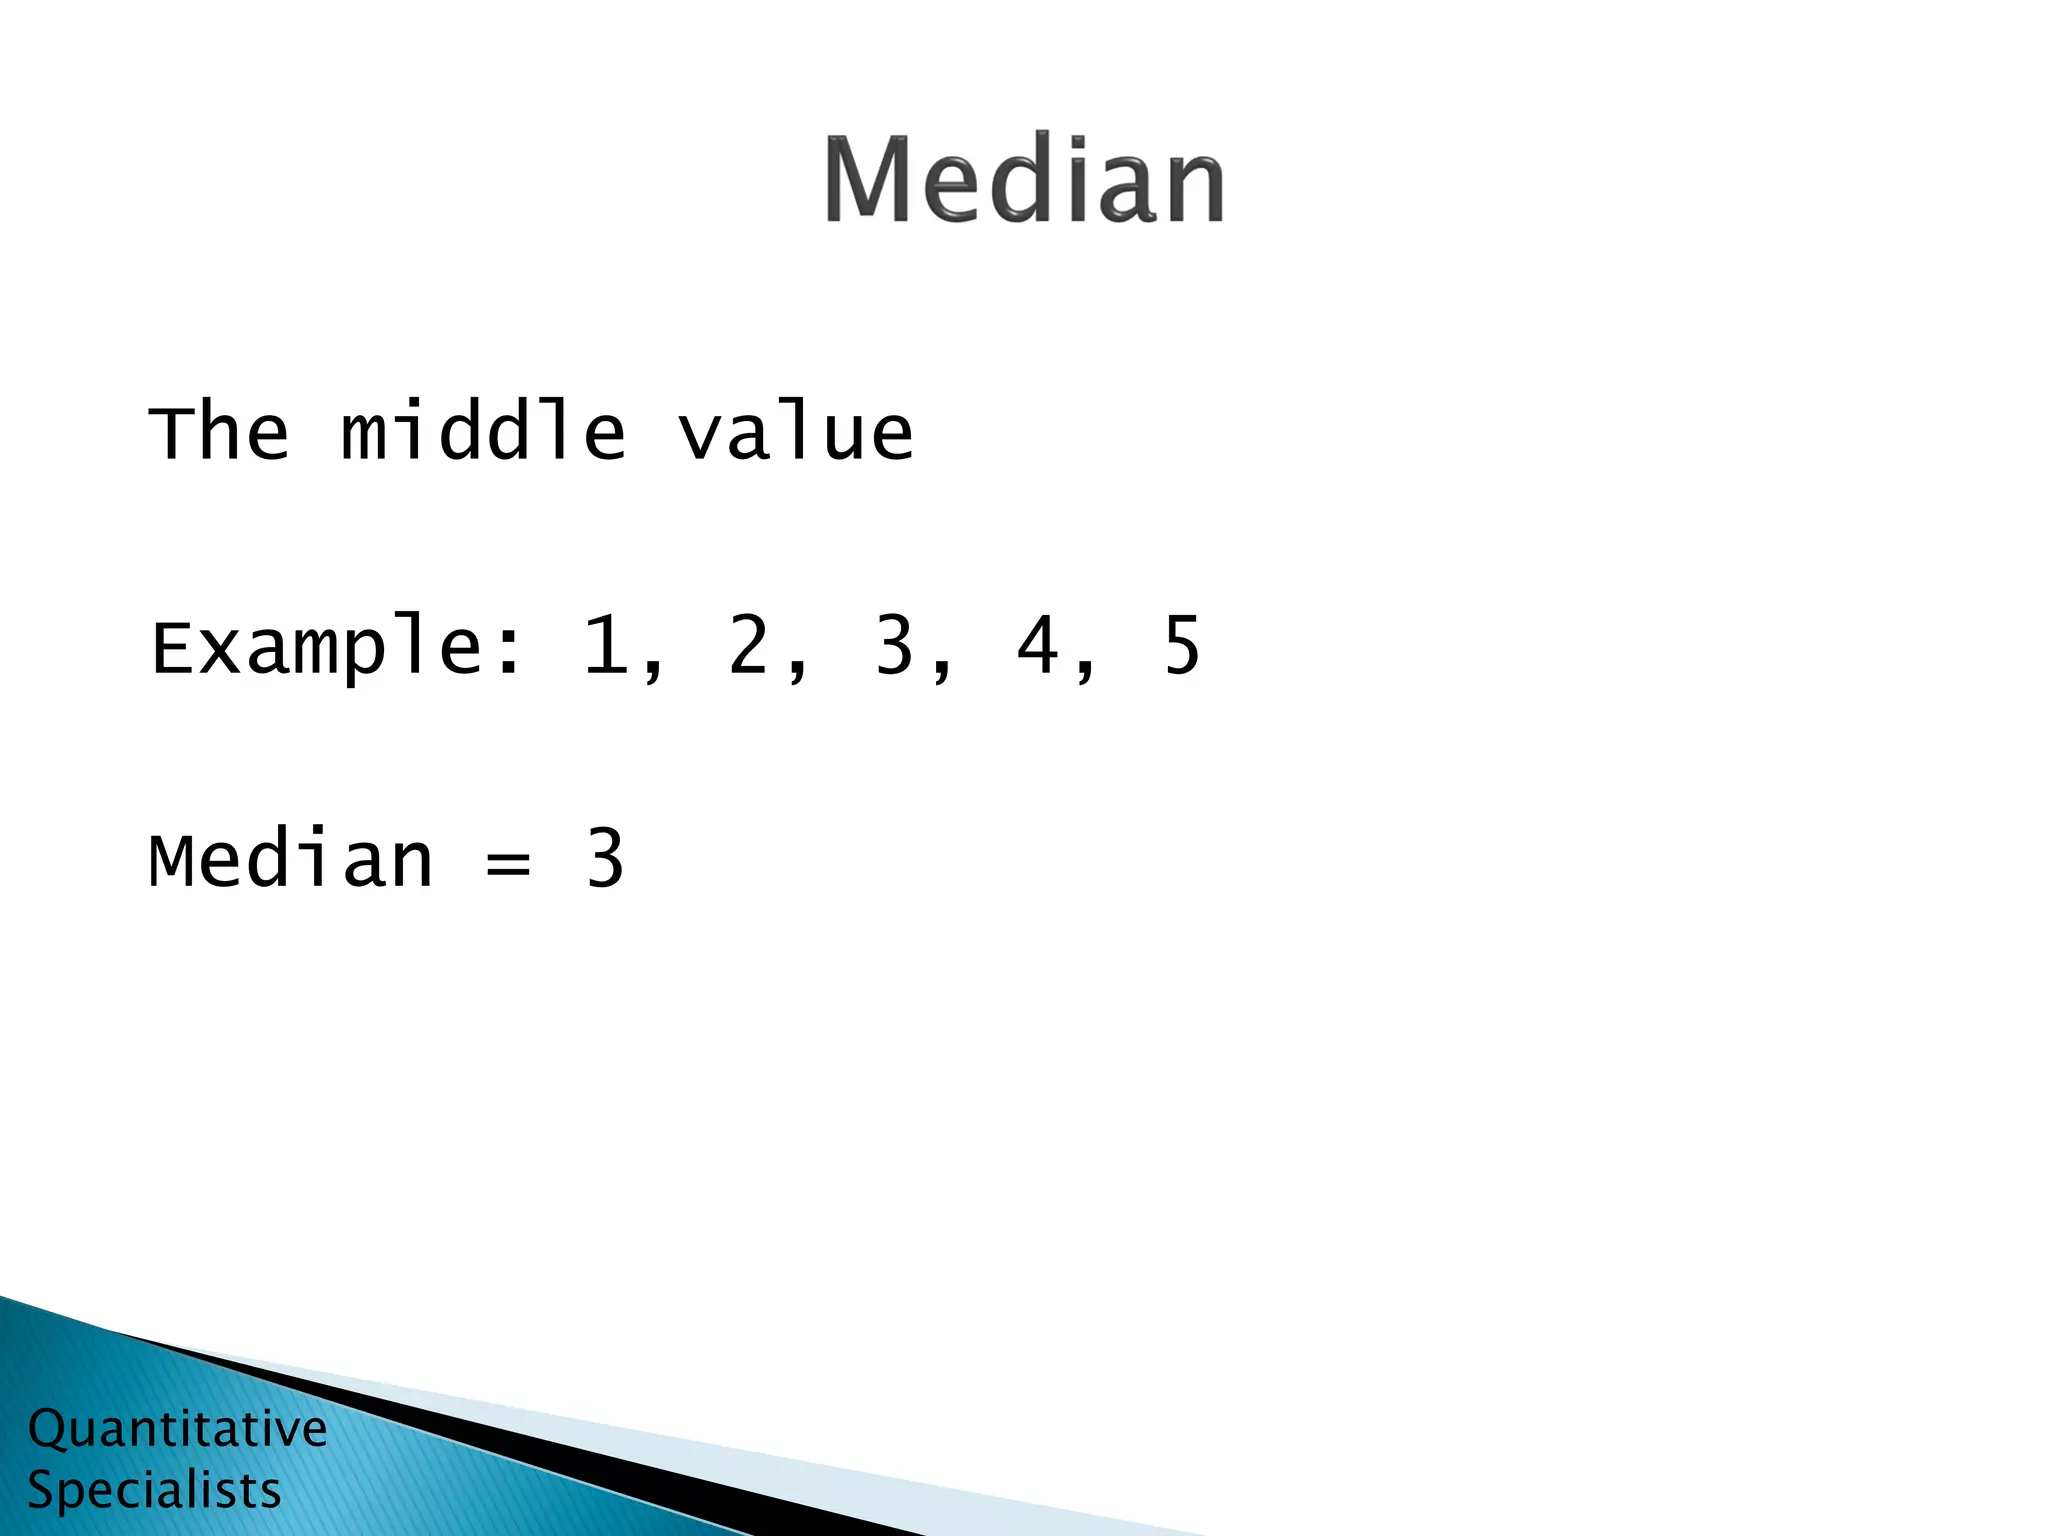
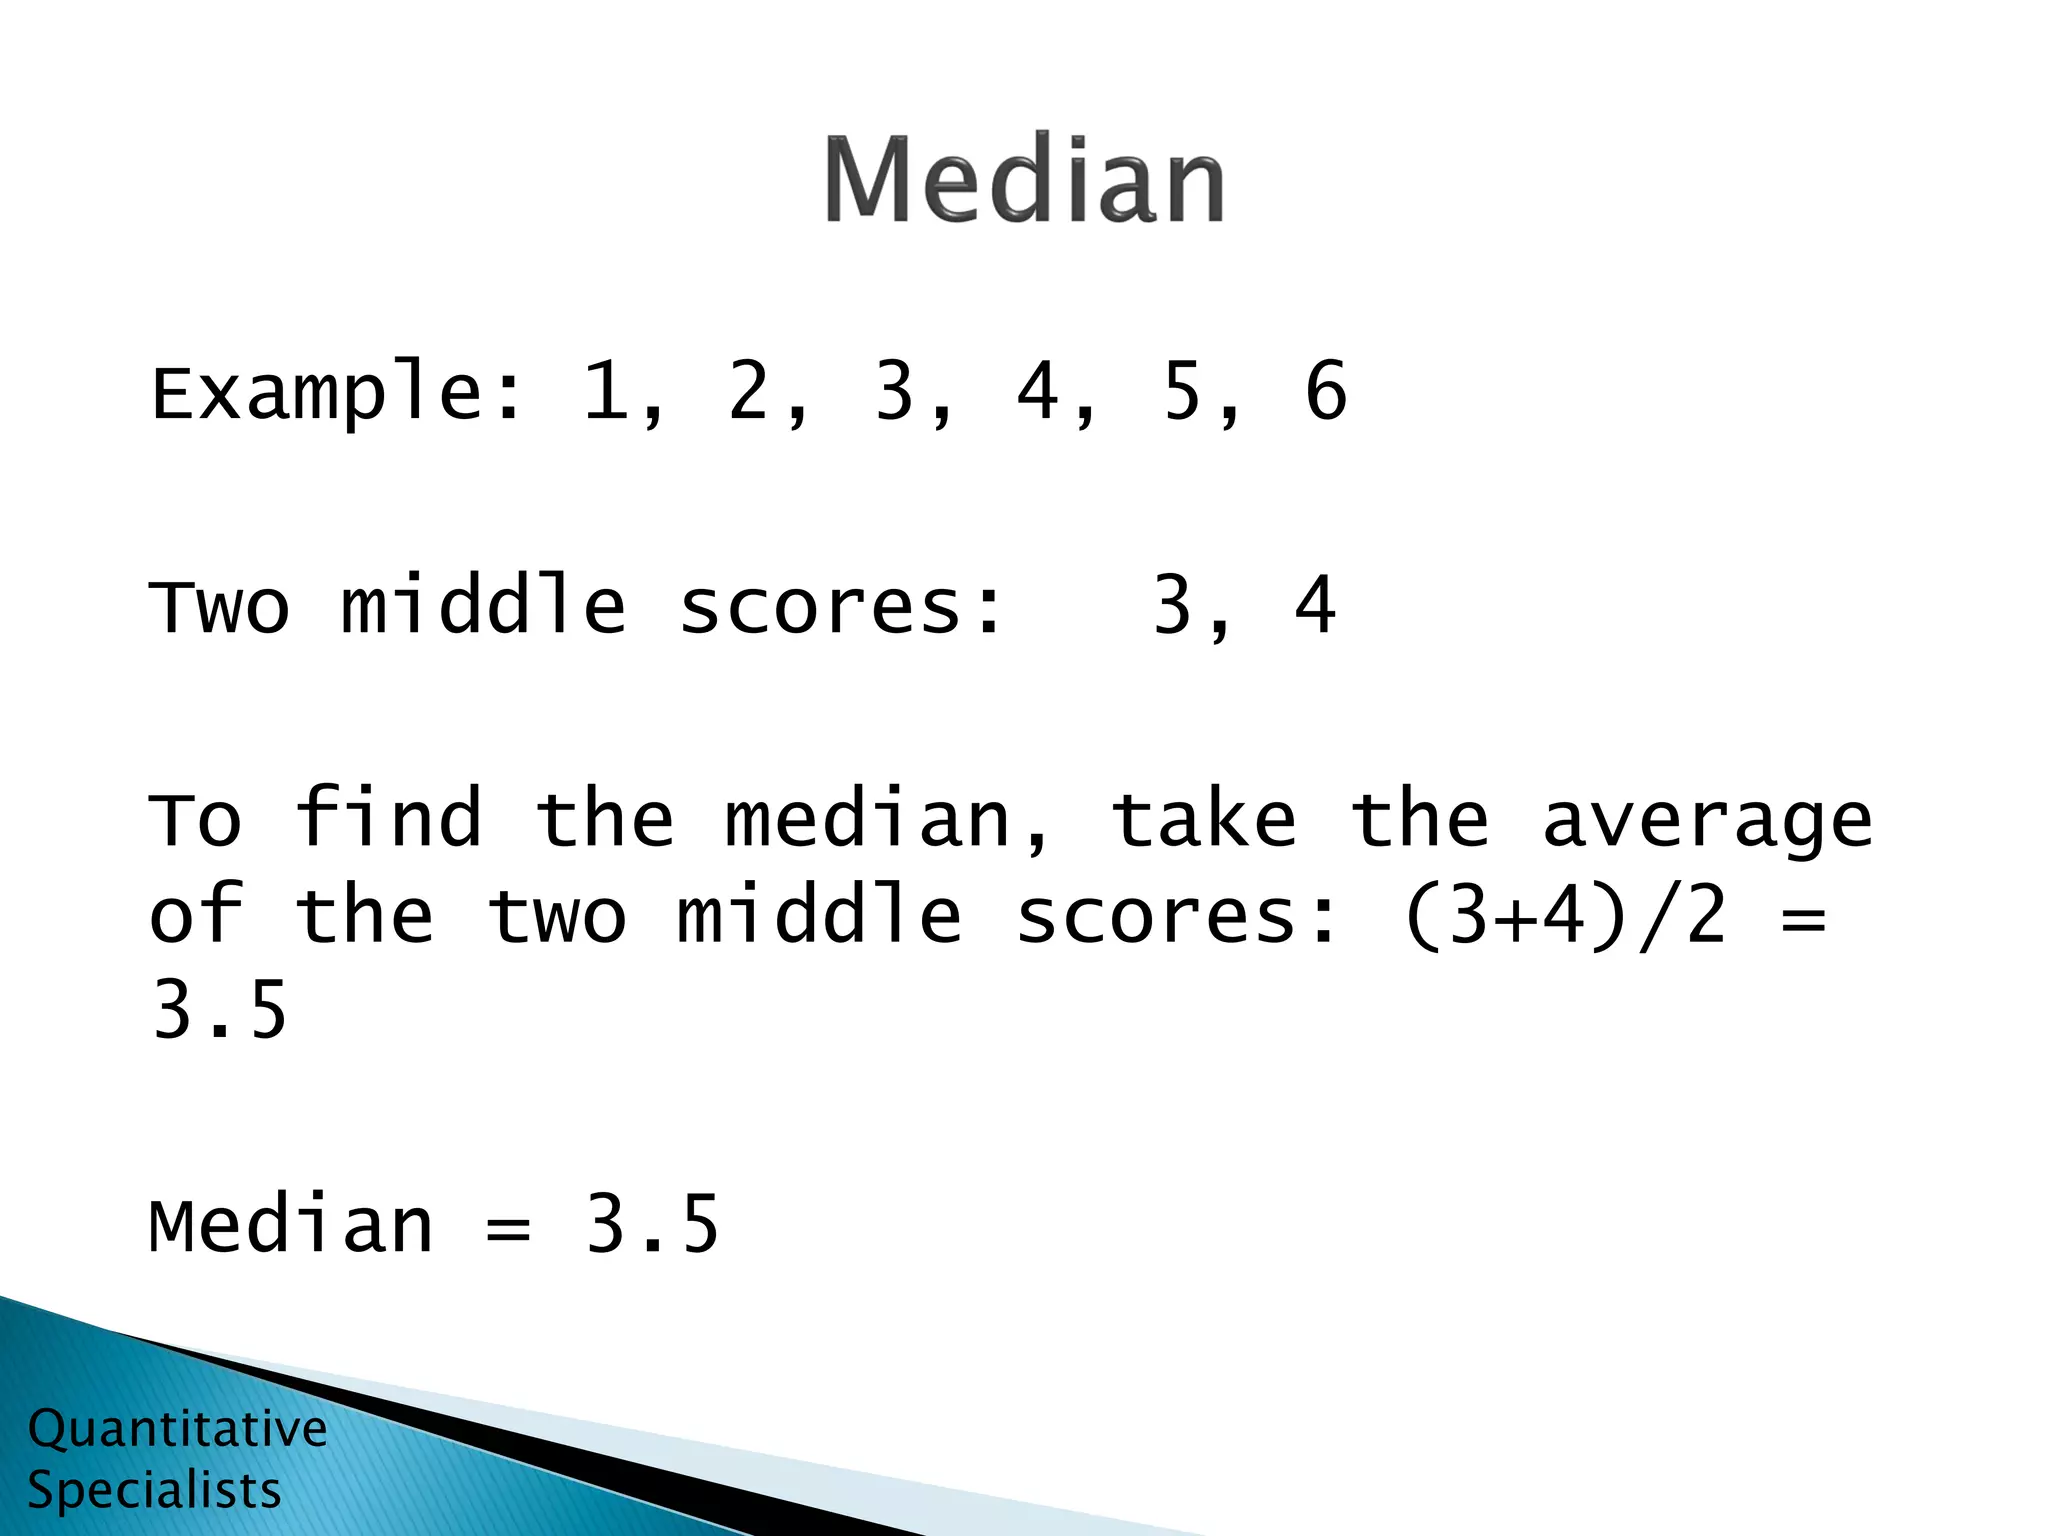
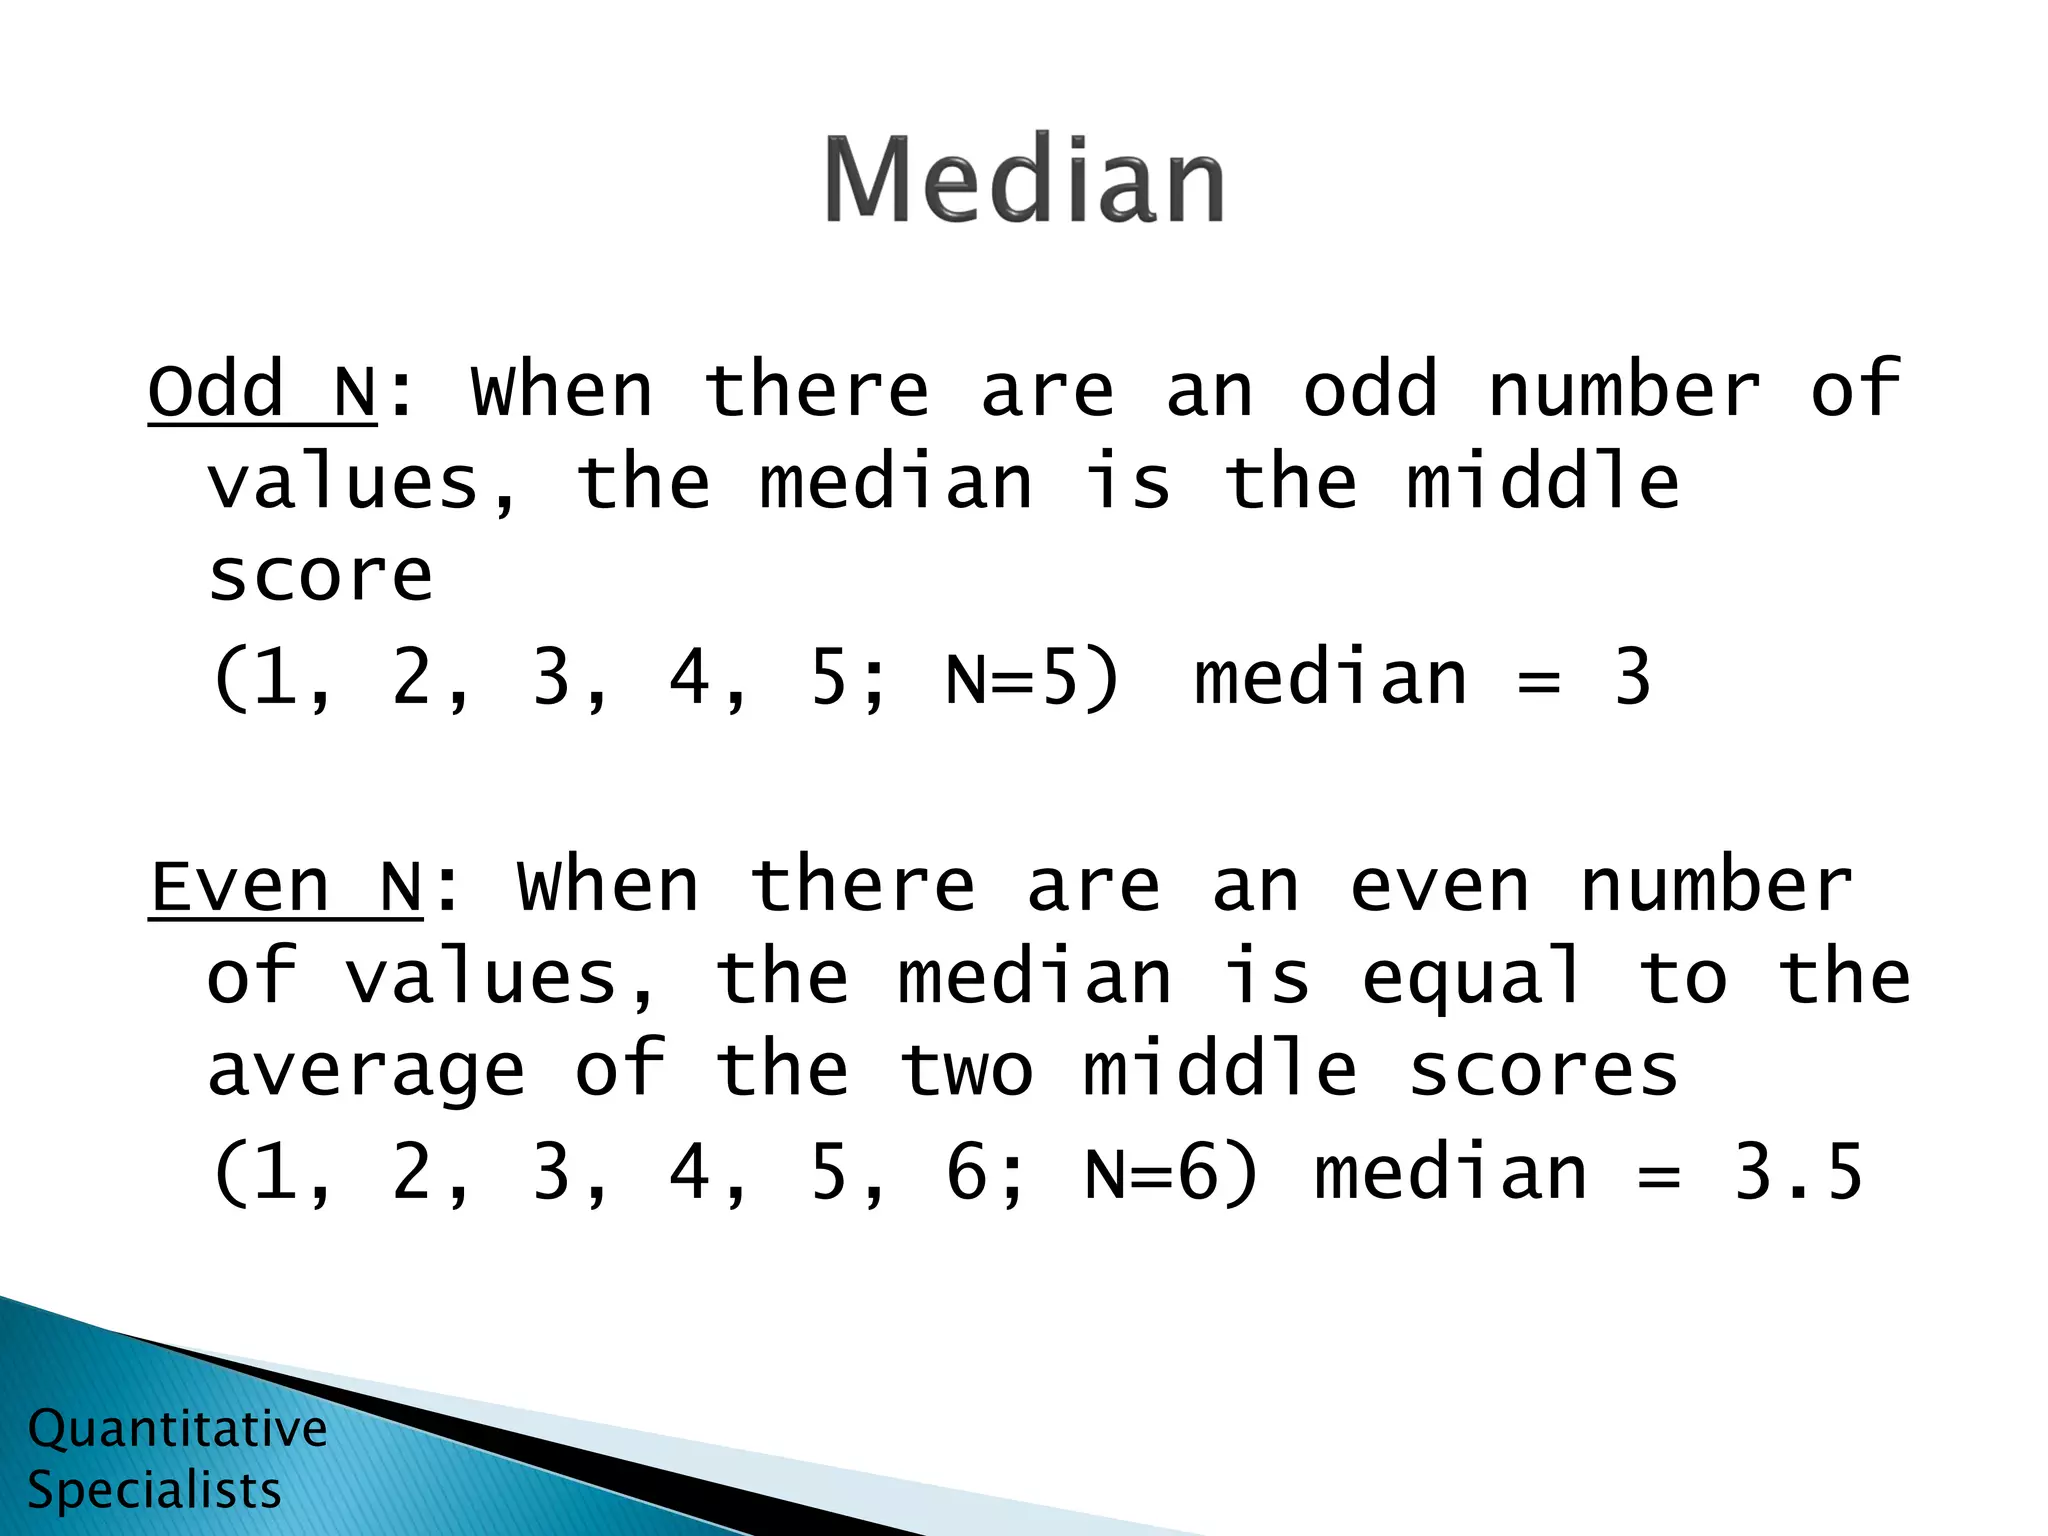
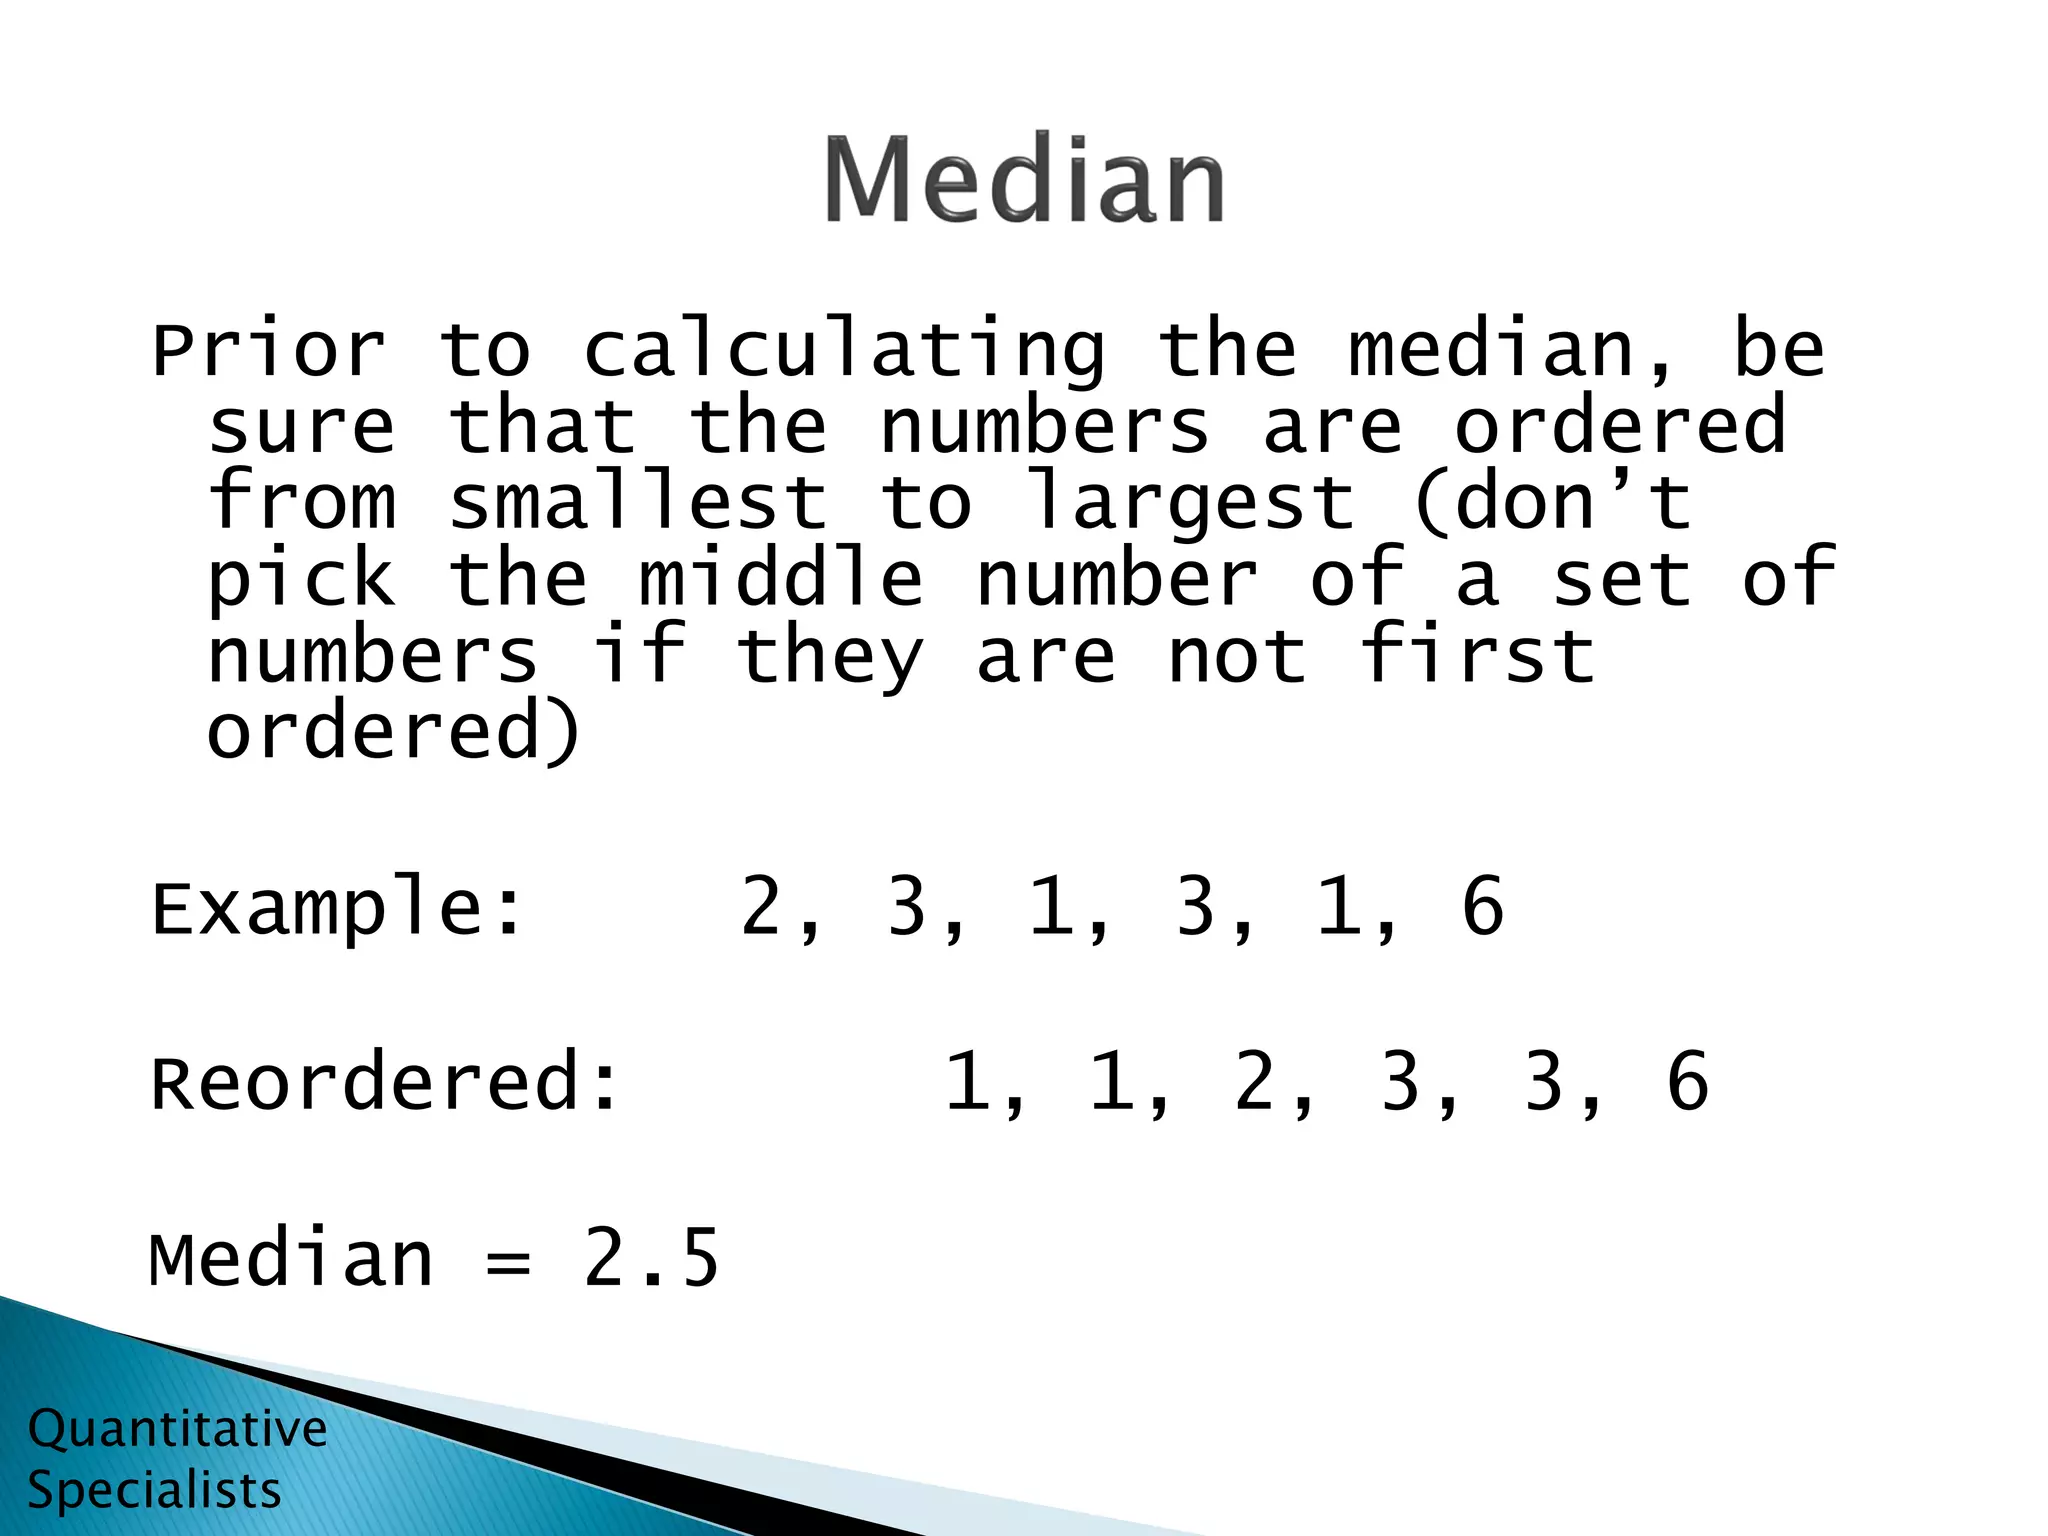
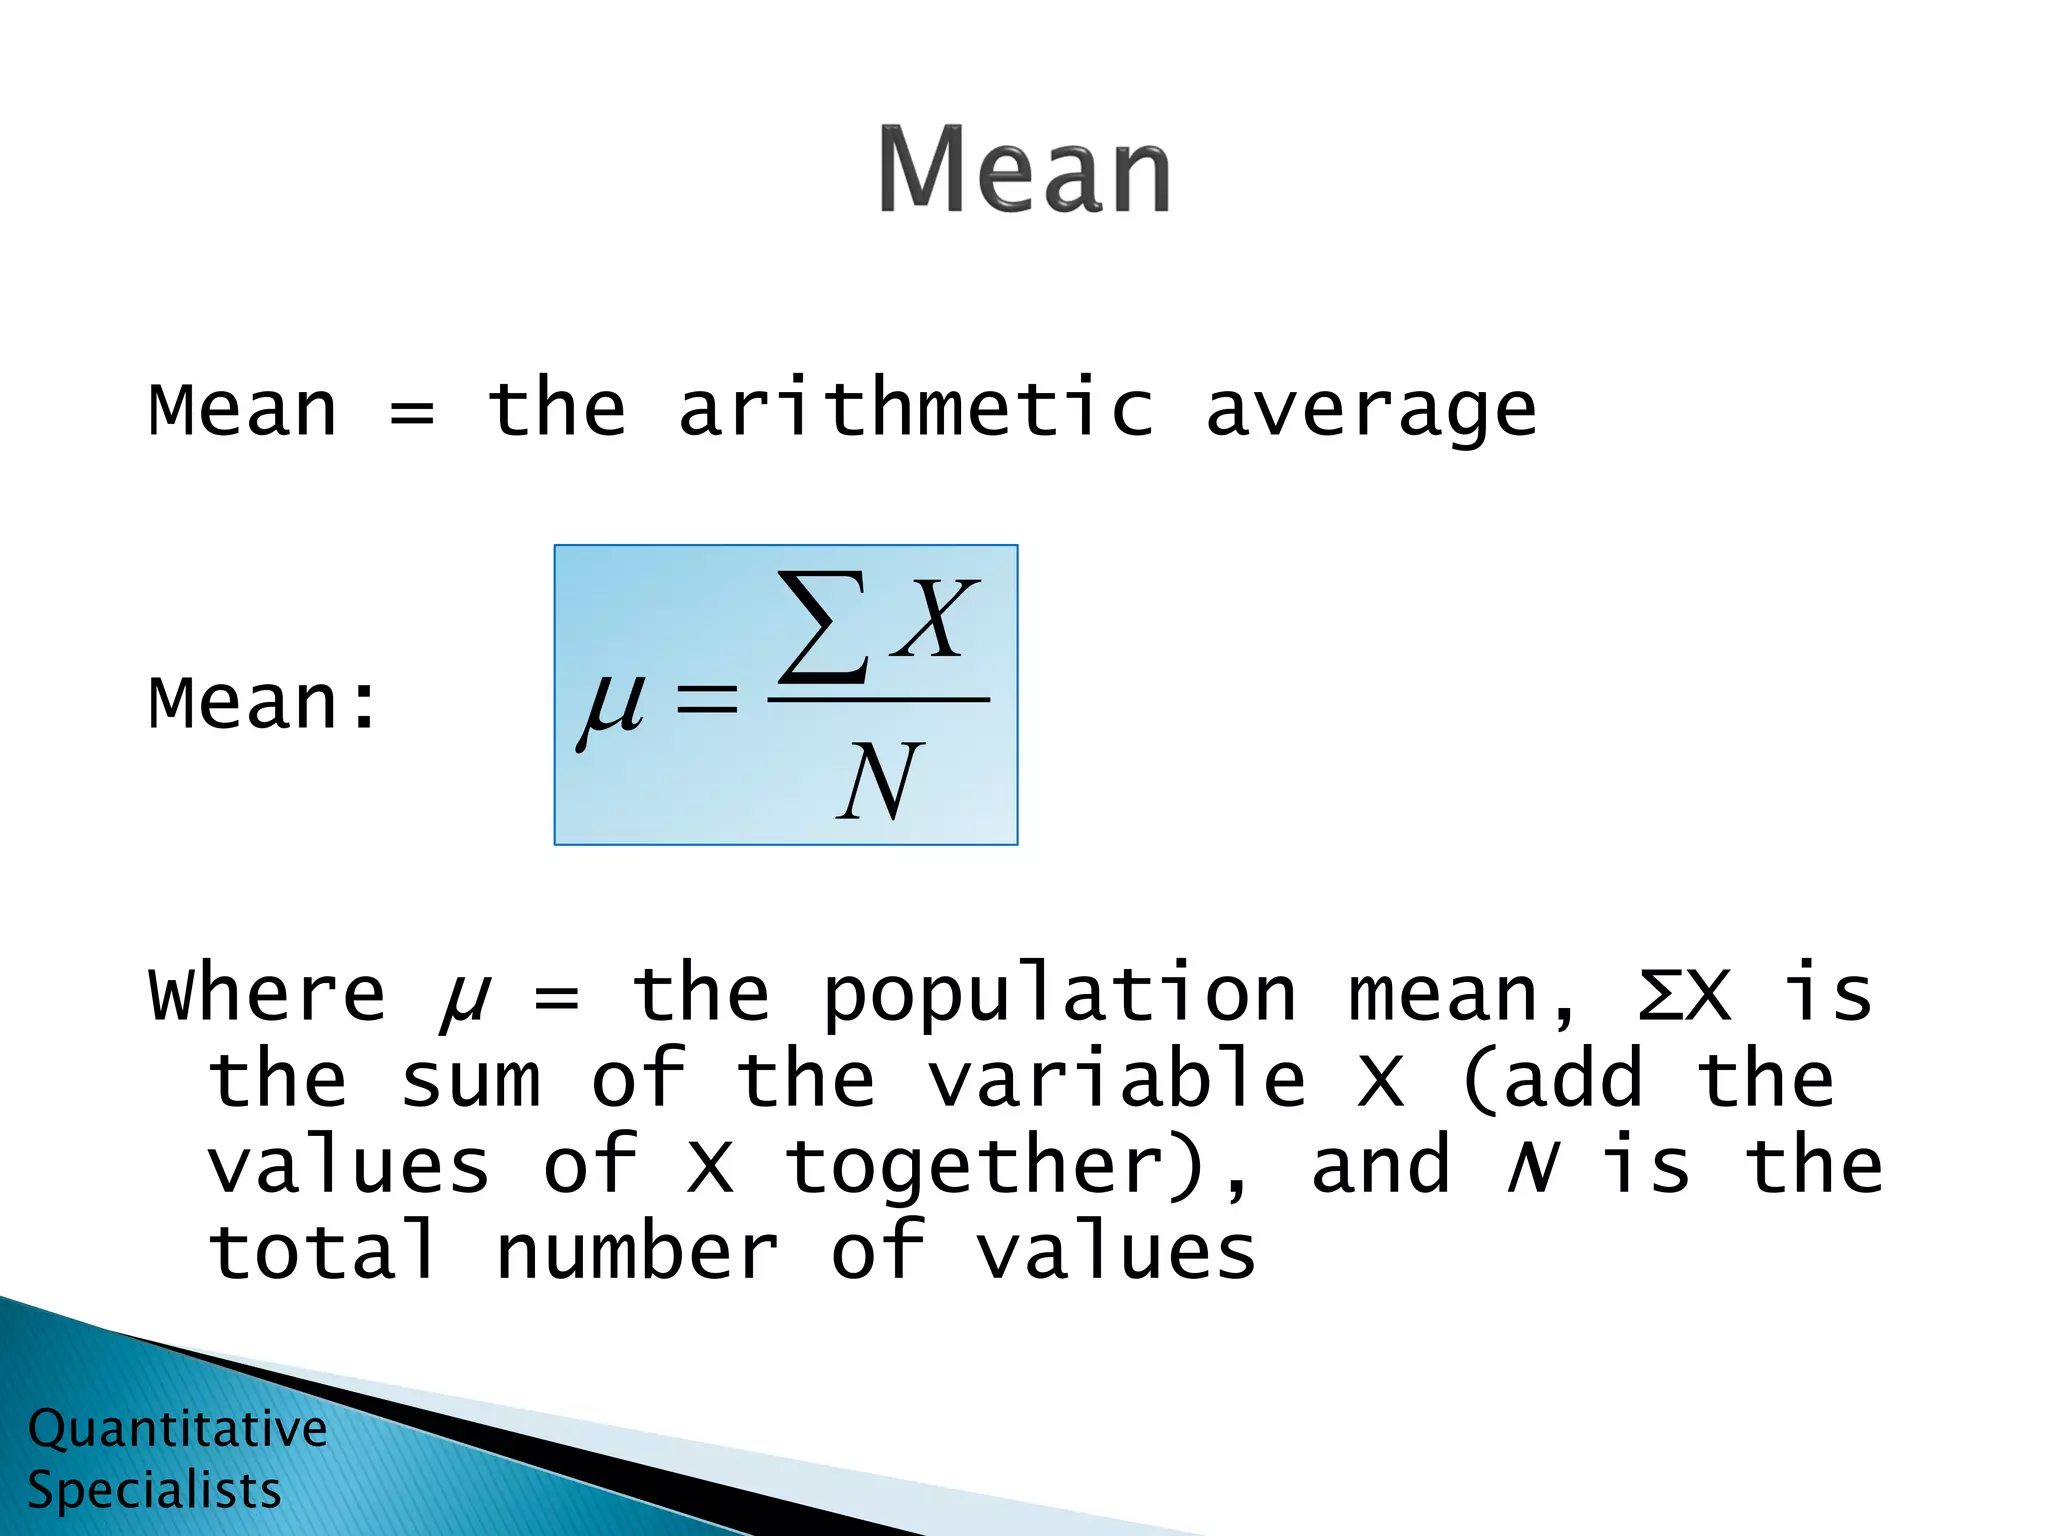
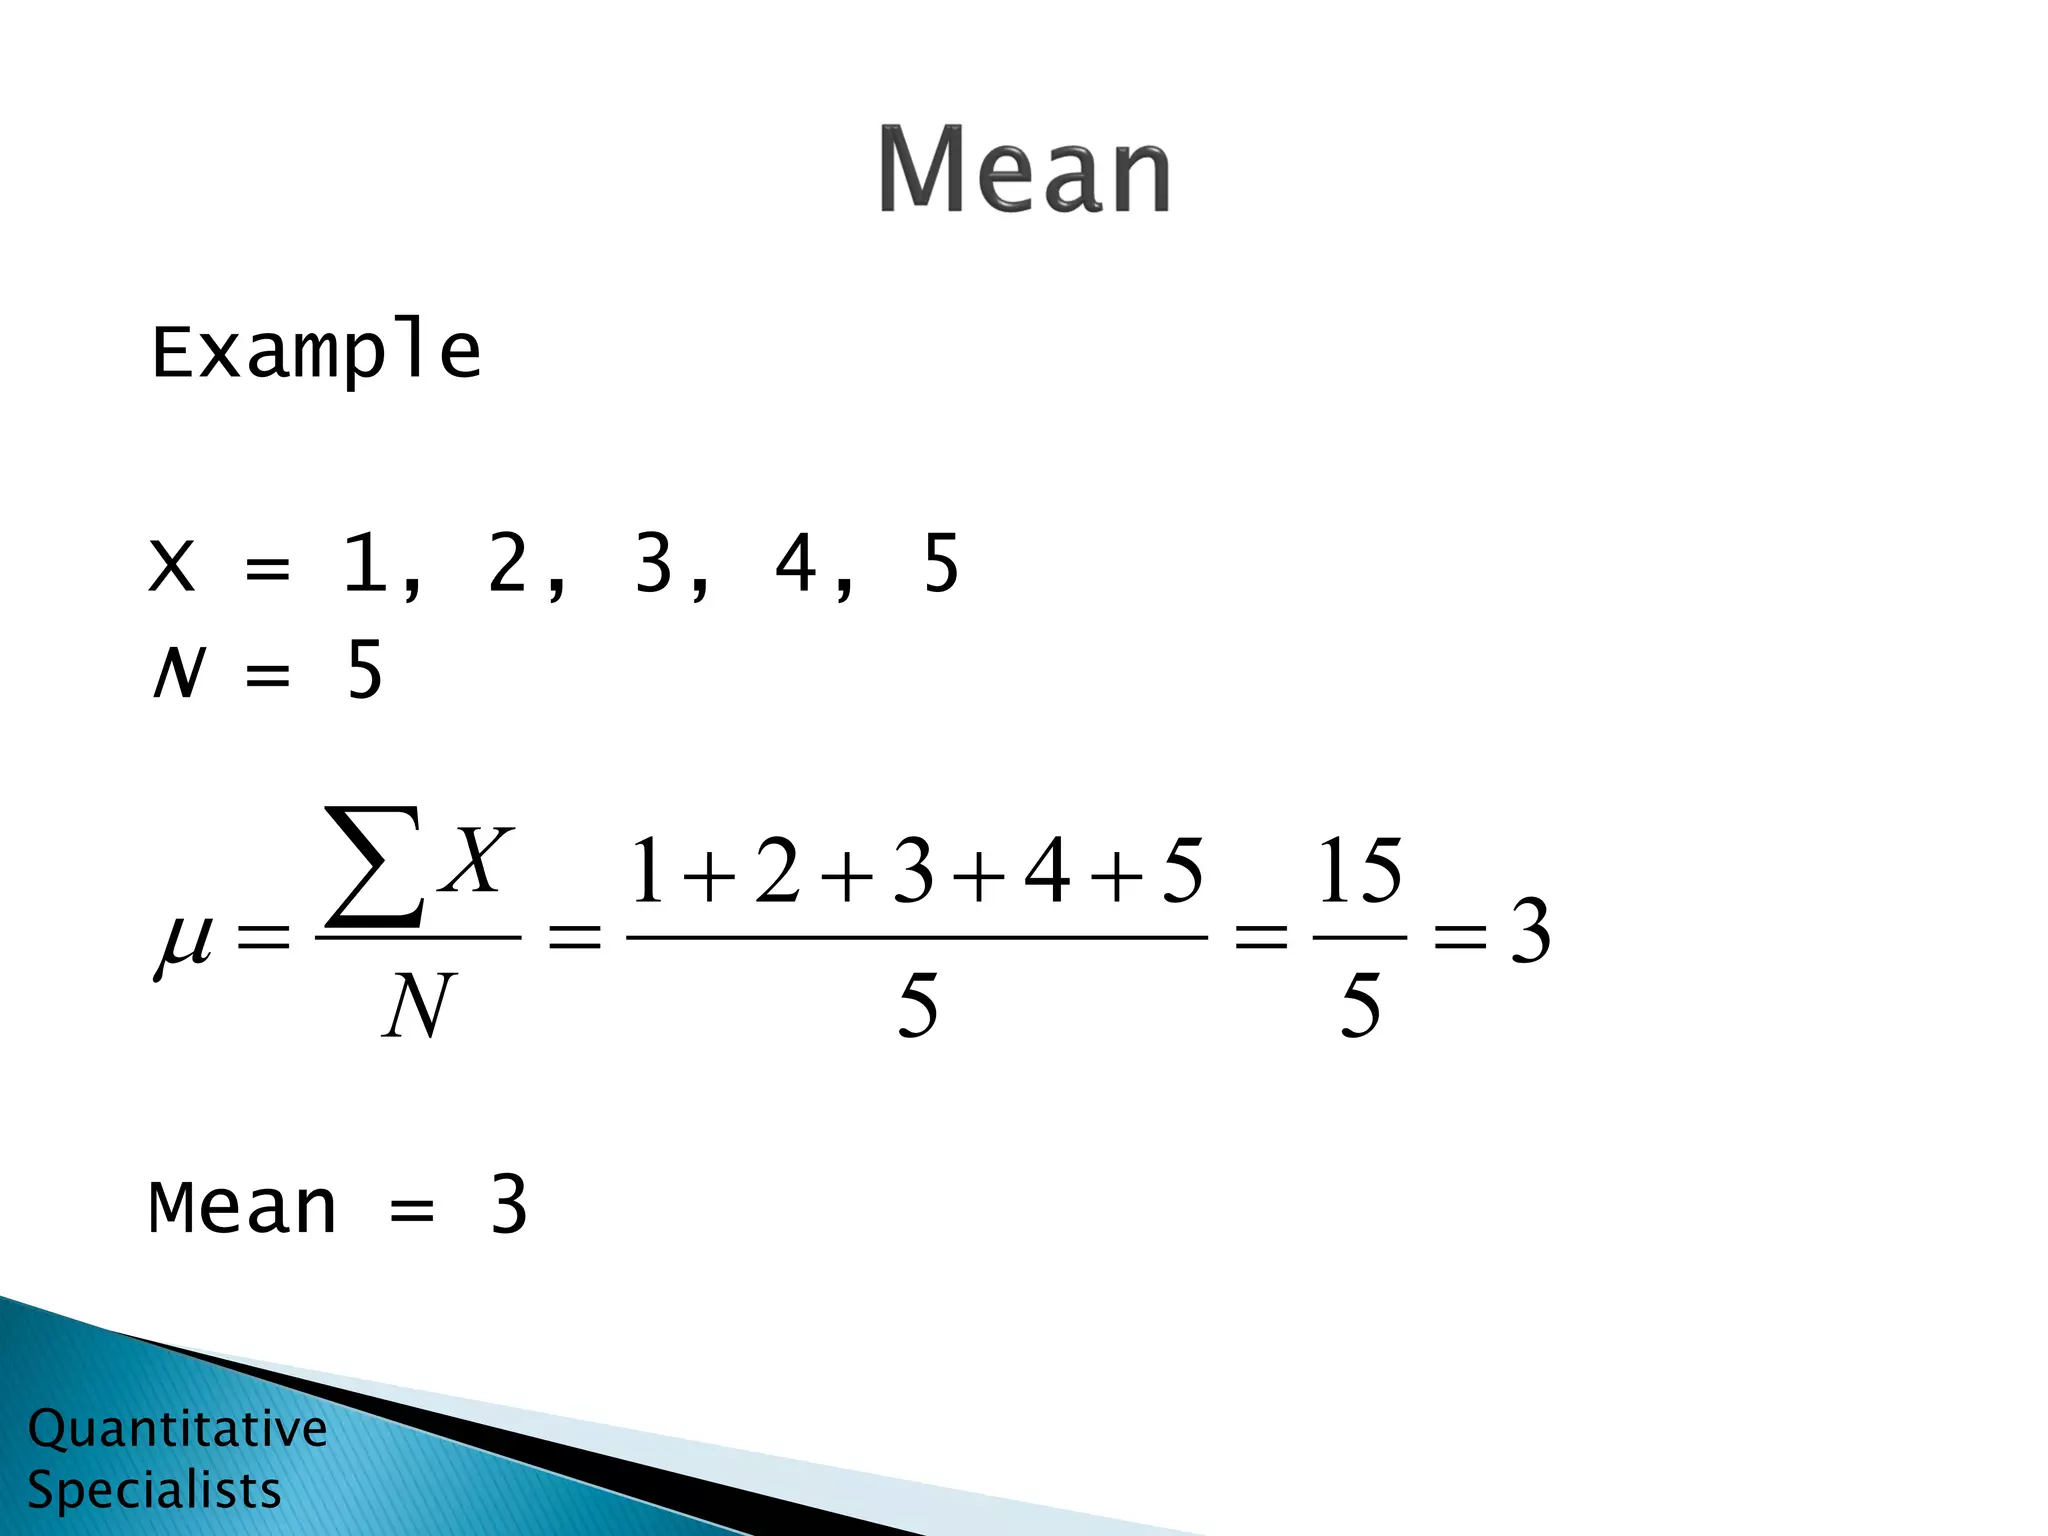
The document defines and provides examples for mode, median, and mean - three common measures of central tendency used in statistics. Mode is defined as the most frequently occurring value, median is defined as the middle value when values are ordered from lowest to highest, and mean is defined as the arithmetic average calculated by summing all values and dividing by the total number of values. Special considerations are discussed for calculating the median when the number of values is even versus odd. The document encourages the viewer to subscribe to the Quantitative Specialists YouTube channel for more statistics content and courses.
quantitative aptitude, maths
applicable to
Common Aptitude Test (CAT)
Bank Competitive Exam
UPSC Competitive Exams
SSC Competitive Exams
Defence Competitive Exams
L.I.C/ G. I.C Competitive Exams
Railway Competitive Exam
University Grants Commission (UGC)
Career Aptitude Test (IT Companies) and etc.
quantitative aptitude, maths
applicable to
Common Aptitude Test (CAT)
Bank Competitive Exam
UPSC Competitive Exams
SSC Competitive Exams
Defence Competitive Exams
L.I.C/ G. I.C Competitive Exams
Railway Competitive Exam
University Grants Commission (UGC)
Career Aptitude Test (IT Companies) and etc.
Measures of Central Tendency
Requirements of good measures of central tendency
mean, median, mode
skewness of distribution
relation between mean, median,mode
Measures of Central Tendency
Requirements of good measures of central tendency
mean, median, mode
skewness of distribution
relation between mean, median,mode
This tutorial explain the measure of central tendency (Mean, Median and Mode in detail with suitable working examples pictures. The tutorial also teach the excel commands for calculation of Mean, Median and Mode.
Measures of Central Tendency-Mean, Median , Mode- Dr. Vikramjit SinghVikramjit Singh
This presentation discusses in details about different measures of central tendency like- mean, median, mode, Geometric Mean, Harmonic Mean and Weighted Mean.
A measure of central tendency (also referred to as measures of centre or central location) is a summary measure that attempts to describe a whole set of data with a single value that represents the middle or centre of its distribution.
Measure of central tendency provides a very convenient way of describing a set of scores with a single number that describes the PERFORMANCE of the group.
It is also defined as a single value that is used to describe the “center” of the data.
Lecture 3 Measures of Central Tendency and Dispersion.pptxshakirRahman10
Objectives:
Define measures of central tendency (mean, median, and mode)
Define measures of dispersion (variance and standard deviation).
Compute the measures of central tendency and Dispersion.
Learn the application of mean and standard deviation using Empirical rule and Tchebyshev’s theorem.
Measures of Central Tendency:
A measure of the central tendency is a value about which the observations tend to cluster.
In other words it is a value around which a data set is centered.
The three most common measures of central tendency are mean, median and mode.
A measure of the central tendency is a value about which the observations tend to cluster.
In other words it is a value around which a data set is centered.
The three most common measures of central tendency are mean, median and mode.
A measure of the central tendency is a value about which the observations tend to cluster.
In other words it is a value around which a data set is centered.
The three most common measures of central tendency are mean, median and mode.
A measure of the central tendency is a value about which the observations tend to cluster.
In other words it is a value around which a data set is centered.
The three most common measures of central tendency are mean, median and mode.
Why is it needed?
To summarize the data.
It provides with a typical value that gives the picture of the entire data set
Mean:
It is the arithmetic average of a set of numbers, It is the most common measure of central tendency.
Computed by summing all values in the data set and dividing the sum by the number of values in the data set Properties:
Applicable for interval and ratio data
Not applicable for nominal or ordinal data
Affected by each value in the data set, including extreme values.
Formula:
Mean is calculated by adding all values in the data set and dividing the sum by the number of values in the data set.
Median:
Mid-point or Middle value of the data when the measurements are arranged in ascending order.
A point that divides the data into two equal parts.
Computational Procedure:
Arrange the observations in an ascending order.
If there is an odd number of terms, the median is the middle value and If there is an even number of terms, the median is the average of the middle two terms.
Mode:
The mode is the observation that occurs most frequently in the data set.
There can be more than one mode for a data set OR there maybe no mode in a data set.
Is also applicable to the nominal data.
Comparison of Measures of Central Tendency in Positively Skewed Distributions:
Majority of the data values fall to the left of the mean and cluster at the lower end of the distribution: the tail is to the right Mean, median & mode are different When a distribution has a few extremely high scores, the mean will have a greater value than the median = positively skewed.
Majority of the data values fall to
the right of the mean and cluster at the upper end of the distribution= Negatively Skewed
The Roman Empire A Historical Colossus.pdfkaushalkr1407
The Roman Empire, a vast and enduring power, stands as one of history's most remarkable civilizations, leaving an indelible imprint on the world. It emerged from the Roman Republic, transitioning into an imperial powerhouse under the leadership of Augustus Caesar in 27 BCE. This transformation marked the beginning of an era defined by unprecedented territorial expansion, architectural marvels, and profound cultural influence.
The empire's roots lie in the city of Rome, founded, according to legend, by Romulus in 753 BCE. Over centuries, Rome evolved from a small settlement to a formidable republic, characterized by a complex political system with elected officials and checks on power. However, internal strife, class conflicts, and military ambitions paved the way for the end of the Republic. Julius Caesar’s dictatorship and subsequent assassination in 44 BCE created a power vacuum, leading to a civil war. Octavian, later Augustus, emerged victorious, heralding the Roman Empire’s birth.
Under Augustus, the empire experienced the Pax Romana, a 200-year period of relative peace and stability. Augustus reformed the military, established efficient administrative systems, and initiated grand construction projects. The empire's borders expanded, encompassing territories from Britain to Egypt and from Spain to the Euphrates. Roman legions, renowned for their discipline and engineering prowess, secured and maintained these vast territories, building roads, fortifications, and cities that facilitated control and integration.
The Roman Empire’s society was hierarchical, with a rigid class system. At the top were the patricians, wealthy elites who held significant political power. Below them were the plebeians, free citizens with limited political influence, and the vast numbers of slaves who formed the backbone of the economy. The family unit was central, governed by the paterfamilias, the male head who held absolute authority.
Culturally, the Romans were eclectic, absorbing and adapting elements from the civilizations they encountered, particularly the Greeks. Roman art, literature, and philosophy reflected this synthesis, creating a rich cultural tapestry. Latin, the Roman language, became the lingua franca of the Western world, influencing numerous modern languages.
Roman architecture and engineering achievements were monumental. They perfected the arch, vault, and dome, constructing enduring structures like the Colosseum, Pantheon, and aqueducts. These engineering marvels not only showcased Roman ingenuity but also served practical purposes, from public entertainment to water supply.
A Strategic Approach: GenAI in EducationPeter Windle
Artificial Intelligence (AI) technologies such as Generative AI, Image Generators and Large Language Models have had a dramatic impact on teaching, learning and assessment over the past 18 months. The most immediate threat AI posed was to Academic Integrity with Higher Education Institutes (HEIs) focusing their efforts on combating the use of GenAI in assessment. Guidelines were developed for staff and students, policies put in place too. Innovative educators have forged paths in the use of Generative AI for teaching, learning and assessments leading to pockets of transformation springing up across HEIs, often with little or no top-down guidance, support or direction.
This Gasta posits a strategic approach to integrating AI into HEIs to prepare staff, students and the curriculum for an evolving world and workplace. We will highlight the advantages of working with these technologies beyond the realm of teaching, learning and assessment by considering prompt engineering skills, industry impact, curriculum changes, and the need for staff upskilling. In contrast, not engaging strategically with Generative AI poses risks, including falling behind peers, missed opportunities and failing to ensure our graduates remain employable. The rapid evolution of AI technologies necessitates a proactive and strategic approach if we are to remain relevant.
Instructions for Submissions thorugh G- Classroom.pptxJheel Barad
This presentation provides a briefing on how to upload submissions and documents in Google Classroom. It was prepared as part of an orientation for new Sainik School in-service teacher trainees. As a training officer, my goal is to ensure that you are comfortable and proficient with this essential tool for managing assignments and fostering student engagement.
Acetabularia Information For Class 9 .docxvaibhavrinwa19
Acetabularia acetabulum is a single-celled green alga that in its vegetative state is morphologically differentiated into a basal rhizoid and an axially elongated stalk, which bears whorls of branching hairs. The single diploid nucleus resides in the rhizoid.
2024.06.01 Introducing a competency framework for languag learning materials ...Sandy Millin
http://sandymillin.wordpress.com/iateflwebinar2024
Published classroom materials form the basis of syllabuses, drive teacher professional development, and have a potentially huge influence on learners, teachers and education systems. All teachers also create their own materials, whether a few sentences on a blackboard, a highly-structured fully-realised online course, or anything in between. Despite this, the knowledge and skills needed to create effective language learning materials are rarely part of teacher training, and are mostly learnt by trial and error.
Knowledge and skills frameworks, generally called competency frameworks, for ELT teachers, trainers and managers have existed for a few years now. However, until I created one for my MA dissertation, there wasn’t one drawing together what we need to know and do to be able to effectively produce language learning materials.
This webinar will introduce you to my framework, highlighting the key competencies I identified from my research. It will also show how anybody involved in language teaching (any language, not just English!), teacher training, managing schools or developing language learning materials can benefit from using the framework.
Francesca Gottschalk - How can education support child empowerment.pptxEduSkills OECD
Francesca Gottschalk from the OECD’s Centre for Educational Research and Innovation presents at the Ask an Expert Webinar: How can education support child empowerment?
Palestine last event orientationfvgnh .pptxRaedMohamed3
An EFL lesson about the current events in Palestine. It is intended to be for intermediate students who wish to increase their listening skills through a short lesson in power point.
Model Attribute Check Company Auto PropertyCeline George
In Odoo, the multi-company feature allows you to manage multiple companies within a single Odoo database instance. Each company can have its own configurations while still sharing common resources such as products, customers, and suppliers.
Introduction to AI for Nonprofits with Tapp NetworkTechSoup
Dive into the world of AI! Experts Jon Hill and Tareq Monaur will guide you through AI's role in enhancing nonprofit websites and basic marketing strategies, making it easy to understand and apply.
7. Example: 1, 2, 3, 4, 5, 6
Two middle scores: 3, 4
To find the median, take the average
of the two middle scores: (3+4)/2 =
3.5
Median = 3.5
Quantitative
Specialists
8. Odd N: When there are an odd number of
values, the median is the middle
score
(1, 2, 3, 4, 5; N=5) median = 3
Even N: When there are an even number
of values, the median is equal to the
average of the two middle scores
(1, 2, 3, 4, 5, 6; N=6) median = 3.5
Quantitative
Specialists
9. Prior to calculating the median, be
sure that the numbers are ordered
from smallest to largest (don’t
pick the middle number of a set of
numbers if they are not first
ordered)
Example: 2, 3, 1, 3, 1, 6
Reordered: 1, 1, 2, 3, 3, 6
Median = 2.5
Quantitative
Specialists
10. Mean = the arithmetic average
Mean:
Where µ = the population mean, ΣX is
the sum of the variable X (add the
values of X together), and N is the
total number of values
N
X
Quantitative
Specialists
11. Example
X = 1, 2, 3, 4, 5
N = 5
Mean = 3
3
5
15
5
54321
N
X
Quantitative
Specialists
12. YouTube Channel: Quantitative Specialists
Subscribe to our channel at:
https://www.youtube.com/statisticsinstructor
(typing “quantitative specialists” in the search box will also find
us). New videos uploaded regularly.
Comprehensive statistics courses available on
Udemy.com. Search for Quantitative Specialists (use
offer SS50 for a discount on any of our Statistics/SPSS
courses with our thanks for viewing us on slideshare)
Statistical consultation questions? Contact us at:
quantitativespecialists@gmail.com