Downloaded 348 times


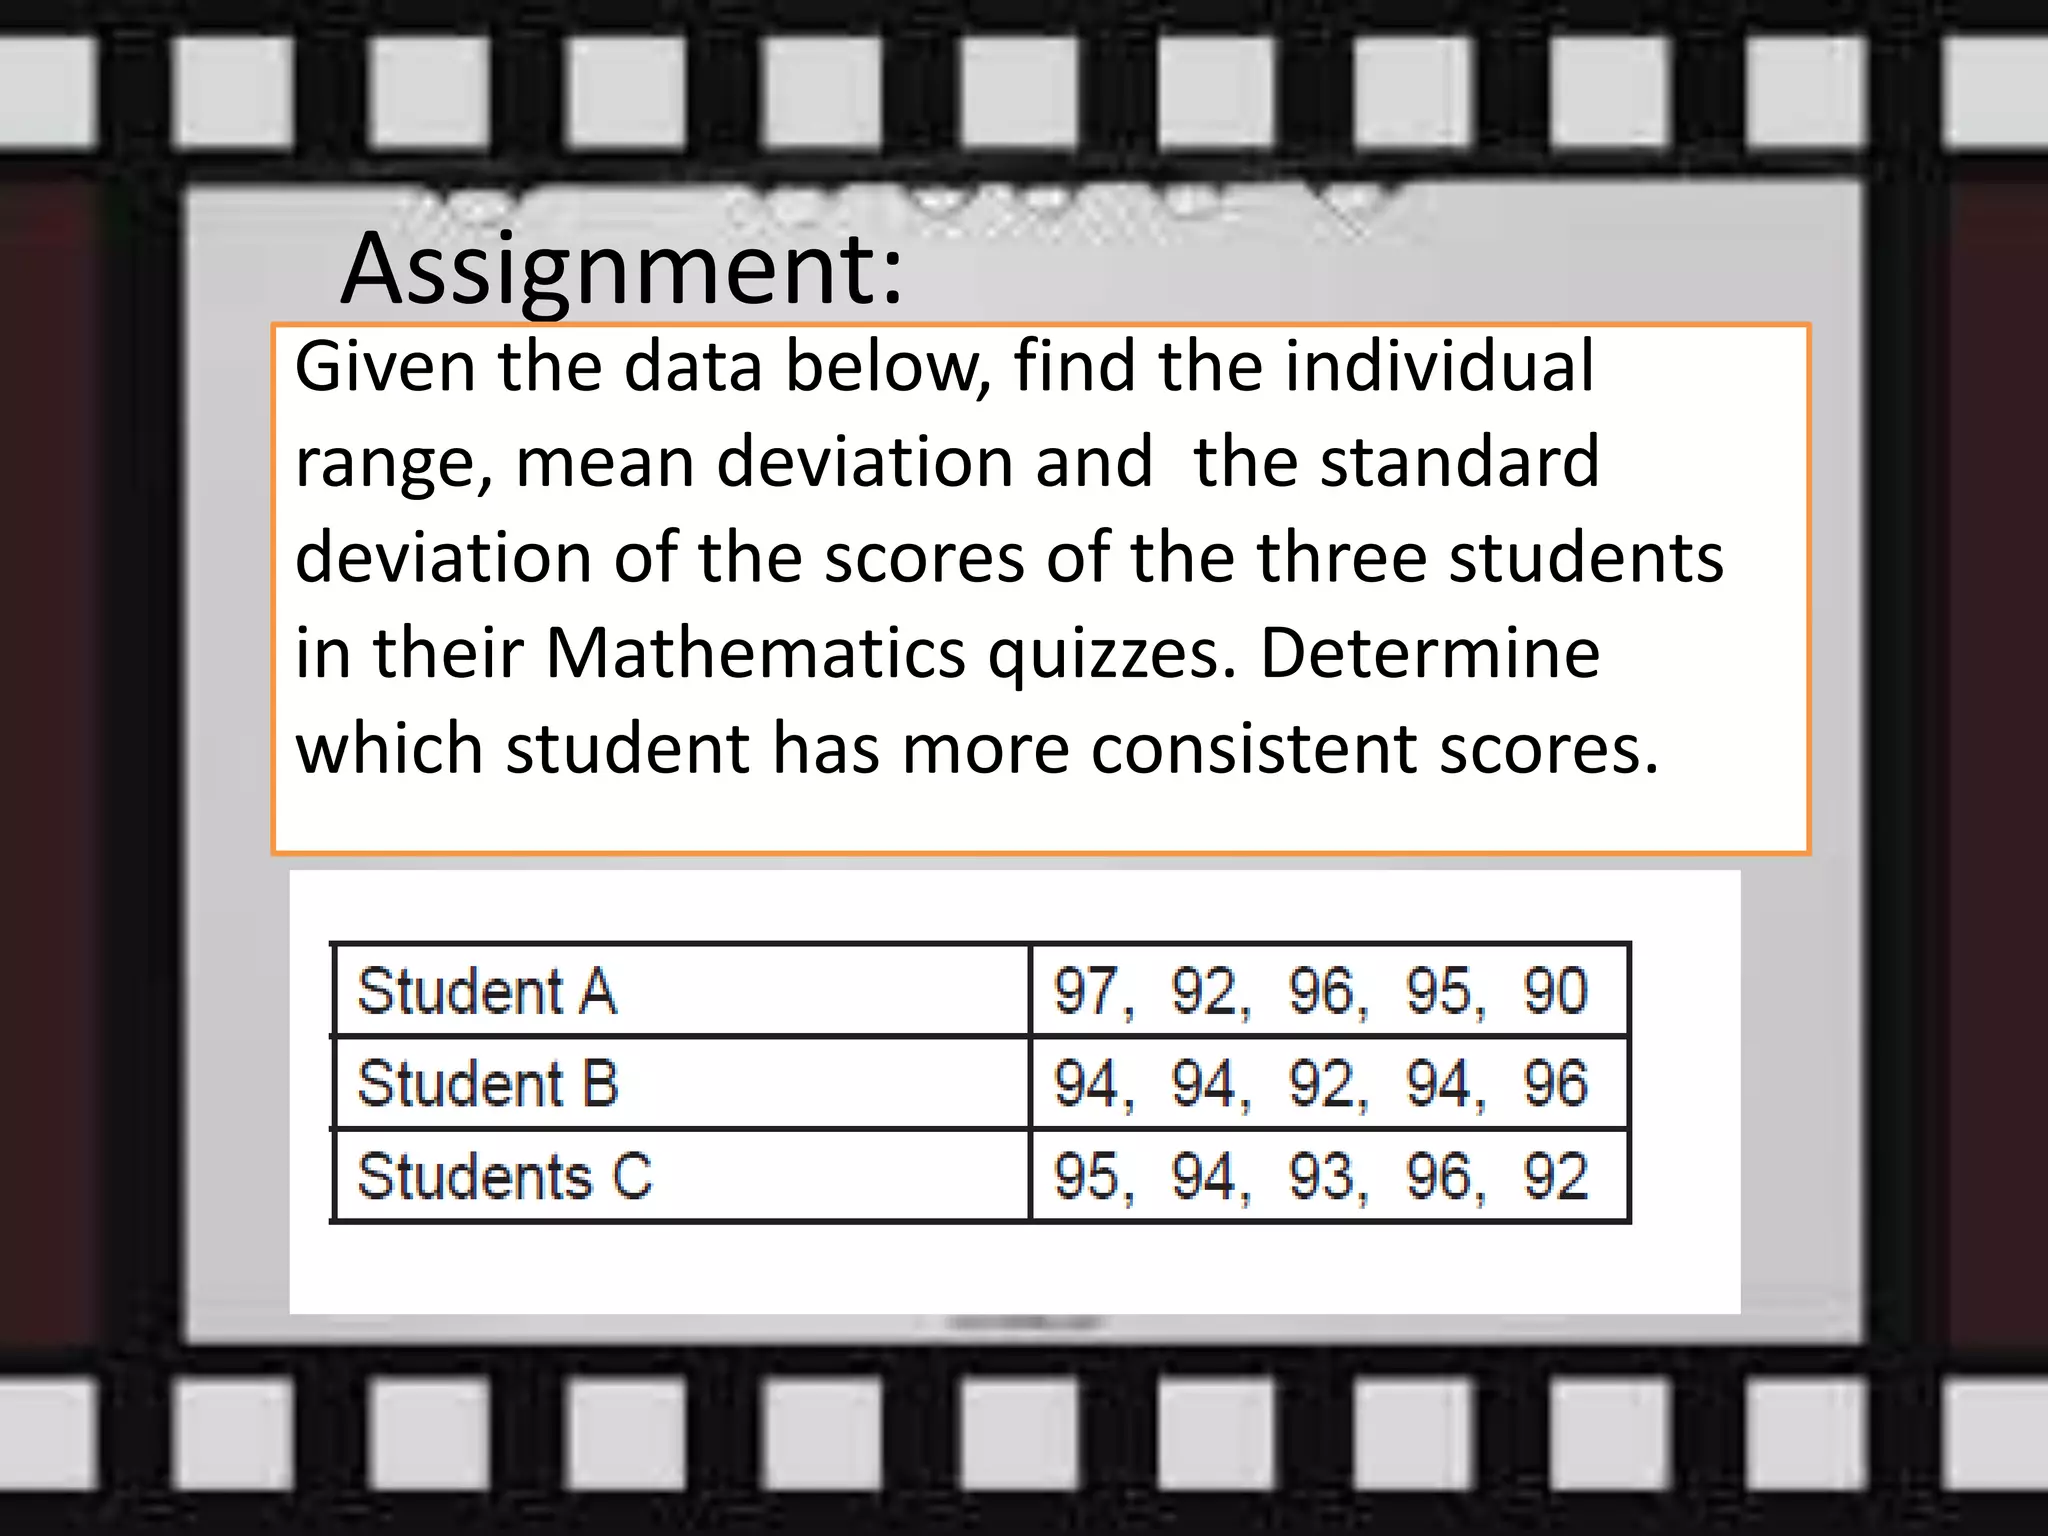

Here are the scores of the three students in their Mathematics quizzes: Student A: 75, 80, 85, 90 Student B: 70, 72, 78, 82 Student C: 65, 68, 73, 77 Range of Student A: 90 - 75 = 15 Range of Student B: 82 - 70 = 12 Range of Student C: 77 - 65 = 12 Mean Deviation of Student A: |75 - 82.5| + |80 - 82.5| + |85 - 82.5| + |90 - 82.5| = 17.5 Mean Deviation of Student B: |70 - 76| + |72 - 76| + |