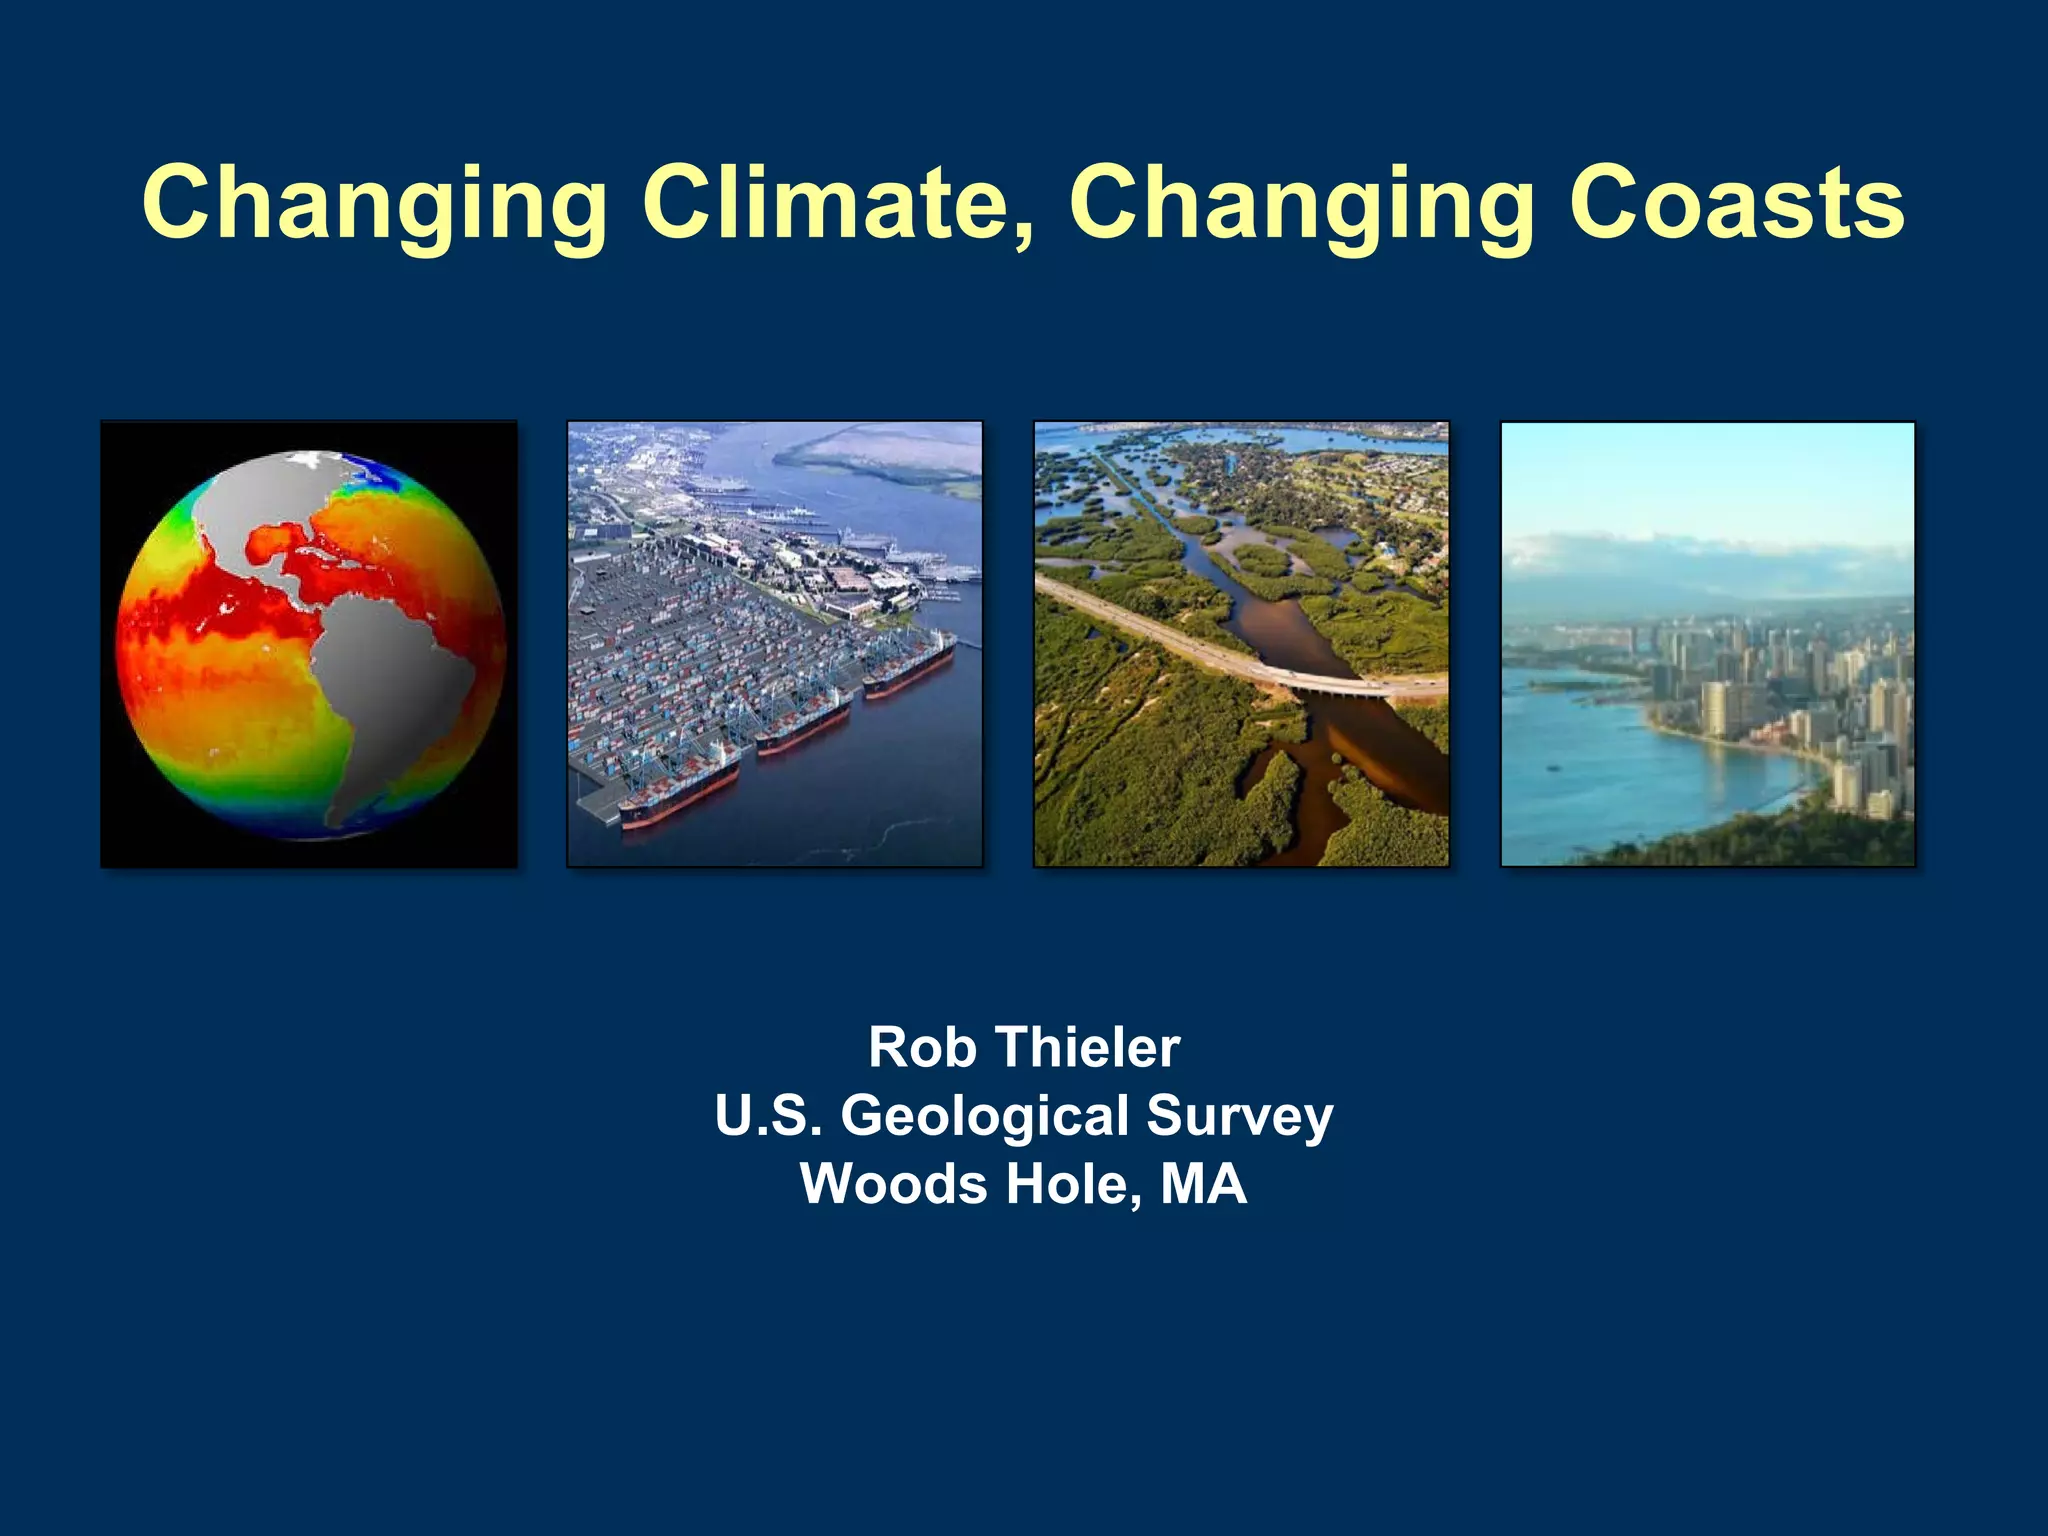
Changing Climate, Changing Coasts

Rob Thieler
U.S. Geological Survey
Woods Hole, MA
Outline
• Scientific and management dimensions of sealevel change
• Results and implications of recent sea-level rise
assessments
• Options and potential impacts of different
shoreline adaptation strategies
• How one town is starting to address the issue
The U.S. Coastal Crisis – Coastal population
and development are increasingly
vulnerable to coastal hazards

• Erosion affects all 30 coastal states
• 60-80% of coast is eroding
• Erosion caused by diverse, complex
processes

• Coastal populations have doubled
• >50% live along coasts
• Infrastructure about $9 trillion
We need better science* to prepare our local responses to
climate change, especially in our coastal areas.
(David Carter, Delaware Coastal Management)

*science = better understanding of processes + better situation awareness
Key Principles Regarding Sea-level Rise
• There is no debate over sea-level rise
When the climate warms, oceans increase in volume and
land-based ice melts

• Attribution of sea-level rise is largely irrelevant
For example, if the world stopped emitting GHGs tomorrow,
sea level would continue to rise for several centuries

• The major questions are how much, and how fast?
The answers depend in part on our future emission
pathways, and the future behavior of large ice sheets
Land water
storage changes

Ocean currents change
Land can
rise or sink

Warm water
expands

Ice melts into
the ocean

(IPCC, 2001)
Past, Current and Projected Global
Temperature
The last 10,000 years have been ideal for
the development of human societies.
This has been a unique time during
which climate varied very little and
enabled humankind to flourish.
Sea-level rise rates since the Last Glacial
Maximum

mwp-Ib
Global delta initiation
(Stanley and Warne, 1994)

U.S. Atlantic, U.K.
wetland initiation;
barrier island stability
(Shennan and Horton, 2002;
Engelhart et al., 2009)

Rate of SLR (mm/yr)

mwp-Ia

Thousands of 14C years before present
(SLR rate based on Fairbanks, 1989; ice extent from Dyke, 2004)
“Projections”
(Rahmstorf, 2007)

“Geologic past”
(Fairbanks, 1989;
Horton et al. 2009)

“Instrumental record”
(Church and White, 2006)

Years before present

Rate of SLR (mm/yr)

Past, present, and potential future rates of
sea-level rise
Projected Sea-level Rise
Recent expert assessment
(n=90 experts)

0.4-0.6 m for RCP 3-PD
0.7-1.2 m for RCP 8.5

IPCC AR5

(Horton et al., 2013)

(modified after Rahmstorf, 2007; AR4 data from Bindoff, 2007)
(courtesy Aslak Grinsted; AR5 projections from IPCC, 2013)
Mid-Atlantic Assessment of Potential
Dynamic Coastal Responses to Sea-level Rise

Bluff erosion

Overwash

Island Breaching

(Gutierrez et al., 2009)

Threshold Crossing
Dynamic Equilibrium of Beaches
Sediment supply

Relative sealevel change

Location and
shape of the
beach

Wave energy
(after Pilkey and Thieler, 1992)
Common responses to an eroding coastline
Hard stabilization
• Seawalls, groins,
breakwaters, etc.

Soft stabilization
• Beach nourishment

Relocation or retreat
• Move back from
eroding shorelines

(after Pilkey and Thieler, 1992)
Hard stabilization
• Advantages
• Most dependable way to save
beachfront property

• Disadvantages
•
•
•
•

Degrades the recreational beach
Reduces beach access
Costly
Unsightly

(after Pilkey and Thieler, 1992)
Modes of beach loss by seawalls
Placement
• Seawall built on
the beach

Passive
• Beach continues to
retreat and
narrows in front of
the seawall

Active
(after Pilkey and Thieler, 1992)

• Seawall directly
causes erosion
Two alternative scenarios for longterm shoreline change

(Pilkey and Thieler, 1992)
Related impacts of hard stabilization
Changes to alongshore
sediment transport

Reduction in sediment
delivery to beach system
Informing Decisions in a Changing Climate
National Research Council (2009)

The end of “Climate Stationarity” requires that
organizations and individuals alter their standard
practices and decision routines to take climate
change into account. Scientific priorities and
practices need to change so that the scientific
community can provide better support to
decision makers in managing emerging climate
risks.

• Decision makers must expect to be surprised
because of the nature of climate change and
the incompleteness of scientific
understanding of its consequences.

• An uncertainty management framework
should be used because of the inadequacies
of predictive capability.
Sea-level rise impacts: A multivariate problem with
uncertainties everywhere

Driving
Forces
Climate Change
&
Sea Level
Rise

Groundwater
Impact

Habitat Loss

Wetland Loss

Physical
& Biological
Processes

Potential
Impacts
Coastal Erosion

Initial
Conditions

Safety
Inundation

Management
Decisions
Some things to consider…
• Options that maintain future flexibility
• Magnitude and timing of future climate change and our responses to it are
uncertain

• Holistic examination of potential impacts
• Geologic, biologic, economic, social...
• Expectations of your coastal zone (resources, tourism, aesthetics,
navigation, etc.)

• Time horizon
• How long should something last? Forever? Until you have a better plan to
address the problem? The next big storm? Two feet of sea-level rise?

• Risk tolerance
• Scale with size, value, time
• Implications of failure or over-planning/building

• Protocols for what happens after large events
• Because there will be a "next time"
Understanding Where We Are, and
Where We Could Go
www.falmouthmass.us/depart.php?depkey=coastal
Sediment Source Area
Longshore Transport
Eastern Limit of Moraine
0

1

2

kilometers

Falmouth South Shore
USGS 1995 photography

3
Groins

Rapid
erosion

Jetties

Groins,
overwash

Armored
bluffs

Falmouth South Shore
USGS 1995 photography

0

1

2

3

kilometers

About 50% of south coast parcels are armored. Half are Town parcels.
There are 70 groins, 10 jetties, and 94 revetments on the south coast.
~1950s

Nobska Point

(NOAA)

(courtesy RJNick, www.noticetoairmen.com)

2000s
Falmouth Heights, 1897

Falmouth Heights, 2000
Falmouth South Shore Erosion Rates
0.5

Erosion Rate (ft/yr)

0.0
-0.5
-1.0
-1.5
-2.0
-2.5
-3.0
1845-1890

1800s-1948

Year Interval

1975-1994
Green Pond
Shoreline Change
Since 1845

~130 ft
~550 ft

• Sediment supply
decreased
• Uplands armored,
beaches narrowed
• Barrier has
migrated into the
pond
Vision for Falmouth’s Coast
(for the next 50-100 years)
• Beaches and dunes wide enough for protection from storms and public
access and use.
• Sufficient sand in the coastal system.
• Sustained and enhanced water quality, habitat and fisheries resources.
• A minimum of hard structures (groins, seawalls, etc.).
• Public infrastructure will be relocated from the immediate coast.
• A proactive approach to shoreline management to prevent problems and
provide a response protocol when shoreline damage occurs.
Achieving the Vision
for Falmouth’s Coast
• Acquire coastal land for open space.
• Move or change vulnerable public infrastructure. Plan future
infrastructure (e.g., roads, sewers) wisely.
• Conduct beach nourishment experiments at key “source” locations.
• Remove unnecessary, hazardous, or damaging coastal armoring
structures.
• Create effective sand management systems.
• Improve regulations to protect coastal systems and beaches.
• Encourage protection of valuable coastal assets such as unarmored
bluffs.
Summary
• The coast as we know it today is a product of sea-level
rise
• Major changes are coming to the coast, ecosystems,
and resources
• Future sea-level rise is a certain impact
•

We have already made a commitment to several centuries of rise

• Future sea-level rise is an uncertain impact
•
•

Rates and magnitudes poorly constrained
Societal response unknown

• Informed preparation is important

Rob Thieler, Changing Climate, Changing Coasts

  • 1.
    Changing Climate, ChangingCoasts Rob Thieler U.S. Geological Survey Woods Hole, MA
  • 2.
    Outline • Scientific andmanagement dimensions of sealevel change • Results and implications of recent sea-level rise assessments • Options and potential impacts of different shoreline adaptation strategies • How one town is starting to address the issue
  • 3.
    The U.S. CoastalCrisis – Coastal population and development are increasingly vulnerable to coastal hazards • Erosion affects all 30 coastal states • 60-80% of coast is eroding • Erosion caused by diverse, complex processes • Coastal populations have doubled • >50% live along coasts • Infrastructure about $9 trillion
  • 4.
    We need betterscience* to prepare our local responses to climate change, especially in our coastal areas. (David Carter, Delaware Coastal Management) *science = better understanding of processes + better situation awareness
  • 5.
    Key Principles RegardingSea-level Rise • There is no debate over sea-level rise When the climate warms, oceans increase in volume and land-based ice melts • Attribution of sea-level rise is largely irrelevant For example, if the world stopped emitting GHGs tomorrow, sea level would continue to rise for several centuries • The major questions are how much, and how fast? The answers depend in part on our future emission pathways, and the future behavior of large ice sheets
  • 6.
    Land water storage changes Oceancurrents change Land can rise or sink Warm water expands Ice melts into the ocean (IPCC, 2001)
  • 7.
    Past, Current andProjected Global Temperature The last 10,000 years have been ideal for the development of human societies. This has been a unique time during which climate varied very little and enabled humankind to flourish.
  • 8.
    Sea-level rise ratessince the Last Glacial Maximum mwp-Ib Global delta initiation (Stanley and Warne, 1994) U.S. Atlantic, U.K. wetland initiation; barrier island stability (Shennan and Horton, 2002; Engelhart et al., 2009) Rate of SLR (mm/yr) mwp-Ia Thousands of 14C years before present (SLR rate based on Fairbanks, 1989; ice extent from Dyke, 2004)
  • 9.
    “Projections” (Rahmstorf, 2007) “Geologic past” (Fairbanks,1989; Horton et al. 2009) “Instrumental record” (Church and White, 2006) Years before present Rate of SLR (mm/yr) Past, present, and potential future rates of sea-level rise
  • 10.
    Projected Sea-level Rise Recentexpert assessment (n=90 experts) 0.4-0.6 m for RCP 3-PD 0.7-1.2 m for RCP 8.5 IPCC AR5 (Horton et al., 2013) (modified after Rahmstorf, 2007; AR4 data from Bindoff, 2007) (courtesy Aslak Grinsted; AR5 projections from IPCC, 2013)
  • 11.
    Mid-Atlantic Assessment ofPotential Dynamic Coastal Responses to Sea-level Rise Bluff erosion Overwash Island Breaching (Gutierrez et al., 2009) Threshold Crossing
  • 12.
    Dynamic Equilibrium ofBeaches Sediment supply Relative sealevel change Location and shape of the beach Wave energy (after Pilkey and Thieler, 1992)
  • 13.
    Common responses toan eroding coastline Hard stabilization • Seawalls, groins, breakwaters, etc. Soft stabilization • Beach nourishment Relocation or retreat • Move back from eroding shorelines (after Pilkey and Thieler, 1992)
  • 14.
    Hard stabilization • Advantages •Most dependable way to save beachfront property • Disadvantages • • • • Degrades the recreational beach Reduces beach access Costly Unsightly (after Pilkey and Thieler, 1992)
  • 15.
    Modes of beachloss by seawalls Placement • Seawall built on the beach Passive • Beach continues to retreat and narrows in front of the seawall Active (after Pilkey and Thieler, 1992) • Seawall directly causes erosion
  • 16.
    Two alternative scenariosfor longterm shoreline change (Pilkey and Thieler, 1992)
  • 17.
    Related impacts ofhard stabilization Changes to alongshore sediment transport Reduction in sediment delivery to beach system
  • 18.
    Informing Decisions ina Changing Climate National Research Council (2009) The end of “Climate Stationarity” requires that organizations and individuals alter their standard practices and decision routines to take climate change into account. Scientific priorities and practices need to change so that the scientific community can provide better support to decision makers in managing emerging climate risks. • Decision makers must expect to be surprised because of the nature of climate change and the incompleteness of scientific understanding of its consequences. • An uncertainty management framework should be used because of the inadequacies of predictive capability.
  • 19.
    Sea-level rise impacts:A multivariate problem with uncertainties everywhere Driving Forces Climate Change & Sea Level Rise Groundwater Impact Habitat Loss Wetland Loss Physical & Biological Processes Potential Impacts Coastal Erosion Initial Conditions Safety Inundation Management Decisions
  • 20.
    Some things toconsider… • Options that maintain future flexibility • Magnitude and timing of future climate change and our responses to it are uncertain • Holistic examination of potential impacts • Geologic, biologic, economic, social... • Expectations of your coastal zone (resources, tourism, aesthetics, navigation, etc.) • Time horizon • How long should something last? Forever? Until you have a better plan to address the problem? The next big storm? Two feet of sea-level rise? • Risk tolerance • Scale with size, value, time • Implications of failure or over-planning/building • Protocols for what happens after large events • Because there will be a "next time"
  • 21.
    Understanding Where WeAre, and Where We Could Go www.falmouthmass.us/depart.php?depkey=coastal
  • 22.
    Sediment Source Area LongshoreTransport Eastern Limit of Moraine 0 1 2 kilometers Falmouth South Shore USGS 1995 photography 3
  • 23.
    Groins Rapid erosion Jetties Groins, overwash Armored bluffs Falmouth South Shore USGS1995 photography 0 1 2 3 kilometers About 50% of south coast parcels are armored. Half are Town parcels. There are 70 groins, 10 jetties, and 94 revetments on the south coast.
  • 24.
    ~1950s Nobska Point (NOAA) (courtesy RJNick,www.noticetoairmen.com) 2000s
  • 25.
  • 26.
    Falmouth South ShoreErosion Rates 0.5 Erosion Rate (ft/yr) 0.0 -0.5 -1.0 -1.5 -2.0 -2.5 -3.0 1845-1890 1800s-1948 Year Interval 1975-1994
  • 27.
    Green Pond Shoreline Change Since1845 ~130 ft ~550 ft • Sediment supply decreased • Uplands armored, beaches narrowed • Barrier has migrated into the pond
  • 28.
    Vision for Falmouth’sCoast (for the next 50-100 years) • Beaches and dunes wide enough for protection from storms and public access and use. • Sufficient sand in the coastal system. • Sustained and enhanced water quality, habitat and fisheries resources. • A minimum of hard structures (groins, seawalls, etc.). • Public infrastructure will be relocated from the immediate coast. • A proactive approach to shoreline management to prevent problems and provide a response protocol when shoreline damage occurs.
  • 29.
    Achieving the Vision forFalmouth’s Coast • Acquire coastal land for open space. • Move or change vulnerable public infrastructure. Plan future infrastructure (e.g., roads, sewers) wisely. • Conduct beach nourishment experiments at key “source” locations. • Remove unnecessary, hazardous, or damaging coastal armoring structures. • Create effective sand management systems. • Improve regulations to protect coastal systems and beaches. • Encourage protection of valuable coastal assets such as unarmored bluffs.
  • 30.
    Summary • The coastas we know it today is a product of sea-level rise • Major changes are coming to the coast, ecosystems, and resources • Future sea-level rise is a certain impact • We have already made a commitment to several centuries of rise • Future sea-level rise is an uncertain impact • • Rates and magnitudes poorly constrained Societal response unknown • Informed preparation is important