1. The document summarizes research on the direct and indirect causes of beach erosion in Negril, Jamaica and the role of climate change. 2. Direct causes include hurricanes, storm surges, and sea level rise exacerbated by climate change, which are expected to increase in frequency and intensity. 3. Indirect causes include degradation of coral reefs and shoreline vegetation from climate change impacts and human activities, which reduce natural protections against erosion.
Seawater Intrusion Vulnerability Assessment of a Coastal Aquifer: North Coast...IJERA Editor
Groundwater pollution in the north coast of Mombasa is not only from surface sources but also from the
intrusion of seawater via the Indian Ocean and creeks. This study assessed the vulnerability of the coastal aquifer
to seawater intrusion using GALDIT index overlay method with the aid of GIS. Thematic maps of six major
factors affecting seawater intrusion were prepared, and given appropriate weightages and ratings. These maps
were overlaid, spatially analyzed to produce vulnerability maps and described based on low, moderate or high
vulnerabilities. The results revealed a significant increase in percentage land cover for low vulnerability areas
and a slight increase for high vulnerability regions between the pre-rains and the peak of raining season. The
outcomes of this study provide useful insights on effective groundwater management for the study area.
After attending this lesson, the user would be able to understand the nature and causative factors of landslides, their characteristics, classifications, triggering mechanisms, and effects. The methods of controlling the effects of landslides, and avoiding their menace are also highlighted. Disaster management methods are to be adopted to mitigate the never ending natural hazards. This lesson is an important topic in disaster management.
Jayantha Obeysekera
This session will discuss the Southeast Florida Regional Climate Change Compact agreed to by Palm Beach, Broward, Miami-Dade and Monroe counties in SE Florida, and their partnering with the
South Florida Water Management District. The 5.6 million residents of the four counties exceed the population of 30 states and represent 30 percent of Florida’s population, and are situated in
one of the nation’s areas most vulnerable to climate change. The session will detail the Regional Climate Change Compact’s objectives,
its accomplishments to date and the ongoing development of a regional climate action plan.
A Review on the Sedimentation Problem in River Basinsijtsrd
River sedimentation is a global concern evidenced by a number of studies conducted. Now, that climate change is being experienced the rapid changes on the river landscape is manifestly observed. As unveiled, natural evolution of landscape and human activities are the two main factors affecting this phenomenon. Different methods of determination of the volume of sediments transported some are employed. Some studies used classic methods utilizing sophisticated apparatus while others artificial intelligence mode of sediment transport prediction. Celeste A. De Asis "A Review on the Sedimentation Problem in River Basins" Published in International Journal of Trend in Scientific Research and Development (ijtsrd), ISSN: 2456-6470, Volume-5 | Issue-1 , December 2020, URL: https://www.ijtsrd.com/papers/ijtsrd37968.pdf Paper URL : https://www.ijtsrd.com/engineering/environment-engineering/37968/a-review-on-the-sedimentation-problem-in-river-basins/celeste-a-de-asis
Climate Change and Maritime Sector Essay Sampleessayprime
Climate change can be described as a significant and a long lasting transformation in the
statistical distribution of weather patterns over a period of time that range from decades to a
million years (Daufresnea, Lengfellnera and Sommera, 2009). The change may be in terms of
average weather conditions or in the overall distribution of weather around average
circumstances (Durant and et.al., 2007). The climate of earth has been undergoing many changes
throughout the course of history. Most of the climatic changes are attributed to small variations
in the orbit of earth that brings significant alteration in the amount of solar energy received by
planet. However the current climatic change has been on account of human induced variations
that have been proceeding at an unprecedented rate in the past 1300 years (Millien and et.al.,
2006). These climatic changes have posed a huge impact on the overall ecosystem as well as
many economic activities. The activity carried out by maritime sector happens to be one such
area which is required to be given a due emphasis.
Disasters:Risk & Management_Dr R K Sood, Himachal Institute of Public Admini...India Water Portal
What is a disaster and a hazard? Which areas lie in the vulnerability and risk zones in the state of Himachal Pradesh? A look at how the climate change too has added another dimension to this aspect.
Dr. Cynthia Rosenzweig, Senior Research Scientist, NASA Goddard Institute for Space Studies Senior Research Scientist, Earth Institute at Columbia University Co-Chair Mayor Bloomberg’s Climate Change Commission Co-Director Urban Climate Change Research Network (UCCRN); National Institute for Coastal & Harbor Infrastructure, John F. Kennedy Center, Boston, Nov. 12, 2013: "The Triple Threat of Rising Sea Levels, Extreme Storms and Aging Infrastructure: Coastal Community Responses and The Federal Role" See http://www.nichiusa.org or http://www.nichi.us
Disaster Management Flooding and Landslidesonika patel
Management of disaster on the basis of Guidelines framework, of landslide & Flooding with the respective case study and flood forecasting and management
Floods have the greatest damage potential when compared to the other natural disasters, over the environment. Floods are also considered to be both social and economic disasters. This module highlights the details of floods as natural hazards.
Assises Nationale du Numérique - 1ère Édition 09052016
Djalil Assouma, Directeur Général de Bénin Télécoms Infrastructure fait une présentation sur les grands chantiers dans le secteur des télécommunications au Bénin.
Gigantic submarine landslides are among the most energetic events on the Earth surface. During the
Late Pleistocene the Mediterranean Sea was the scenario of a 9 number of such events, some of whose
geological fi ngerprints are the 500 km3 mass transport deposit SL2 at the Nile delta fan (dated at ca. 110
ka BP) and the Herodotus Basing Megaturbidite (HBM, a 400 km3 deposit dated at ca. 27.1 ka BP). This
paper presents an exploratory study on the tsunamigenic potential of these slides by using a numerical
model based on the 2D depth-averaged non-linear barotropic shallow water equations.
Gigantic submarine landslides are among the most energetic events on the Earth surface. During the
Late Pleistocene the Mediterranean Sea was the scenario of a 9 number of such events, some of whose
geological fi ngerprints are the 500 km3 mass transport deposit SL2 at the Nile delta fan (dated at ca. 110
ka BP) and the Herodotus Basing Megaturbidite (HBM, a 400 km3 deposit dated at ca. 27.1 ka BP).
1. 1
Direct and indirect causes of recent beach
erosion in Negril, Jamaica, and the role of
climate change
Chad Morris and Christopher G. Fletcher1
Department of Geography and Environmental Management, University of
Waterloo, Ontario, Canada.
1
Corresponding author address: Christopher G. Fletcher, Department of Geography and Environmental
Management, University of Waterloo, 200 University Ave W, Waterloo, ON, N2L 3G1
E-mail: chris.fletcher@uwaterloo.ca
2. 2
Abstract
Beach erosion presents a serious ongoing threat to coastal communities, by
increasing vulnerability to natural hazards such as tropical storms, and by threatening
economies that are dependent on the coastal landscape for tourism and fisheries. This
study presents a review of the direct and indirect factors influencing beach erosion in
Negril, Jamaica, and the expected impact of climate change on each factor. Hurricanes
and storm surges are the primary direct factors, physically removing sediment from the
beach through enhanced wave action. The frequency and intensity of hurricanes is
expected to increase under climate change, as is the impact of storm surges due to sea
level rise. Coral reefs and shoreline vegetation are the primary indirect factors, acting as
natural barriers to reduce the intensity with which waves erode the shore. Climate
change presents a significant threat to coral reefs, mainly through increasing the
incidence of disease outbreaks. While vegetation may also respond to climate change,
beach management practices, such as vegetation removal for aesthetic purposes, currently
poses the largest threat. These findings suggest that climate change in the Caribbean in
general, and in Negril in particular, significantly increases vulnerability in coastal
communities by increasing the frequency of conditions that are favorable for beach
erosion.
3. 3
1. Introduction
Coastal regions are among the most physically dynamic locations in the world, and the
most vulnerable to climate change (Cambers, 2009). Beach erosion (the recession of the
shoreline, either permanently or semi-permanently, resulting from the removal of
sediment), poses a major threat to the geophysical landscape, and to the socio-economic
wellbeing of coastal communities. Negril, Jamaica is one such community, and provides
an important case study to characterize the effects of beach erosion occurring in response
to climate change. Negril has a predisposition to high rates of beach erosion because its
location in the Caribbean is prone to severe hurricanes and tropical cyclones, has high
rates of degraded vegetation and coral reefs, consistently high temperatures, and
topography susceptible to changes in wind and waves (Cambers, 2009). The city also has
significant socio-economic vulnerability, since large numbers of its population are
engaged in tertiary (tourism) and primary (fishing, agriculture) industries, heavily
dependent upon limited natural resources (Cambers 2009; Hyman, 2013). Furthermore,
limited economic resources are available for mitigation and recovery. Since 82 percent
of the country’s population live within 5 km of the coast (UNEP, 2010), beach erosion is
a major concern not only for the tourism and fishing industries, but for the entire local
population.
The Partnership for Canadian-Caribbean Climate Change Adaptation (ParCA)
conducted interviews with citizens of Negril employed in tourism, and found that beach
erosion was their number one concern related to climate change. Climate change can
affect coastal regions in many ways; however, it is the beach erosion accrued from a
4. 4
changing global climate that is believed to pose the most significant threat to Jamaica’s
tourism, and thus to the economic prosperity and stability of island communities.
a. Beach erosion monitoring and modelling
Historically, beach erosion has been monitored through satellite imagery, aerial
photography, and National Oceanographic Service Topographic sheets (NOS T-sheets).
These data sources must be interpreted carefully as beaches are constantly eroding and
accruing simultaneously (Robinson et al., 2012). These methods are also not without
limitations: reliable aerial photography is only available as far back as the 1940s, and
while NOS T-sheets date back to the mid 19th Century, they are the least reliable of the
four methods (Zhang, Douglas, Leatherman., 2004).
Modelling techniques are useful for gaining better understanding of the key
physical processes contributing to beach erosion. A frequently-cited model for measuring
beach erosion is the Bruun Model, which equates the amount of erosion caused by rises
in sea level (Robinson et al., 2012; Leatherman et al., 2000; UNEP, 2010; Zhang et al.,
2004). The Bruun Rule equation is given by (all units are metres)
R = S ( L / ( B + h) ),
where R is the amount of recession, S is the vertical rise in sea-level, L is the width of the
shore face to the closure depth, h is the water depth at the closure depth, and B is the
height of the berm or highest part of the beach (Robinson et al., 2012). The Bruun Rule is
still applied to this day, however it is not without controversy. Critics claim it is over-
simplified for the complexity of beach erosion, and relying on outdated or inaccurate
assumptions (Cooper & Pilkey, 2004). It doesn't account for shoreline accretion in
addition to erosion, it assumes that erosion is solely caused by wave activity when it is
5. 5
now known that bottom currents associated with storms also cause erosion, and implies
that slope does not affect erosion rates when it is now known that gently sloping plains
retreat faster than steep slopes (Cooper & Pilkey, 2004). The continued use of the Bruun
Model in erosion studies are suggested to be the result of its simplicity, the fact that is in
widespread use, the positive advocacy from some scientists, and most importantly a
lacking viable alternative (Cooper & Pilkey, 2004). However, the accuracy of the Bruun
Rule can be mathematically verified under certain conditions - most importantly scale
(Zhang et al., 2004). When applied on a small scale (e.g. geographically small regions or
measuring small changes in sea-level rise) the Bruun Model can still be effective in
accurately portraying beach erosion (Zhang et al., 2004).
b. Recent trends
Over the period 1968 to 2006 in Negril, linear (background) beach erosion rates of 0.23-
1.0 m per year have been measured using aerial photography and satellite
imagery (UNEP, 2010; Robinson et al., 2012). Across the Caribbean, as detailed in
Table 1, erosion rates vary from island to island, from a maximum of 1.26 m per year in
Anguilla, to a minimum of 0.23 m per year in Montserrat (Cambers, 2009). The exact
rates of erosion at a particular beach are a complex function of erosion and accretion,
with each operating over a range of timescales from hours to centuries. However, several
studies have concluded that beach erosion is a significant and immediate problem, that is
worsening with time (UNEP, 2010; Robinson et al., 2012; IPCC 2014; Cambers, 2009;
Scott, Simpson, Sim 2012).
This prevailing viewpoint, coupled with the survey respondents’ concerns
regarding beach erosion, provides a compelling motivation to study beach erosion and its
6. 6
links to climate change. In this article we provide a comprehensive review of the
physical factors influencing beach erosion rates, and the impact of climate change on
those factors. Our findings demonstrate that while many naturally-occurring processes
contribute to beach erosion, the principle threat from climate change is that it amplifies
the effects of natural, and human-induced, beach erosion.
2. Methodology
To gauge the perceptions of climate change in Jamaica, 94 individuals involved in the
tourism industry were interviewed as by ParCA researchers in June 2013. Respondents
were asked open-ended questions and encouraged to discuss freely which aspects of
climate change most concerned them. Of the 94 respondents, 46 (49%) mentioned
climate-related topics specifically in their interviews, and these responses were
categorized by topic and recorded in Table 2. Beach erosion was the leading concern,
with 34% of respondents highlighting it as the most significant factor.
A hierarchical weighting was applied to prioritize our source literature based on
the geographic location where available published studies were based. The most weight
was placed on data sources based in the immediate local area around Negril, followed in
order of decreasing weight by national (Jamaica), regional (Caribbean), and lastly global
scale sources. The factors influencing beach erosion are categorized as either direct, or
indirect based on their influence on the rate of erosion. Direct factors (e.g., hurricanes,
storm surges) are the processes which actively erode beaches through wave energy.
Indirect factors (e.g., coral reef and vegetation loss), on the other hand, contribute to
beach erosion by increasing the exposure of the shoreline to erosion.
7. 7
3. Direct contributing factors
a. Hurricanes
Hurricanes are quantifiably the most significant erosion-inducing events: a category four
storm can cause 10-20 m of beach loss in a few hours, which for most locations is more
than the cumulative total erosion through the 20th
century (McKenzie, 2012). Unlike
background rates of erosion, the erosion caused by short-term storm events like
hurricanes can, given sufficient time, be recovered through accretion (Leatherman,
Zhang, Douglas, 2000). Two studies using historic beach profile data, one conducted in
Jamaica (McKenzie, 2012) and the other in Texas (Morton et al., 2002), determined that
beaches required between three and five years to fully recover to pre-storm conditions
following a category four hurricane. However, if another storm hits before the beach has
recovered, a beach’s vulnerability increases: losses can be even more catastrophic, and
potentially longer lasting.
Between 2001 and 2005 Negril was hit by three category four hurricanes:
Michelle, Ivan, and Wilma. In 2001 after Hurricane Michelle, three years passed before
Hurricane Ivan in 2004, allowing for the 14 m of erosion caused by Michelle to
completely recover. However, only one year separated Ivan in 2004 and Wilma in 2005,
resulting in a net loss of 4 m, which has not been replenished (McKenzie, 2012). The past
decade, therefore, indicates increasing hurricane frequency; however, we must examine
longer term records to determine whether hurricanes pose an increasing threat as a result
of climate change.
The question of whether hurricane frequency is increasing is hotly debated,
mostly because the historical records of hurricane occurrence are limited mostly to land
8. 8
stations (and the majority of hurricanes that form never make landfall). For example, the
Intergovernmental Panel on Climate Change (IPCC, 2013) could not claim unequivocally
that hurricane frequency is increasing. However, through the historical hurricane track
data from the National Ocean and Atmospheric Administration (NOAA, 2014) records of
the frequency and intensity of hurricanes tracking within a two-hundred nautical mile
radius of Negril can be obtained back to 1910. Figure 1 displays the frequency of
hurricanes per decade passing close to Negril, and indicates categories (intensity) of these
storms. While the 2000s show an anomalous peak in the number of severe storms
(categories 4 and 5), there is no obvious linear trend in hurricane numbers in this region.
Instead, hurricane numbers appear to wax and wane over the decades, indicative of
considerable natural variability in the climate system. It is therefore too early to conclude
whether the spike in hurricane numbers since 2000 is due to the effects of climate change,
or simply further evidence of natural variability. Based on the variability in global and
regional surface temperatures over the same period, the explanation is very likely to be a
combination of both (IPCC, 2013).
Turning to hurricane intensity and duration, over the past three decades the
duration of hurricanes passing through the tropical North Atlantic sector has increased by
60 percent, with peak wind speeds increasing by 50 percent (Emanuel, 2005). But the
potential for devastation from a hurricane is a nonlinear function of windspeed: the power
dissipation index (PDI) of a tropical storm that goes as the cube of the maximum one-
minute sustained wind speed (Emanuel, 2005). In other words, a 50 percent increase in
maximum wind speeds translates to a factor of four increase in power.
9. 9
b. Storm surges
Storm surges, defined as changes in sea level due to atmospheric pressure and winds
(Nicholls, 2006), commonly occur with tropical storms and last for several hours. Despite
being a secondary (indirect) effect, storm surges are often responsible for the worst
impacts of tropical storms because they can cause rapid and intense flooding when sea
wall defences are overtopped. Storm surges contribute to beach erosion by creating
large, powerful waves, which propagate further up the shoreline resulting in increased
sediment removal (Nicholls, 2006). The magnitude of storm surges is influenced by the
direction, speed, and duration of winds, and the tidal height at the time of occurrence
(Woth et al., 2005). Hurricanes generate storm surges due to their very low central
pressures, combined with their powerful winds causing higher than normal sea levels and
wave heights.
c. Impacts of climate change
Climate change has the potential to dramatically impact hurricanes and their associated
storm surges, by creating conditions favorable for more frequent, and more intense
tropical storms. Since hurricane formation and lifetime depend on the temperature of the
ocean, changes in mean temperatures are a major concern. Between 1960 and 2006 sea-
surface temperatures (SSTs) in Negril have increased by 0.7°C (Caribsave, 2009), almost
in lock-step with hurricane power (Figure 2). Such increases can intensify beach erosion
even with no change in storm frequency. Looking to the future climate, using model
simulations the IPCC (2013) project continued increases in the maximum wind speed of
storms during the 21st
Century, primarily as a result of increasing SSTs.
10. 10
In Negril, mean annual marine wind speeds have increased by 0.26 m s-1
per
decade since 1960 (Caribsave 2009), on top of the average annual wind speed in Negril
of 6-9 m s-1
(NOAA, 2014). Stronger near-surface winds create additional force to
generate waves, and increase the effect of storm surges (Woth, Weisse, Storch, 2005).
Increasing marine wind speeds and rising sea-levels create more active ocean waters and
larger waves, leading to more frequent ideal conditions for intensified storm surges
(Nicholls, 2006).
Satellite and tide gauge data show that global sea level has risen by approximately
10 cm since 1970, and that the sea level rise (SLR) around Jamaica is consistent with the
global average (Robinson et al., 2012). SLR increases a beach’s vulnerability to the
direct contributing factors influencing beach erosion, by causing stronger storm surges
and by raising the geodetic datum above which the ocean can rise (Caribsave, 2009).
Several studies have attempted to quantify how much more erosion would occur for a 1
m rise in sea level. Leatherman et al. (2000) examined five major cities along the east-
coast of the United States and found beach erosion to be, on average, 150 times greater
than the amount of SLR. Zhang et al. (2004) examined the same cities and, using the
Bruun Rule, found the ratio to be significantly smaller at around 78 times (Table 3).
Despite this study being conducted more than a decade ago, its findings are still
commonly referenced in the modern literature (e.g., Erlandson, 2012; Williams, 2013;
Romine et al., 2013, Tissier, McLoughlin, Sheard, Johnstone, 2014). Zhang et al.’s use of
the Bruun Model has attracted some controversy; however, their findings have yet to be
updated due to the challenges in measuring the relationship between beach erosion and
SLR (Williams, 2013).
11. 11
Climate change therefore presents a serious risk for beach erosion, because it is
expected to amplify both of the direct factors described above. The fact that future
climate projections anticipate simultaneous increases in SSTs, sea level and wind speeds,
combined with greater numbers of intense hurricanes, constitutes the ideal set of
conditions for elevated rates of erosion.
4. Indirect contributing factors
a. Coral reef degradation
Healthy marine ecosystems host high percentages of live coral cover, which form a
protective barrier for the shoreline by reducing the energy of incoming waves by 70 to 80
percent (Brander, Kench, Hart, 2004). This natural defence limits the carving effect that
strong waves can have against the shoreline, and was quantified for Negril by Kushner et
al. (2011) using model simulations. They compared the erosion rates for the existing
coral conditions (15 percent live coral cover, referred to as ‘baseline’), with a scenario
where the live coral cover was replaced with 75-100 percent smooth coral rock. Using a
conservative base erosion rate of 0.3 m per year, reducing the live coral cover from 15
percent to zero was found to increase inshore wave height by 30 percent (4.8 cm), and
erosion rates by up to 0.32 m per year, more than double the baseline erosion rate (Table
4). The conclusion is that seemingly small decreases in coral cover lead to increases in
wave height that can significantly increase beach erosion. Considering the actual
measured erosion rates for Negril are between 0.23 and 1.0 m per year, an increase of
0.32 m per year from a loss in coral cover would be very substantial and significant for
Jamaican stakeholders.
12. 12
Kushner et al.’s experiments provide important context, because Jamaica’s coral
reefs have been degrading significantly since 1970 as a result of multiple factors,
including climate change. Gardner et al. (2003) performed a meta-analysis of the loss in
coral cover across the Caribbean during this period, encompassing 263 sites from 65
separate studies (Figure 3). From 1970 to 2000 absolute coral cover in Jamaica decreased
by around 30 percent, more than twice the rate of loss found in any other region in the
Caribbean. A primary factor is the category five Hurricane Allen in 1980; however,
disease outbreaks that have resulted in the mass mortality of the diadema sea urchin,
coral bleaching, and the coral tissue syndrome white-band disease, are also major
contributors to the coral losses (Gardner et al., 2003).
While similar in appearance, bleaching and white-band disease are two very
different illnesses that coral reef can succumb to. Coral bleaching occurs when the
zooxanthellae cells that provide pigment in the coral die, causing the coral reef to lose its
natural colouring and fade to white (McWilliams et al., 2005). Coral bleaching is non-
fatal, however, it is a powerful coral stressor due to the accompanying sub-lethal effects
including reduced growth, reproduction, and an increased susceptibility to disease
(McWilliams et al., 2005). Coral reefs can recover from bleaching events given sufficient
time. However, without that critical recovery time, large quantities of coral reef can die
as a result of bleaching (James & Crabbe, 2008). White-band disease, on the other hand,
is an infectious disease that kills coral tissue, causing a visible white layer to appear on
the coral surface (Bruno et al., 2007). These two illnesses affect the health and
sustainability of coral reefs, and are partly responsible for the dramatic declines in
absolute coral cover for Jamaica in Figure 3.
13. 13
b. Vegetation
The loss of shoreline vegetation was a recurring topic amongst the ParCA interviewees,
many of whom emphasized the need to actively re-plant vegetation along the coast to
rectify past clearing. Coastal vegetation protects the shoreline in much the same way
coral reefs do, by protecting the beach from the erosion caused by inshore waves, and by
binding the sand together. Vegetation that is branched and flexible will create a strong
drag that limits the speed and reach of incoming waves and mitigates erosion (Nepf &
Vivoni, 2000). The deep running roots of shoreline vegetation also provide structural
support within the sand. The roots from sea oats can reach depths of twenty-five feet,
creating a sand dune that is highly resistant to erosion (Caribsave, 2009). Shoreline
vegetation also releases finer-grained sediments and organic waste, which helps to reduce
the density and coarseness of the soil and creating greater cohesion within the sand dune
(Feagin et al., 2009).
Loss of vegetation exposes beaches to increased erosion, in particular from
hurricanes and storm surges. The amount of storm-related erosion “depends on the
elevation… relative to the geometry of the coast” (Houser & Hamilton, 2008, p. 613),
which implies that a beaches with well-structured, high-elevation, sand dunes are better
able to withstand inshore waves and prevent erosion. Negril’s beaches are shallow with a
mild slope of 10 percent (Kushner et al., 2011), and reportedly high rates of vegetation
removal along the shorelines for the purpose of maintaining beach aesthetics for tourists.
These conditions make Negril’s beaches more susceptible to erosion as vegetation is
removed, reducing the height and structural rigidity of the sand dunes, and their
mitigating effect.
14. 14
c. Impacts of climate change
Climate change has the potential to increase beach erosion through expediting the
removal of the two natural barriers in coral reefs and shoreline vegetation. The precise
causes of the diseases so lethal to diadema antillarum, and to coral reefs, remain
unknown; however, it is suggested that such disease outbreaks are becoming more
common in the warmer waters associated with climate change. McWilliams et al. (2005)
compared Caribbean summertime SSTs to the incidence of coral reef bleaching from
1983 to 2000 (Figure 4). They found that increasing SSTs by one-tenth of a degree
Celsius resulted in a 35 percent increase in coral bleaching. The trend line in Figure 4
strongly suggests that the observed increase of 0.7°C in SSTs around Jamaica has
contributed to increased bleaching of existing Jamaican coral reefs.
The bleaching of coral reefs leaves them more susceptible to disease, and Table 5
shows the results of Bruno et al. (2007) who measured a relationship between incidence
of white-band disease and SSTs for the Great Barrier Reef of Australia (to our
knowledge, no such studies have been conducted for Caribbean coral reefs). A greater
number of events where the weekly SST is 1°C or higher above normal results in a larger
number of white syndrome cases Importantly, these authors note that the relationship is
only significant in regions with a high percentage of live coral cover (50-75%),
suggesting the parasitic nature of the disease creates “an important role of host density as
a threshold for outbreaks” (Bruno et al., 2007). Further study is required to determine to
what extent the findings from Australia can be extrapolated to the Caribbean setting;
however, it is clear that coral reefs around the world are susceptible to climate change,
and their degradation can impact beach erosion.
15. 15
Even less is known about the impact of climate change on shoreline vegetation.
Plant physiology may be affected by changes in the timing and/or intensity of
precipitation, and the ability of vegetation to adapt may depend on the rate of climate
change. Additional impacts from ocean acidification, and salinization, may also affect
the quantity and quality of the vegetation cover on, or near, the beach. But these impacts
are complex, lack a solid observational record, and therefore are beyond the scope of this
study. We conclude that, until now, the primary driver of changes to shoreline vegetation
has been human activity.
5. Discussion and Conclusions
This review highlights the diverse range of processes contributing to beach erosion in
Negril, and more broadly across the Caribbean. Our key finding is that both the direct and
indirect factors affecting beach erosion are likely to be amplified by climate change.
Beach erosion rates are susceptible to changes in sea-surface temperature, sea-level and
marine wind speeds, as well as the frequency and intensity of hurricanes. Current trends
and future projections indicate that climate change is likely to result in more frequent
occurrence of conditions favorable for beach erosion. Hurricanes and storm surges
produce intense waves inducing erosion, further amplified by increases in sea-surface
temperatures, marine winds, and sea levels, which increase the intensity of storms and the
reach of storm waves. Meanwhile the loss of live coral cover results in higher energy
waves to reach the shoreline, which is weakened by the loss of vegetation that serves the
structural integrity of sand dunes. This suggests that background erosion rates currently
observed in Negril (around 0.3 m per year) are highly likely to increase over the coming
century.
16. 16
The response of the marine ecosystem to climate change can be exacerbated by
local scale human activity. For example, shoreline vegetation loss is largely a behavioral
issue (i.e., its removal for aesthetic purposes). The implication is that while global
emissions of greenhouse gases drive climate trends and sea level rise, the actions of
managers and policy-makers could also have significant impacts on beach erosion. This
report is likely to be valuable to stakeholders by providing a knowledge-base for future
climate change impact and vulnerability assessments and adaptation strategies. The
findings are intended to inform the tourism industry in Negril, and may be extrapolated to
other coastal tourism-based economies.
The findings of this paper correlate with the concerns held by tourism respondents
to the ParCA survey, and validate their anecdotal observations of beach erosion as a
significant issue affecting Negril. Beach erosion is a real and pressing issue for Negril
and other areas that depend on tourism revenue, because Jamaica’s white sandy beaches
attract more than 1.3 million tourists each year (UNEP, 2010). In 2013, the Jamaican
tourism industry accounted for 7.7 percent of the country’s gross domestic product
(GDP) directly, and 25.6 percent indirectly (WTTC, 2014). These figures are projected to
increase to 10 and 34.7 percent respectively by 2024 (WTTC, 2014). Likewise, tourism
employment accounts for 7 percent directly, and 23.4 percent indirectly, of all jobs in the
country (WTTC, 2014). There is little doubt, therefore, of the value of the tourism
industry to the Jamaican economy.
American travellers ranked beach erosion as their number one concern when
evaluating travel destinations (Philip & Jones, 2006). The degradation of beaches has the
potential to decrease the number of international visitors, and thus the revenue and jobs
17. 17
generated through tourism-based activities. In addition, considering 82 percent of the
Jamaican population lives within five kilometers of the coast (UNEP, 2010), beach
erosion poses a significant, increasing risk to Jamaica both geophysically and
economically. The retreating shoreline caused by beach erosion brings commercial and
residential infrastructure closer to the shoreline. If the beach buffer zone between the
ocean and property diminishes significantly, the financial toll associated with flooding
and property loss could be catastrophic to the Jamaican economy (Philip & Jones, 2006).
An interesting finding from the ParCA interview data is that while respondents
acknowledged the different factors contributing to beach erosion, none noted the
interrelatedness of beach erosion to other issues mentioned, such as the removal of
vegetation, loss of coral reefs, or increasing storm frequency and wave activity. For
example, several respondents remarked on those involved in the tourism industry burying
or removing vegetation. This suggests that while the local population are aware of the
potential contribution of climate change to beach erosion, their own role may not be well
understood. This suggests that significant potential exists for eliciting behavioral change
toward practices that mitigate beach erosion, and prevent the economic loss associated
with it.
Acknowledgments.
Chad Morris was funded through an NSERC Undergraduate Student Research Award.
We thank Maliha Majeed and the ParCA project for providing the pre-processed
interview response data.
18. 18
References
Brander, R., Kench, P., Hart, D. 2004. Spatial and temporal variations in wave
characteristics across a reef platform, Warraber Island, Torres Strait, Australia. Marine
Geology, 207, 169-184.
Bruno, J., Selig, E., Casey, K., Page C., Willis, B., Harvell, C., Sweatman, H., Melendy,
A. 2007. Thermal stress and coral cover as drivers of coral disease outbreaks. PLoS
Biol, 596, 1220-1227.
Caribsave. 2009. Final report Negril - Jamaica. Caribsave. Retrieved May 5, 2014, from
http://myspot.mona.uwi.edu/physics/sites/default/files/physics/uploads/CARIBSAVE%2
0Destination%20profile%20Negril.pdf
Cambers, G. 2009. Caribbean beach changes and climate change adaptation. Aquatic
Ecosystem Health & Management, 12(2), 168-176.
Cooper, J., Pilkey, O. 2004. Sea-level rise and shoreline retreat: time to abandon the
Bruun Rule. Global and Planetary Change, 43, 157-171.
Emanuel, K. 2005. Increasing destructiveness of tropical cyclones over the past 30 years.
Nature, 436(4), 686-688.
19. 19
Erlandson, J. 2012. As the world warms: rising seas, coastal archaeology, and the erosion
of maritime history. Journal of Coastal Conservation, 16, 137-142.
Feagin, R., Lozada-Bernard, S., Ravens, T., Moller, I., Yeager, K., Baird, A. 2009. Does
vegetation prevent wave erosion of salt marsh edges? Proceedings of the National
Academy of Sciences of the United States of America (PNAS), 106(25), 10109-10113.
Gardner, T., Cote, I., Gill, J., Grant, A., Watkinson, A. 2003. Long-term region-wide
declines in Caribbean corals. Science, New Series, 301(5635), 958-960.
Hyman, T. 2014. Assessing the vulnerability of beach tourism and non-beach tourism to
climate change: a case study from Jamaica. Journal of Sustainable Tourism, 37-41.
Intergovernmental Panel on Climate Change (IPCC) 2013. Working Group I report:
Climate change: the physical science basis.
Intergovernmental Panel on Climate Change (IPCC) 2014. Working Group II report:
Climate Change 2014: Impacts, Adaptation, and Vulnerability.
James, M., Crabbe, C. 2008. Climate change, global warming and coral reefs: modelling
the effects of temperature. Computational Biology and Chemistry, 32(5), 311-314.
20. 20
Kushner, B., Edwards, P., Burke, L., & Cooper, E. 2011. Coastal Capital: Jamaica. Coral
Reefs, Beach Erosion and Impacts to Tourism in Jamaica. Intergovernmental Panel on
Climate Change. Retrieved May 5, 2014, from
http://www.wri.org/sites/default/files/wri_working_paper_jamaica_tourism_final.pdf
Leatherman, S., Zhang, K., Douglas, B. 2000. Sea level rise shown to drive coastal
erosion. Eos, Transactions American Geophysical Union, 81(6), 55-57.
McKenzie, A. 2012. Beach responses to hurricane impacts: a case study of Long Bay
Beach, Negril, Jamaica. Caribbean Journal of Earth Science, 43, 51-58.
McWilliams, J., Cote, I., Gill, J., Sutherland, W., Watkinson, A. 2005. Accelerating
impacts of temperature-induced coral bleaching in the Caribbean. Ecology, 86(8), 2055-
2060.
Morton, R.A. 2002. Factors controlling storm impacts on coastal barriers and beaches - a
preliminary basis for real time forecasting. Journal of Coastal Research, 18(3), 486-501.
Nepf, H., Vivoni, E. 2000. Flow structure in depth-limited, vegetated flow. Journal of
Geophysical Research, 105, 28547-28557.
National Ocean and Atmospheric Administration (NOAA). 2014. Historical hurricane
tracks. Retrieved June 16th from
21. 21
http://www.csc.noaa.gov/hurricanes/index.html?#
Nicholls, R. 2006. Storm surges in coastal areas. Natural Disaster Hotspots Case Studies
(pp. 79-108). Washington, D.C.: World Bank.
Robinson, E., Khan, S., Coutou, R., Johnson, M. 2012. Shoreline changes and sea-level
rise at Long Bay, Negril, western Jamaica. Journal of Earth Science, 43, 35-49.
Romine, B., Fletcher, C., Barbee, M., Anderson, T., Frazer, L. 2013. Are beach erosion
rates and sea-level rise related in Hawaii? Global and Planetary Change, 108, 149-157.
Phillips, M. & Jones, A. 2006. Erosion and tourism infrastructure in the coastal zone:
problems consequences and management. Tourism Management, 27, 517-524.
Scott, D., Simpson, M., Sim, R. 2012. The vulnerability of Caribbean coastal tourism to
scenarios of climate change related sea level rise. Journal of Sustainable Tourism, 20(6),
883-898.
Tissier, E., McLoughlin, P., Sheard, J., Johnstone, J. 2014. Distribution of vegetation
along environmental gradients on Sable Island, Nova Scotia. Ecoscience, 20(4), 361-372.
UNEP. 2010. Linking ecosystems to risk and vulnerability reduction. The case of
Jamaica. United Nations Environment Programme Post-Conflict and Disaster
22. 22
Management Branch. Retrieved May 5, 2014, from
http://postconflict.unep.ch/publications/RiVAMP.pdf
Williams, S. 2013. Sea-level rise implications for coastal regions. Journal of Coastal
Research, 63, 184-196.
Woth, K., Weisse, R., Storch, H. 2005. Climate change and North Sea storm surge
extremes: an ensemble study of storm surge extremes expected in a changed climate
projected by four different regional climate models. Ocean Dynamics, 56, 3-15.
World Travel and Tourism Council (WTTC). 2011. Travel & tourism economic impact
2014: Jamaica. Retrieved July 10, 2014,
from http://www.wttc.org/site_media/uploads/downloads/jamaica2014.pdf
Zhang, K., Douglas, B., Leatherman, S. 2004. Global warming and coastal erosion.
Climatic Change, 64(1-2), 41-58.
23. 23
TABLE 1. Beach changes and hurricane frequency in selected Caribbean islands measured
from 1985 to 2000. From: Cambers, 2009, p.170.
24. 24
TABLE 2. Based on interviews by ParCA, the number of respondents from the tourism
industry who expressed concern about different atmospheric (top four rows) and marine
(bottom four rows) factors associated with climate change. Of 94 total respondents, 46
mentioned relevant climate information, and their responses are summarized here.
Beach erosion is highlighted as the leading concern overall.
Concerns Number of
respondents (%)
Atmospheric Factors
Increased Temperature 7 (15)
Decreased Precipitation 14 (30)
Increased Frequency of Storm Events 7 (15)
Unpredictable Weather Patterns (Rainfall & Storms) 13 (28)
Marine factors
Decreasing Fish Stocks & Sizes 4 (8)
Coral Reef Loss 7 (15)
Beach Erosion 16 (34)
Increase in Ocean Movement & Coastal Flooding 7 (15)
25. 25
TABLE 3. Ratios of shoreline change rates, r, to rates of SLR, s, for each coastal
compartment. Compartment averages are shown, but the rate of RSL rise for each
transect was computed by interpolation from Figure 2 for the actual latitude of the
transect. Negative sign of shoreline change rate indicates that beaches have experienced
erosion. From Zhang et al. (2004), their Table 2.
54 KEQI ZHANG ET AL.
Table II
Ratios of shoreline change rates, r, to rates of SLR, s, for each coastal compartment. Compartment
averages are shown, but the rate of RSL rise for each transect was computed by interpolation from
Figure 2 for the actual latitude of the transect. Negative sign of shoreline change rate indicates that
beaches have experienced erosion
Compartment Long Island, New Jersey Delmarva North South
New York Carolina Carolina
Average latitude (degrees) 40.86 39.92 38.30 35.85 33.76
Average RSL rise rate 2.62 3.17 3.83 4.16 3.81
(a, mm/yr)
Average shoreline change –0.13 –0.38 –0.20 –0.32 –0.34
rate (s, m/yr)
s/a 50 120 52 77 90
Average s/a, all 78
compartments
and 52, respectively, compared to the other compartment results. There is evidence
in both cases that beach replenishment is occurring naturally. On-going erosion
of the Montauk bluffs at the eastern end of Long Island is providing sediments
to downdrift (westward) areas. Also, there is strong scientific evidence that relict
glacial shoreface sand is being fed onto the beach (Schwab et al., 2000). In the case
of Delmarva, there is a relict Pleistocene barrier in Delaware that supplies sand to
the littoral system (Kraft, 1971).
Leatherman et al. (2000b) demonstrated that the shoreline change rate is about
150 times that of the sea level change rate. That result was obtained by remov-
ing the acretional sections from shorelines not influenced by inlets and coastal
engineering projects. Such accretion can result from local variations in longshore
sediment transport, sand feed from offshore, or the influence of local geological
factors. Therefore, localized erosion effects caused by longshore sediment trans-
port are not averaged out by removing all accretional sections, and the ratio can be
viewed as the upper bound of the ratio of shoreline change rate versus the rate of
sea level rise. The average ratio of 78 derived herein can be viewed as the lower
bound of the ratio because some shoreline sections may receive a sand feed from
offshore (Kraft, 1971; Schwab et al., 2000).
26. 26
TABLE 4. The relationship between coral reef and beach erosion in Negril, Jamaica,
predicted by an idealized modelling experiment. From Kushner et al. (2011), their Table
1.
.
17
year period. Please see Table 1 for a summary of the modeling results and Appendix 2 for the full results,
data sources, and input values used in the application of the Sheppard model for Negril.
Table 1. Sheppard model results for Long Bay, Negril
Model Scenario Inshore
Wave
Height (m)
% increase in
inshore wave
height
% increase in erosion
rate relative to
current
Beach loss (using a
base erosion rate .3
m/yr)
Current 15% live
coral cover (baseline)
.159 0 (current) 0 (current) .30
No live coral cover
(bottom friction is
reduced)
.207 30 94
Year 1 of erosion .208 31 96 .59
Year 10 of erosion .217 36 118 .65
Total loss of beach width after 10 years (average for Long Bay, in m)
If reef degrades and erodes 6.2
Base scenario – Reef unchanged, current erosion
rate of 0.3 m / yr continues
3.0
MIKE 21 Application and Results
The MIKE 21 model was applied in both two- and three-dimensional modes for Negril to examine how
coastal inundation is likely to change if the reefs in Long Bay degrade further.b
Using the outputs of that
modeling effort, a specific storm scenario was examined that most closely matches the scenario evaluated
above using the Sheppard model. The scenario uses the “1-year storm event”c
for Negril and a 1 meter
loss of reef height (the water level above the reef increases from 1 m to 2 m). The estimated model output
of change in inshore wave heights from the MIKE 21 model was used to compare to the equivalent output
from the Sheppard model. In both cases, the percent change in wave height was used to estimate the
likely change in beach erosion.
Table 2 presents a summary for a 1-year storm event in Negril of the effect of a 1 m loss of reef height
during a 1 year storm event. MIKE 21 results suggest that the inshore wave height would increase by 43
percent (from .40 to .57 m height), which translates to more than doubling the rate of beach erosion.
Figure 2 shows estimated wave height for the 1-year storm event using the MIKE 21 model. Note the
diminished wave height is most pronounced behind the location of the larger shallow reef in Long Bay.
The diminished wave height noted along the remaining shoreline is most likely a result of the protection
afforded by the offshore fringing reef.
b
This was part of a separate project component mapping the influence of reef degradation on coastal inundation. See
http://www.wri.org/coastal-capital.
c
A 1-year storm event refers to the largest storm that occurs at a specific location during a typical year.
27. 27
TABLE 5. Observed Number of White Syndrome Cases on the Great Barrier Reef,
Queensland, Australia, between 1998 and 2004. Values are the mean number of white
syndrome cases per 1500 m2
, plus/minus one standard error, as a function of the number
of warm SST anomaly (WSSTA) events. Values in parentheses are the number of
sampled reefs in each category. From Bruno et al. (2007).
28. 28
FIG. 1. The historical record of hurricanes tracking within a 200 nautical mile radius of
Negril, Jamaica from 1910 to 2010 grouped by decade. Data retrieved from the National
Ocean and Atmospheric Administration (NOAA) July 3rd
, 2014, from
http://www.csc.noaa.gov/hurricanes/index.html?#
29. 29
FIG. 2. The total power dissipated annually by tropical cyclones in the North Atlantic
(PDI, red curve) compared to averaged sea surface temperatures in the North Atlantic
sector (SST, blue curve) from 1949 to 2009. Updated from Emanuel, 2005, p. 687,
retrieved
from http://eaps4.mit.edu/faculty/Emanuel/publications/tropical_cyclone_trends.
30. 30
FIG. 3. Coral cover change for subregions of the Caribbean and for 5-year time periods
from 1975 to 2000, expressed as the percentage change in absolute percent coral cover.
Adapted from Gardner et al. (2003), their Fig. 3.
T A Gardner et al. Science 2003;301:958-960
Published by AAAS
31. 31
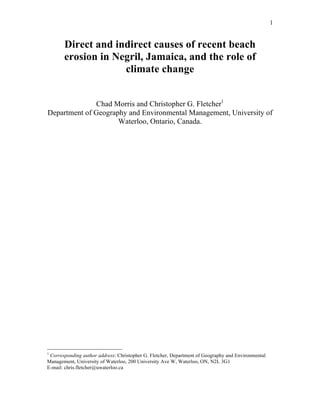
FIG. 4. Relationship between regional SST anomalies and the percentage of cells from
which at least one coral-bleaching occurrence was recorded in the Caribbean from 1983
to 2000. Each data point represents one year, solid circles represent years with mass
bleaching events, open circles represent other years. From: McWilliams et al. (2005).
FIG. 2. The relationship between regional SST anomalies
and the percentage of 1Њ cells from which at least one coral
bleaching occurrence was recorded during August–October
in the Caribbean between 1983 and 2000. Each data point
represents one year. Solid circles represent years described
in the literature as mass bleaching events, open circles rep-
resent other years. The solid line represents the regression
line (log[cells] ϭ 1.34[SST] ϩ 0.71; r2
ϭ 0.86, n ϭ 18, P Ͻ
0.001). The dashed line shows the SST at which maximum
bleaching extent should occur based on extrapolation of the
regression line.
present. These
for the period
aken from 15
ths of August,
provide a sin-
maly for each
sly used else-
tures coincide
er et al. 2000).
and the mean
10 transformed
mperature. All
ummarized in
d here to refer
omalies. Sum-
ncreased from
.012) with the
ϩ0.72ЊC) and
e to the 1961–
ching was re-
ally with SST
the regional scale. A 0.1ЊC increase in regional SST
produces a 35% increase in the number of coral reef
cells reporting bleaching and a 42% increase in the