Download as PDF, PPTX


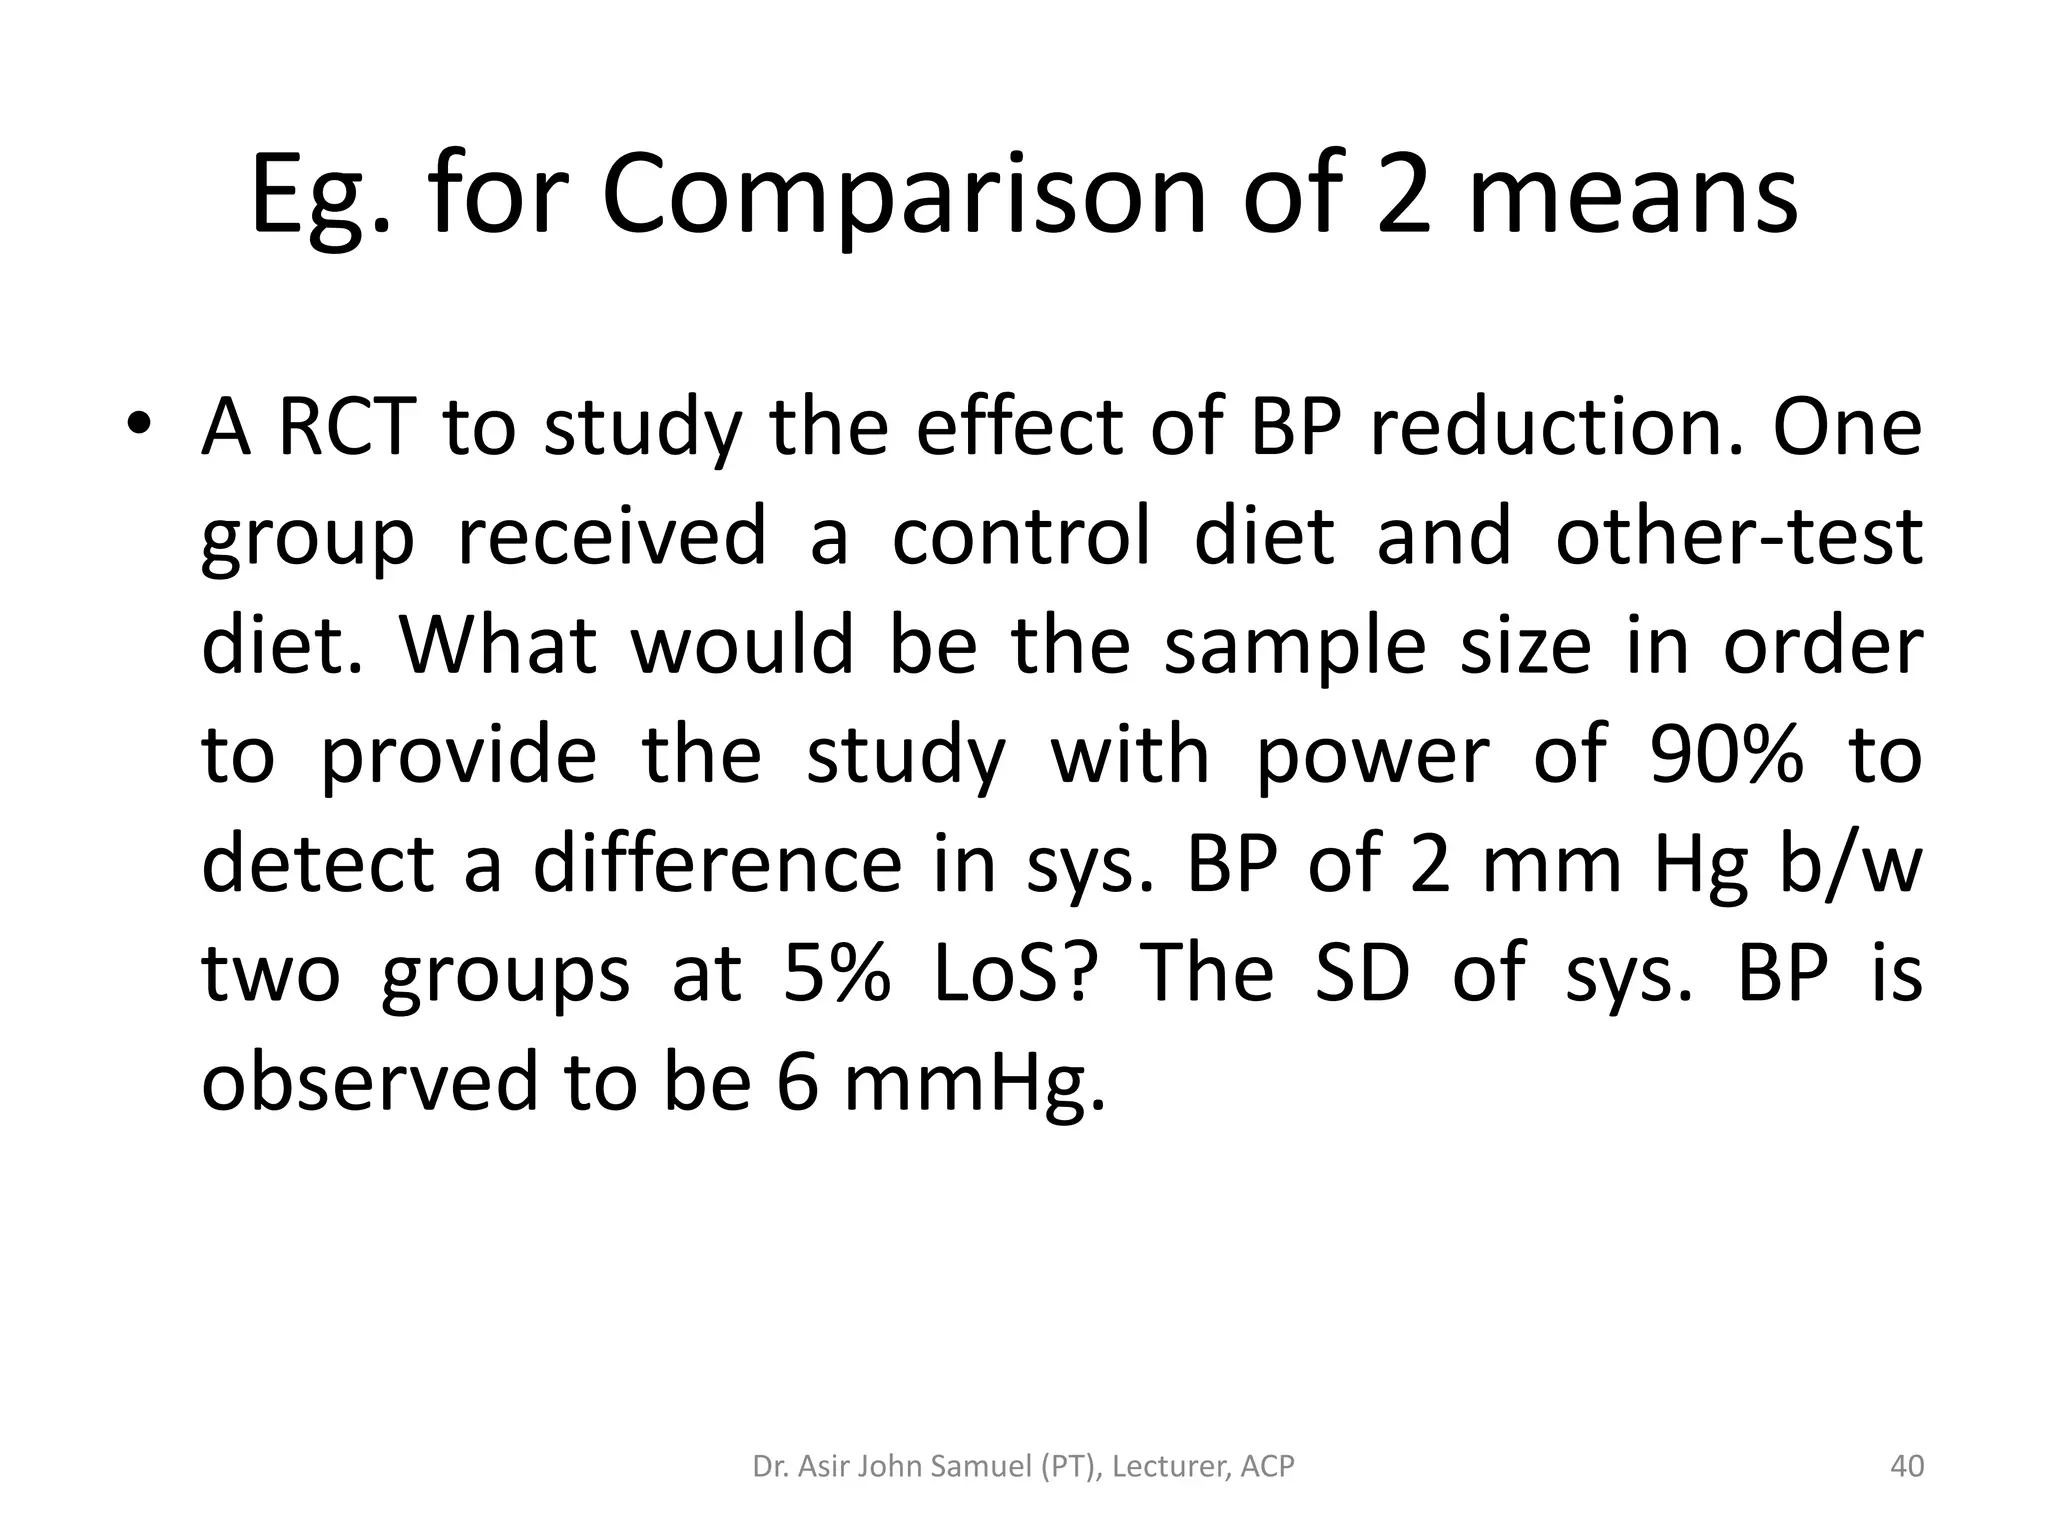
![Comparison of 2 means
n= 2 [(Zα+Zβ)s/d]²
Zα – LoS
Zβ – power of study
s – pooled SD of the two sample
d – clinically significant difference
Dr. Asir John Samuel (PT), Lecturer, ACP 39](https://image.slidesharecdn.com/4-samplingdesign-120907043524-phpapp02/75/4-sampling-design-39-2048.jpg)

The document outlines the principles and methodologies of sampling design, discussing the definitions of key terms like population and sample, as well as the importance and benefits of sampling in research. It details various sampling techniques including random, stratified, systematic, cluster, and non-probability methods, along with their merits, demerits, and steps involved. Additionally, it addresses sample size determination, hypothesis testing, and considerations for statistical analysis in research studies.
Introduces the concept of sampling design, including presenter details.
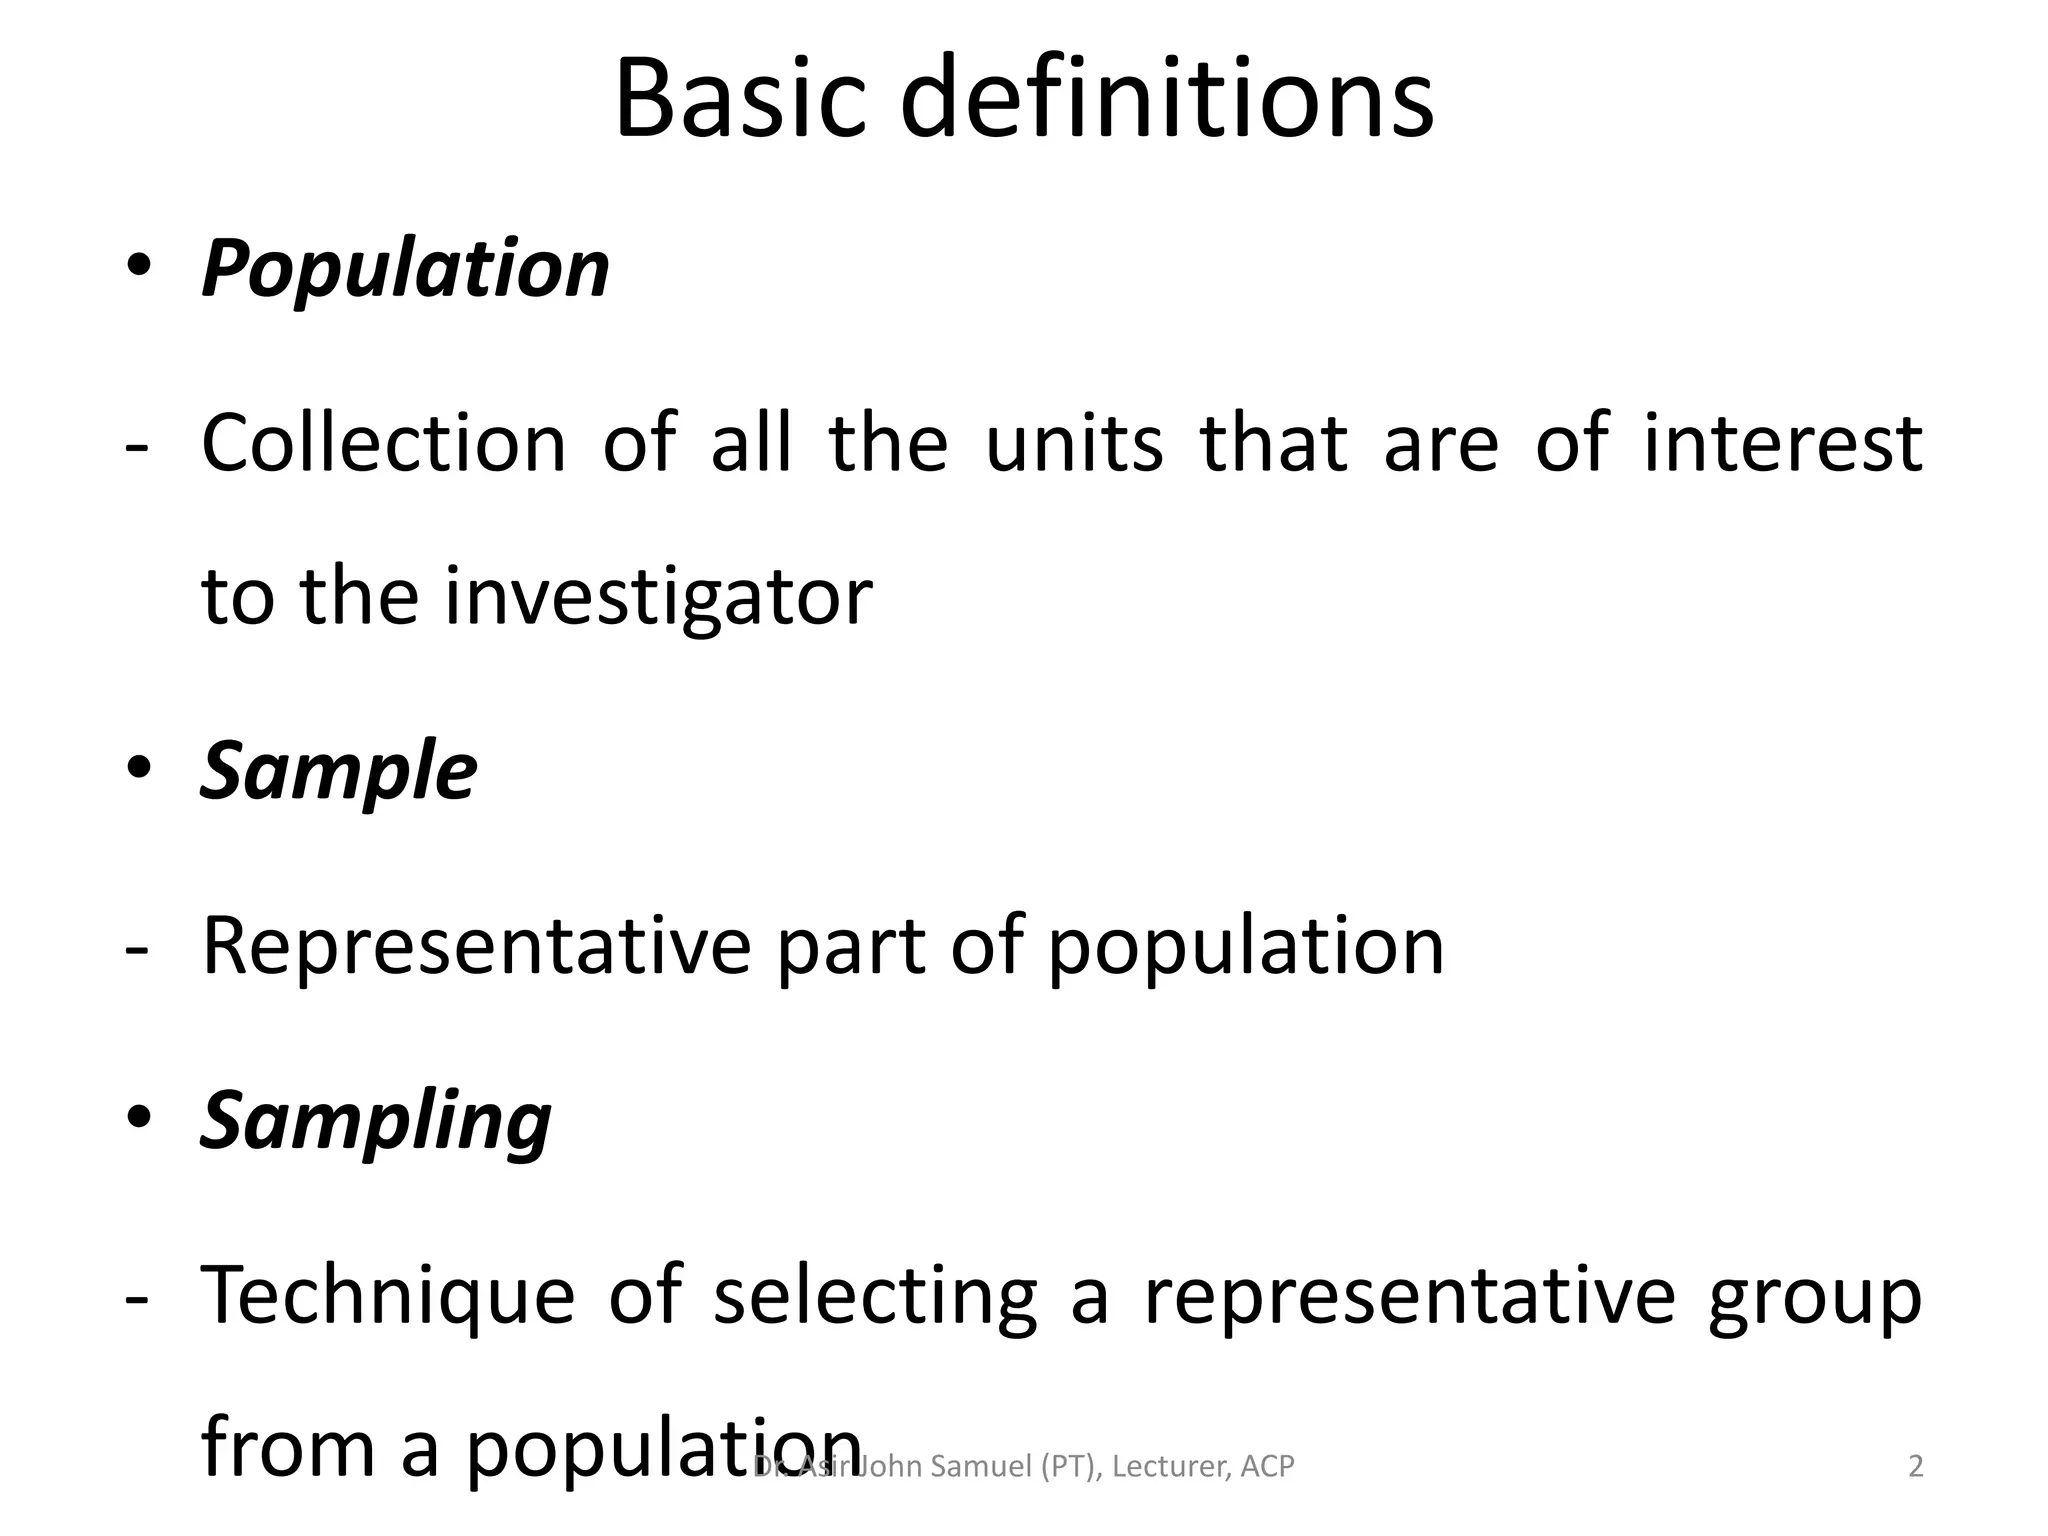
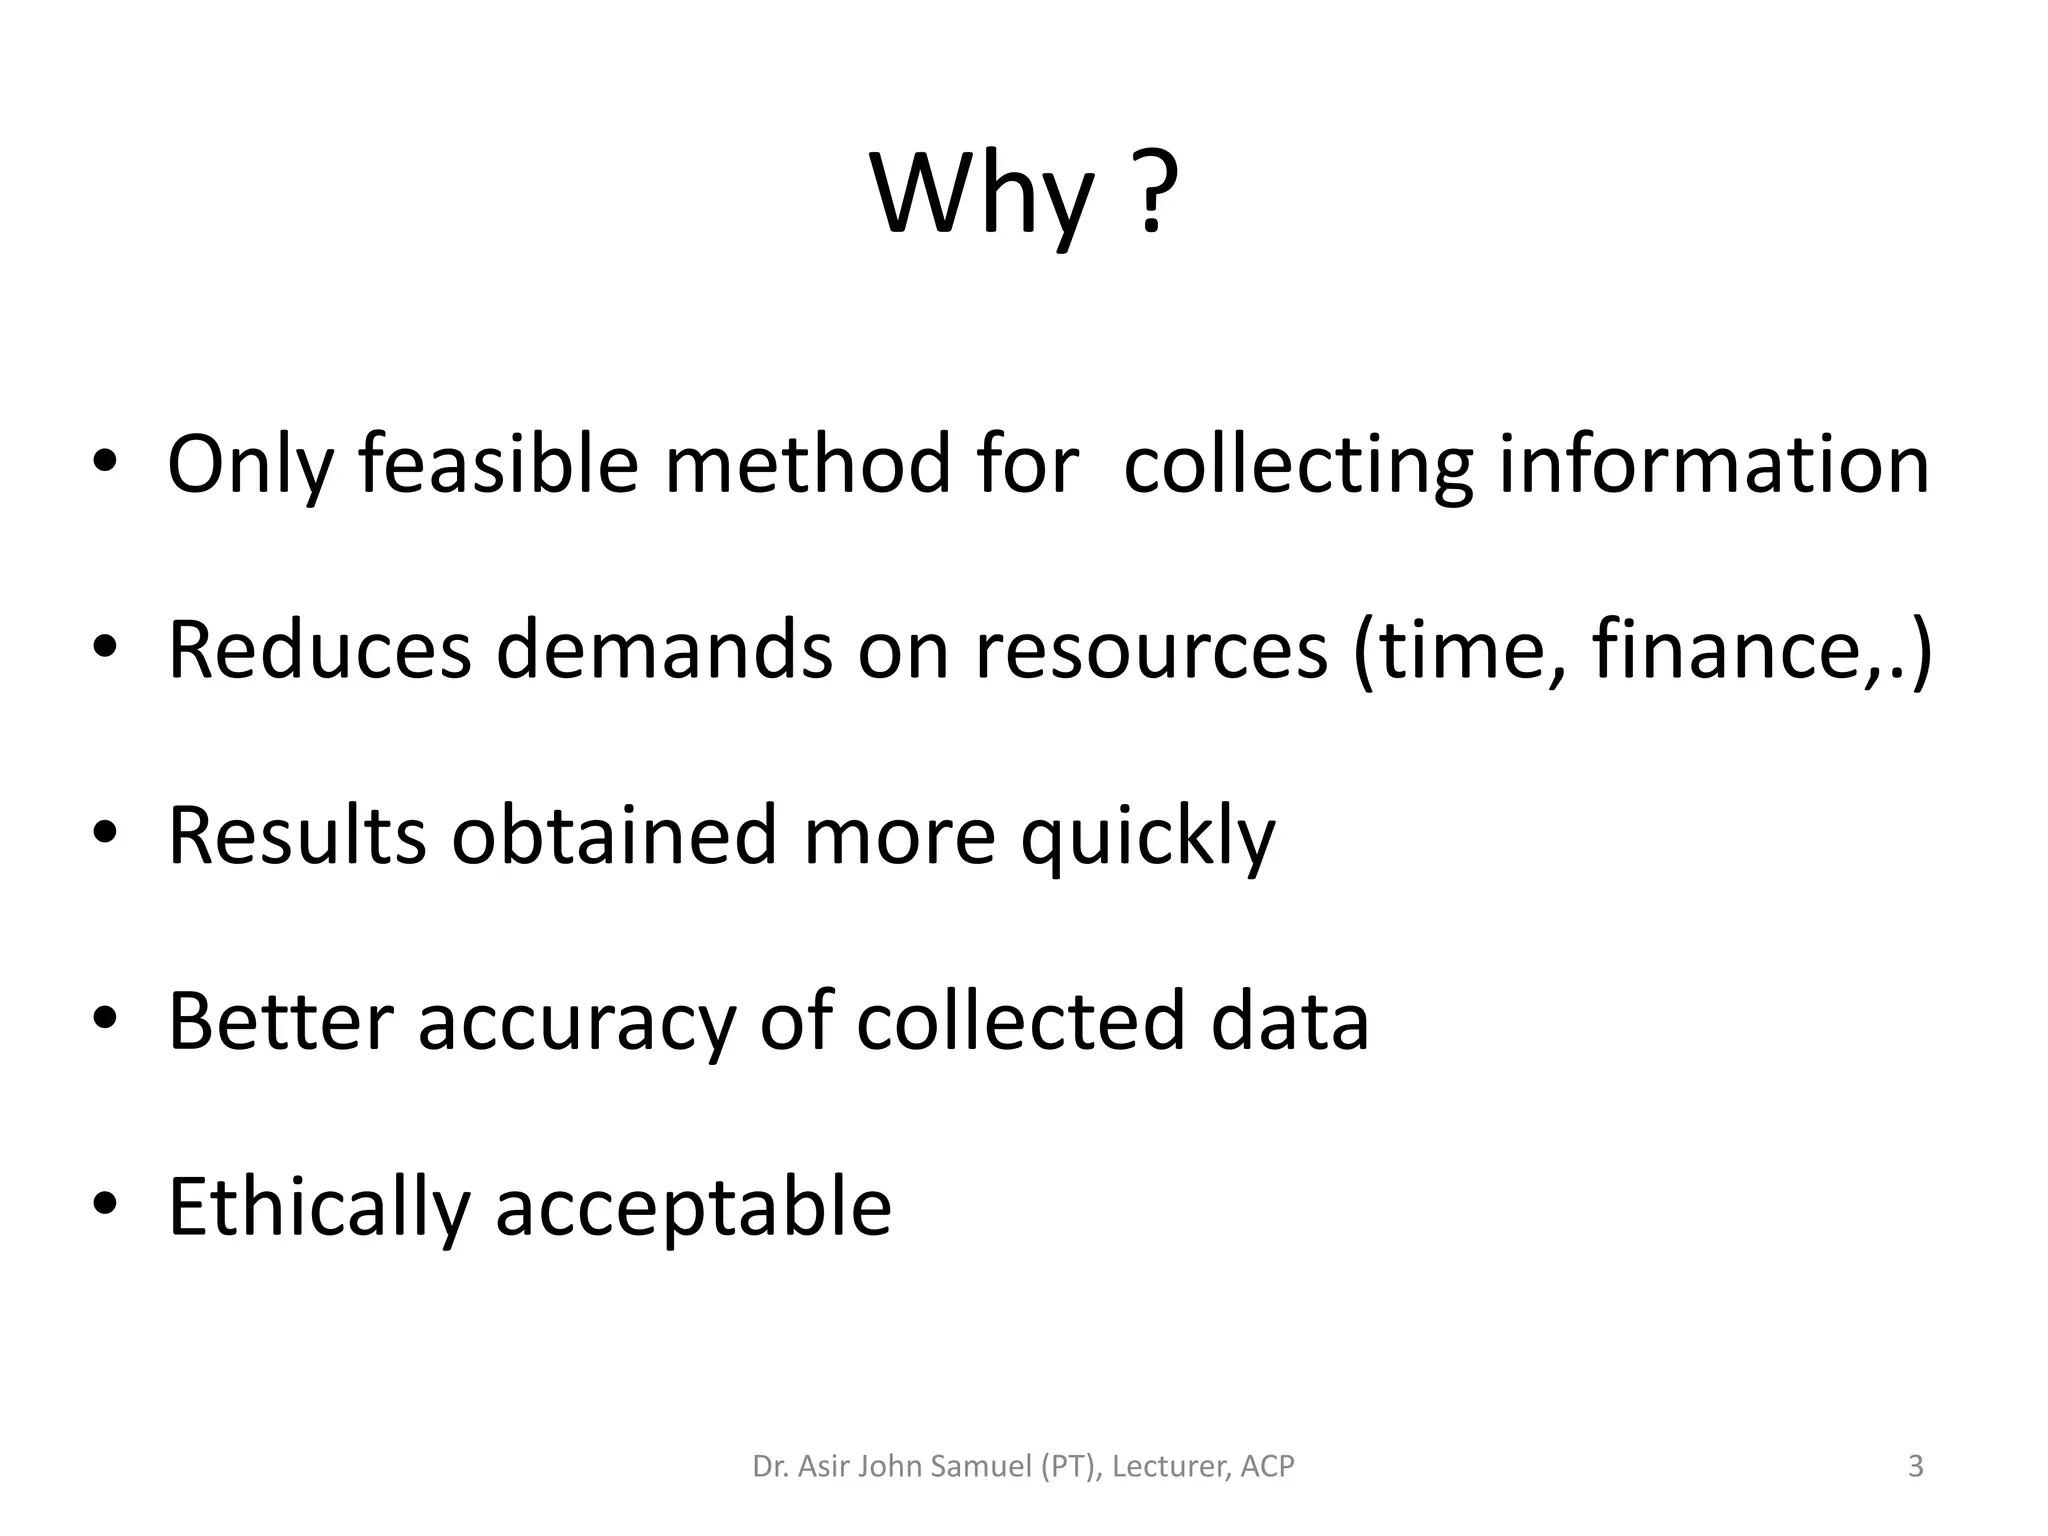
Defines population and sample. Discusses importance of sampling for efficiency and accuracy.
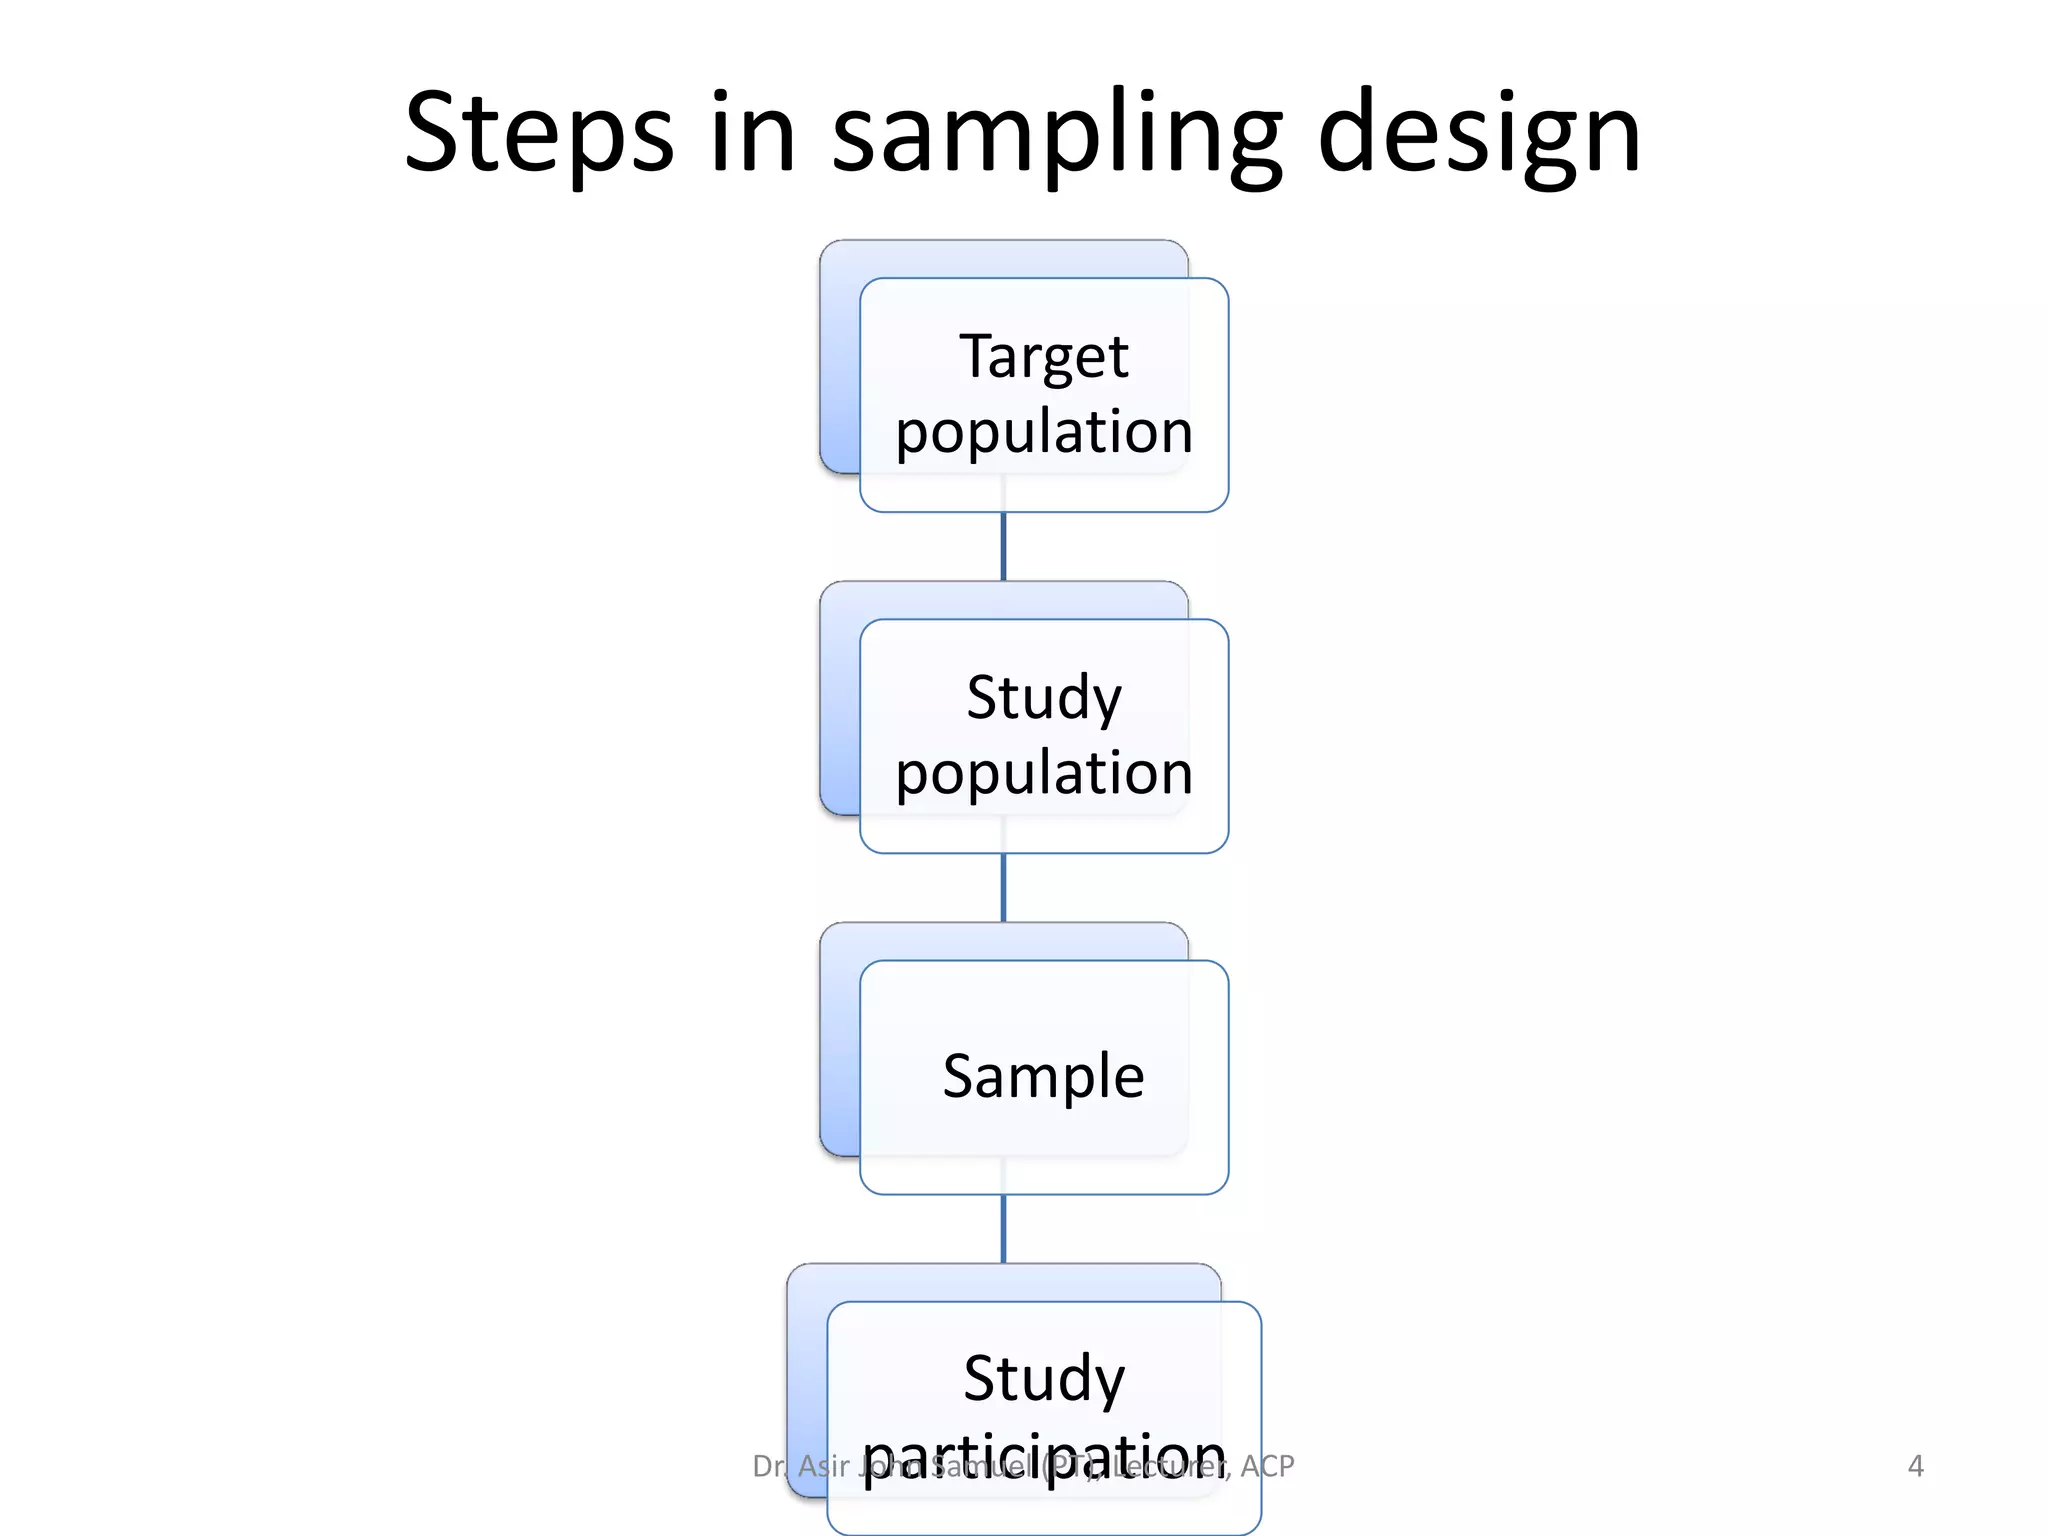
Outlines the steps in sampling design and characteristics of good sample design.
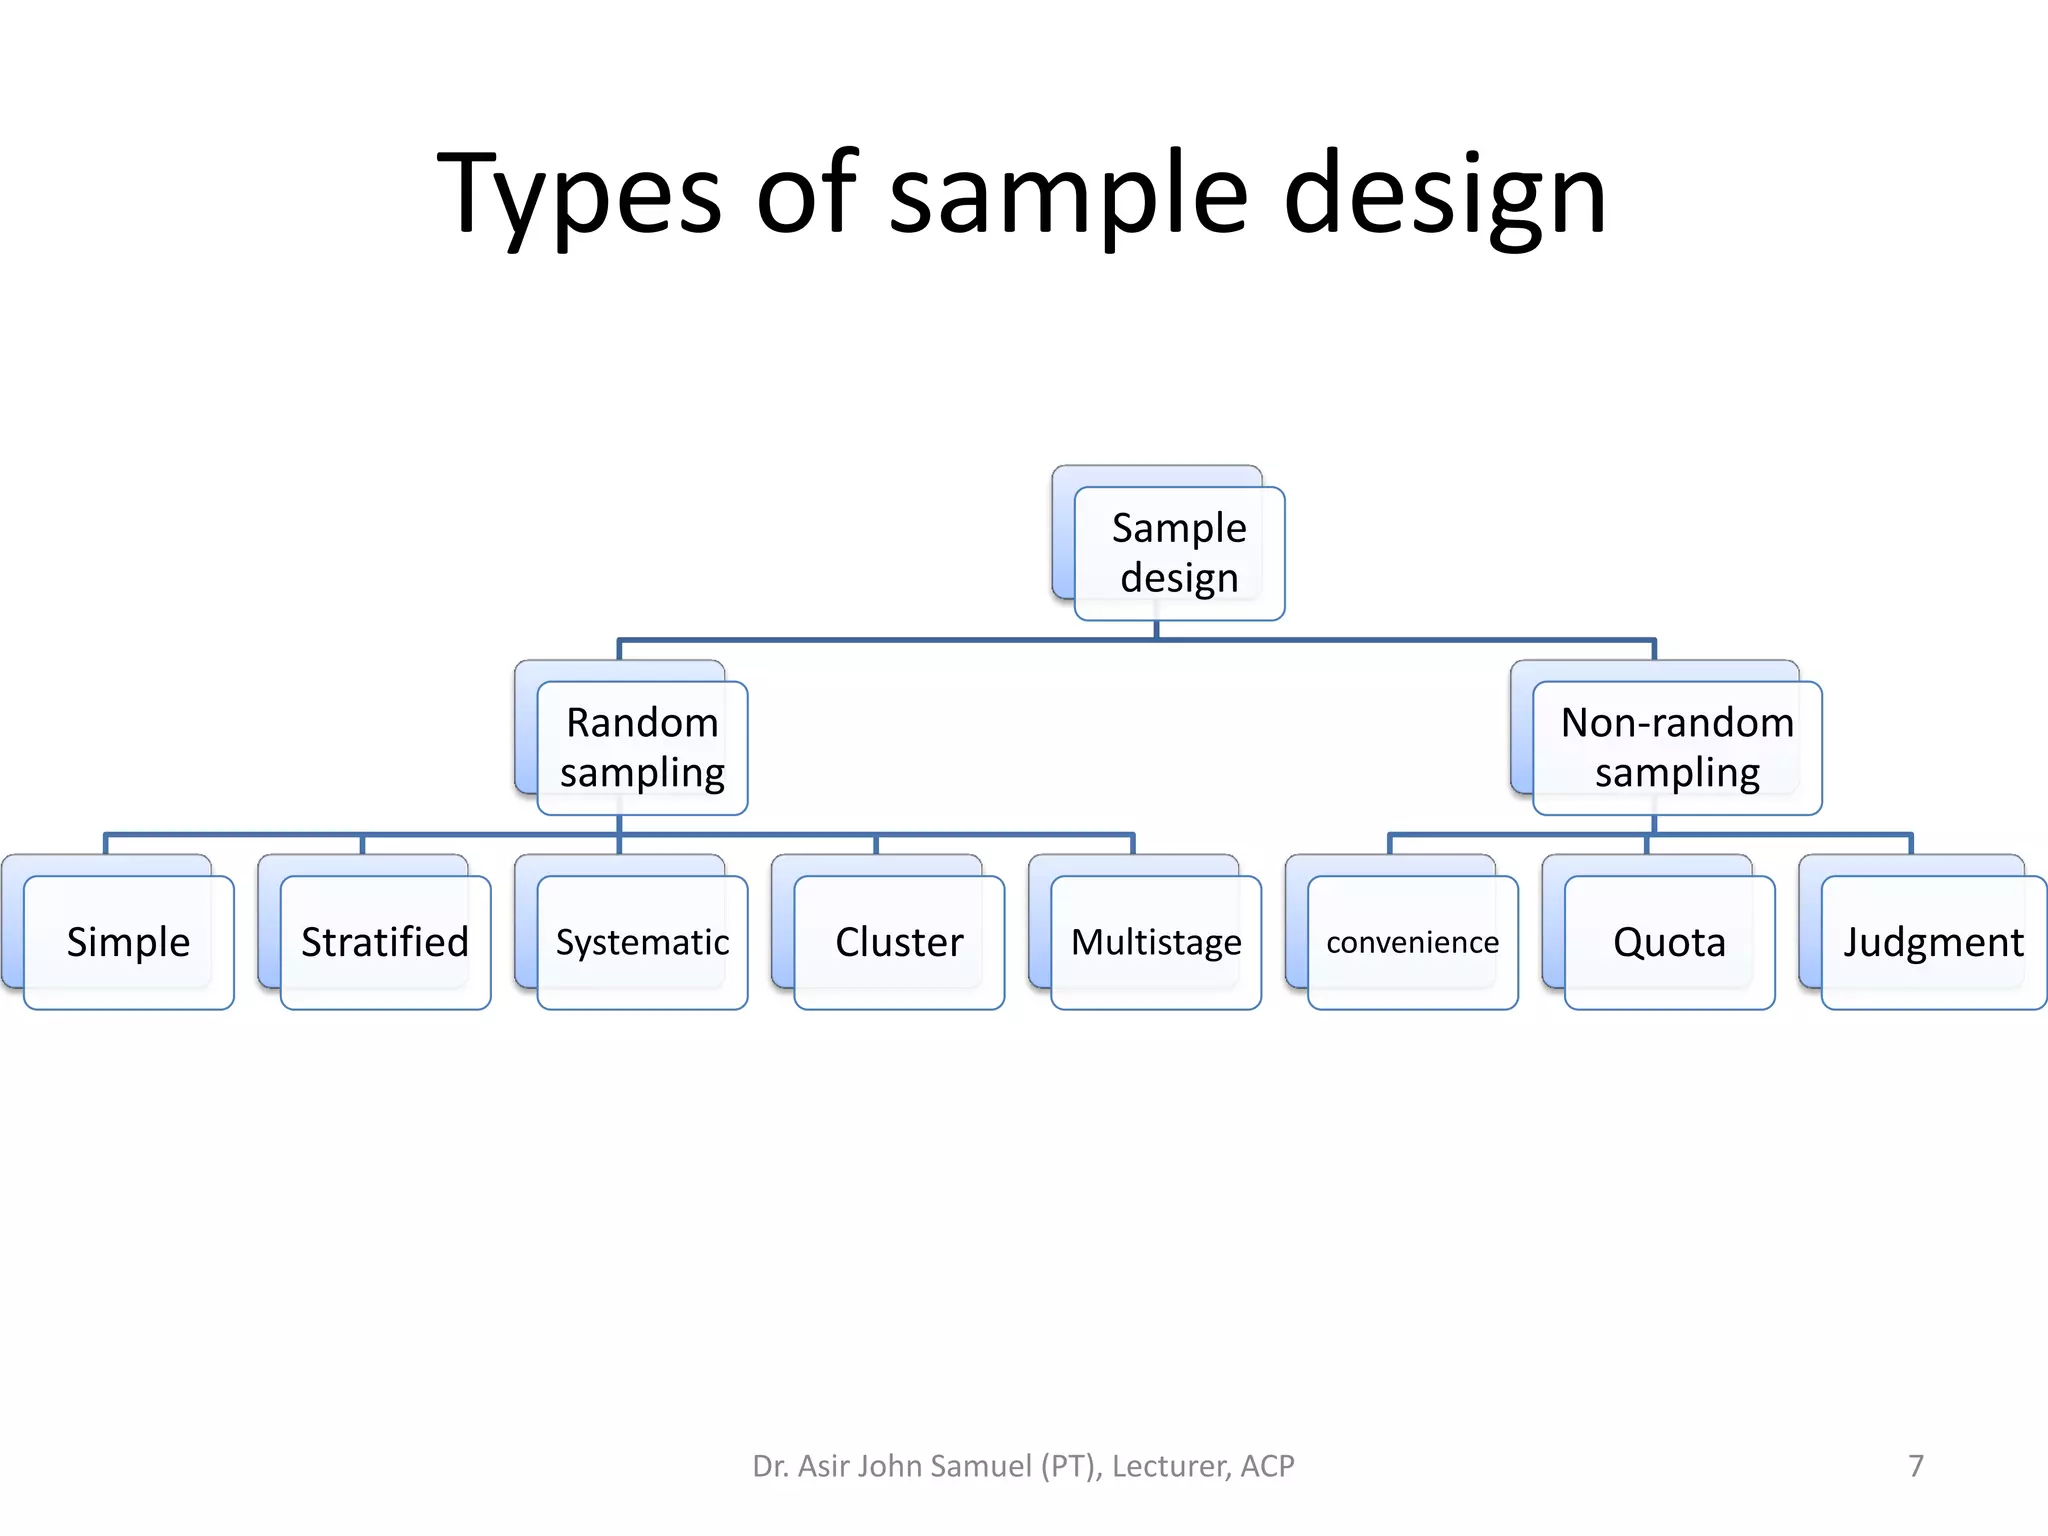
Explains probability and non-probability sampling and different types of sampling designs.
Describes method, merits, and demerits of simple random sampling.
Explains stratified random sampling method and its benefits and challenges.
Describes systematic sampling process, its merits and demerits.
Explains cluster sampling and its advantages and disadvantages.
Describes the multistage sampling process, including its merits and drawbacks.
Outlines various non-probability sampling methods and concerns.
Summarizes general advantages and disadvantages of sampling methods.
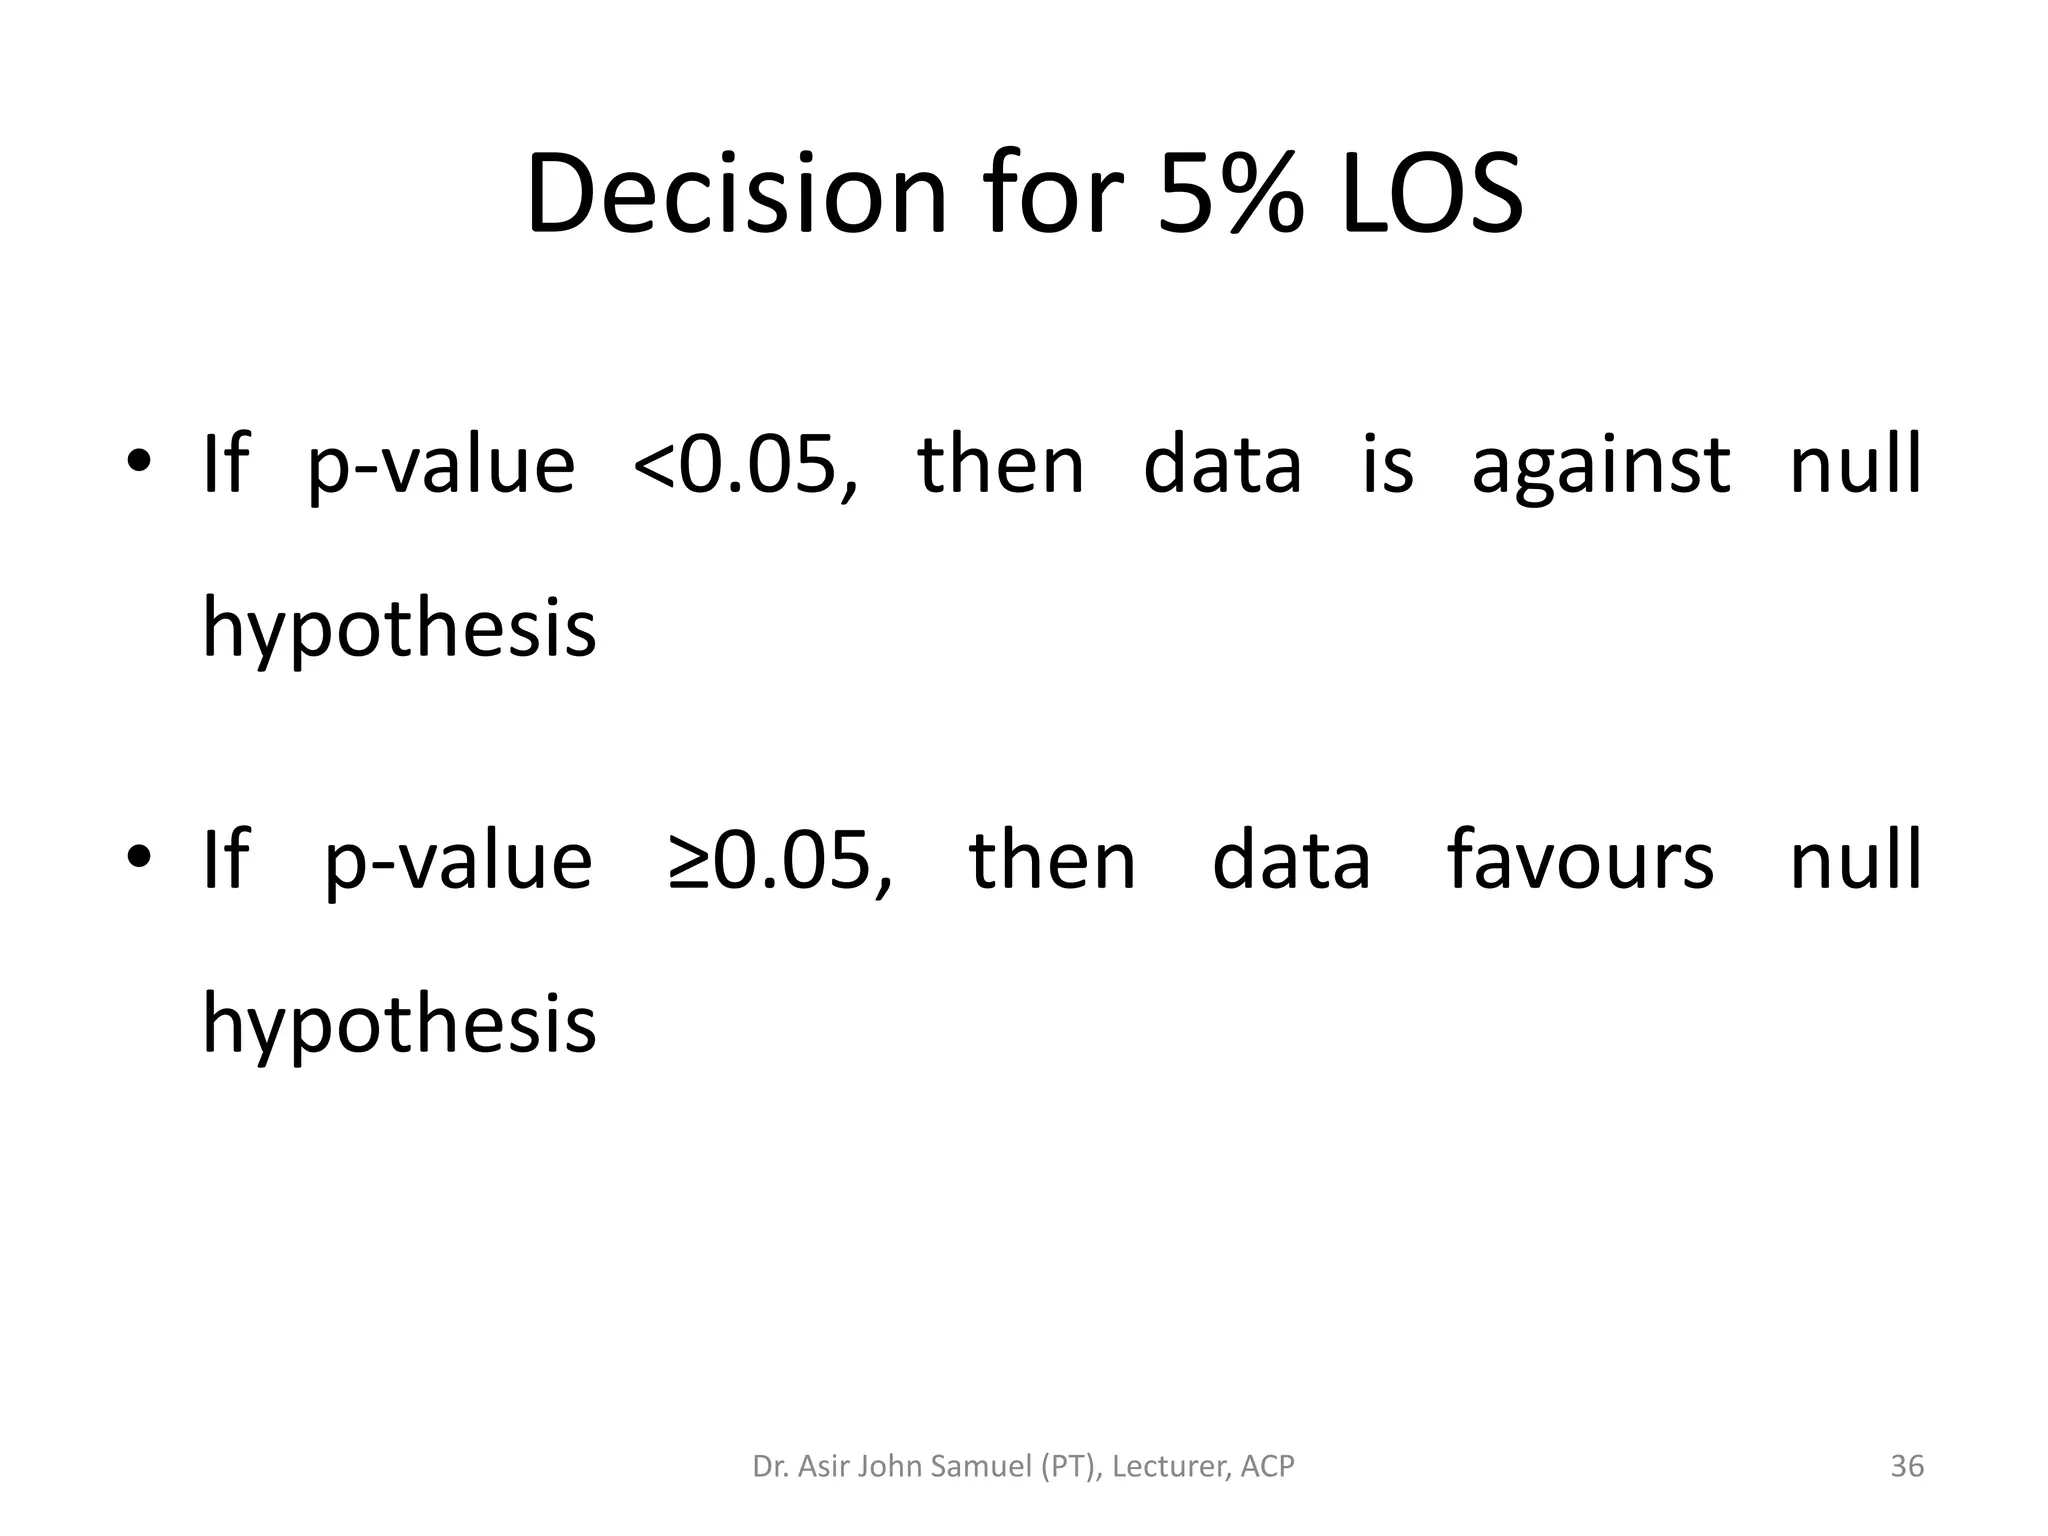
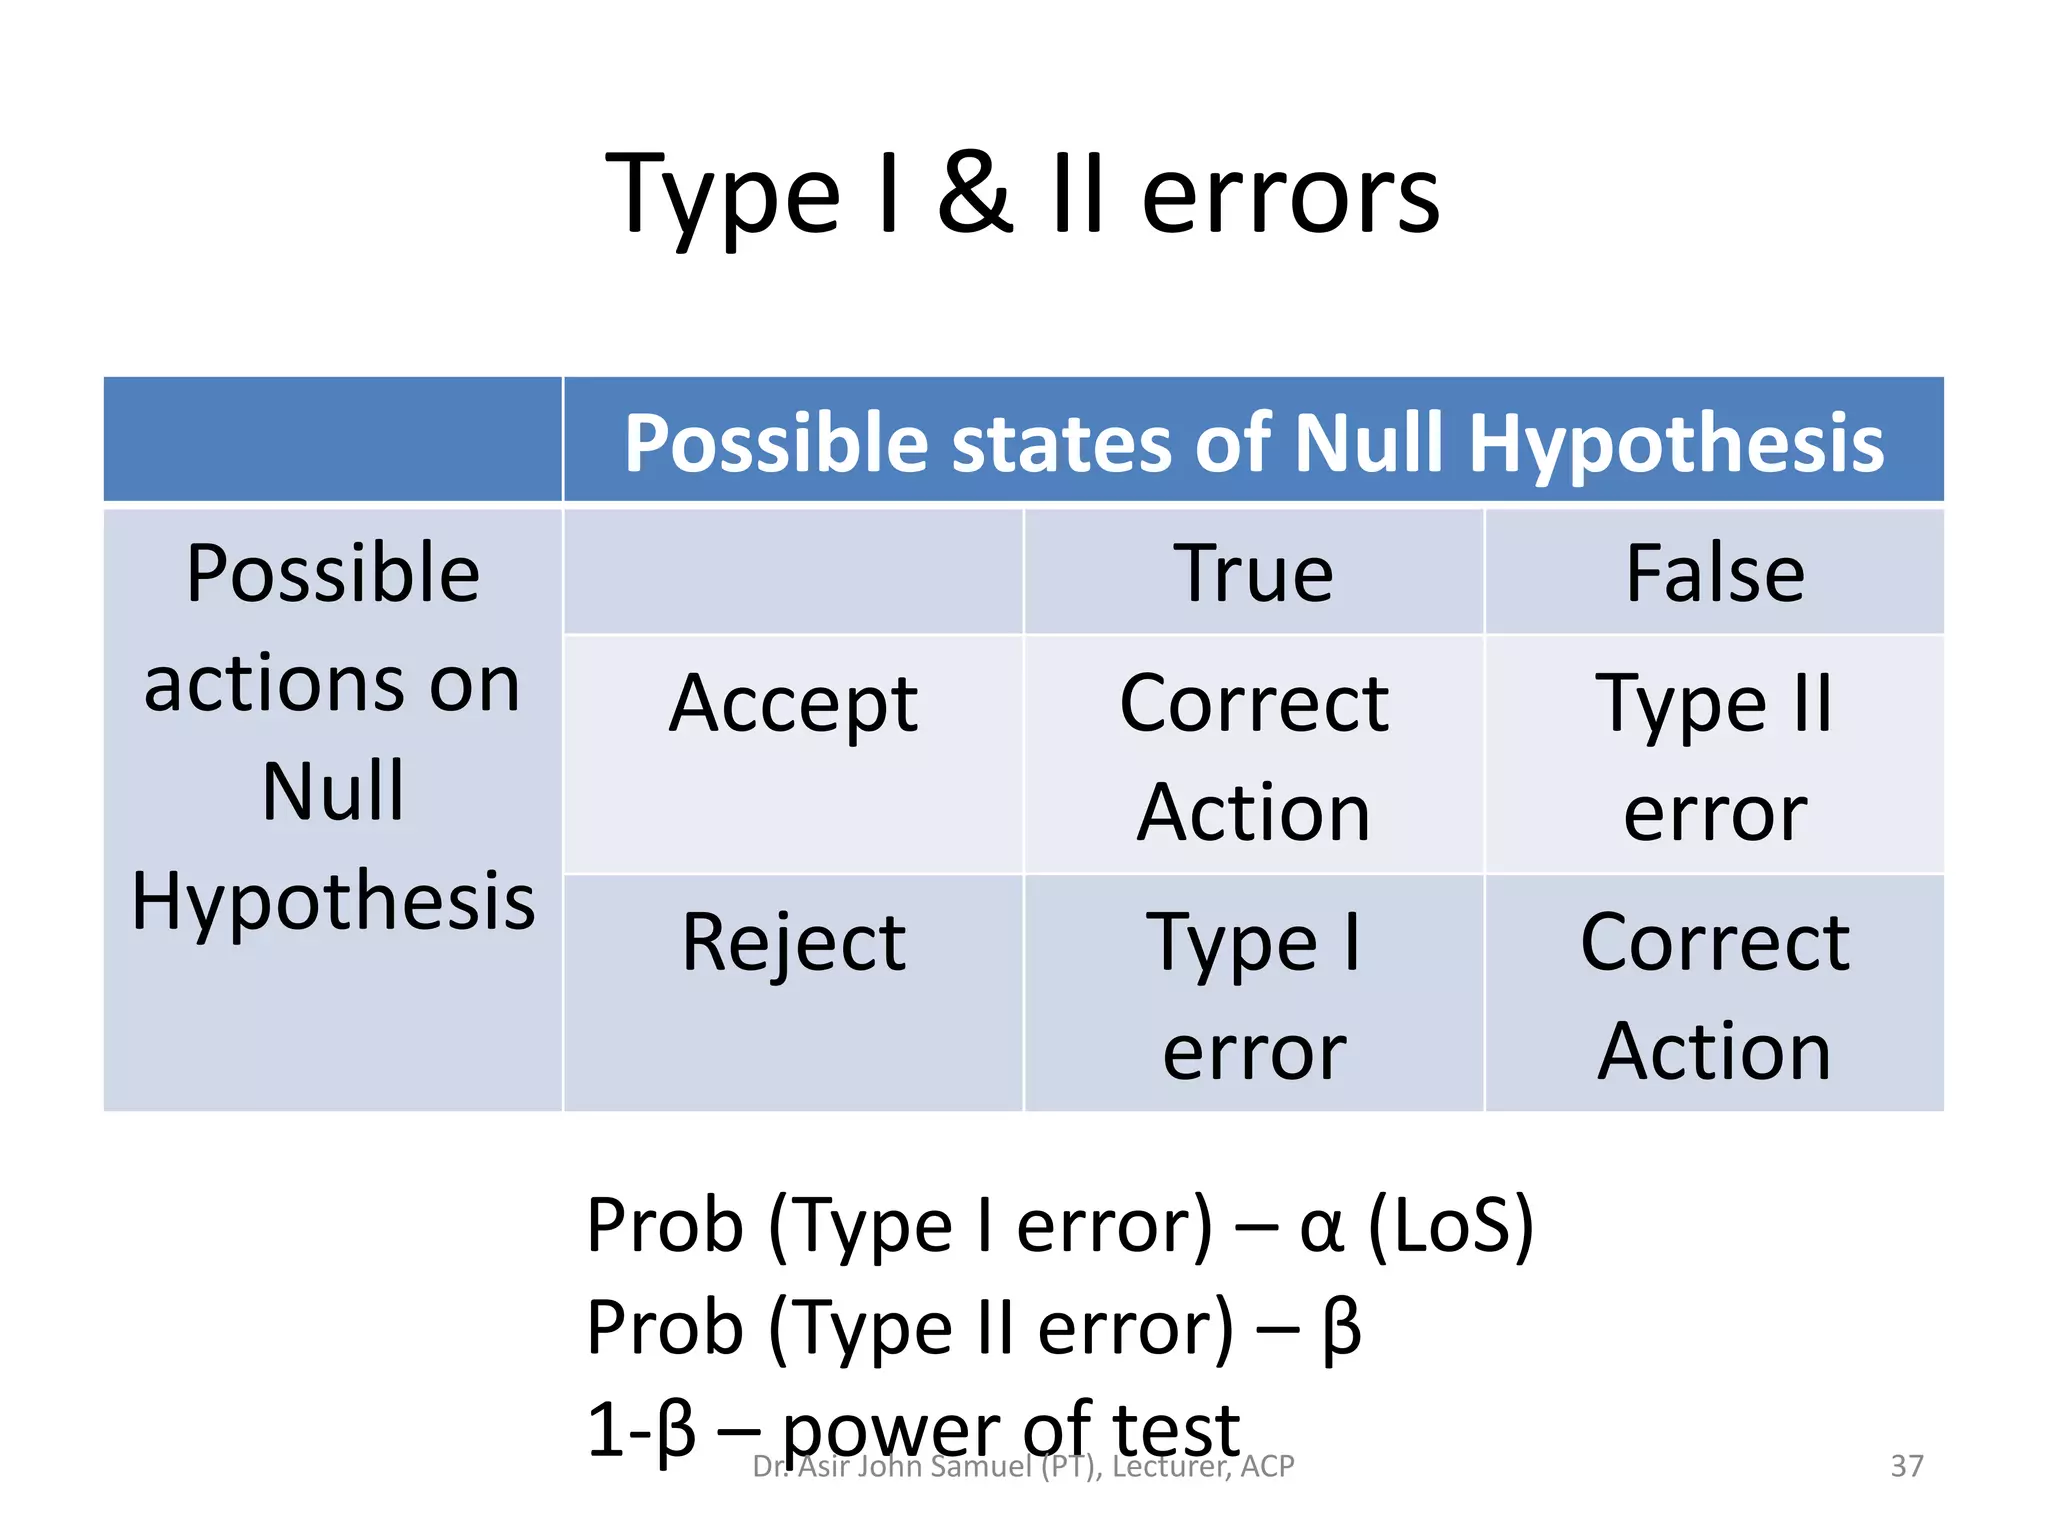
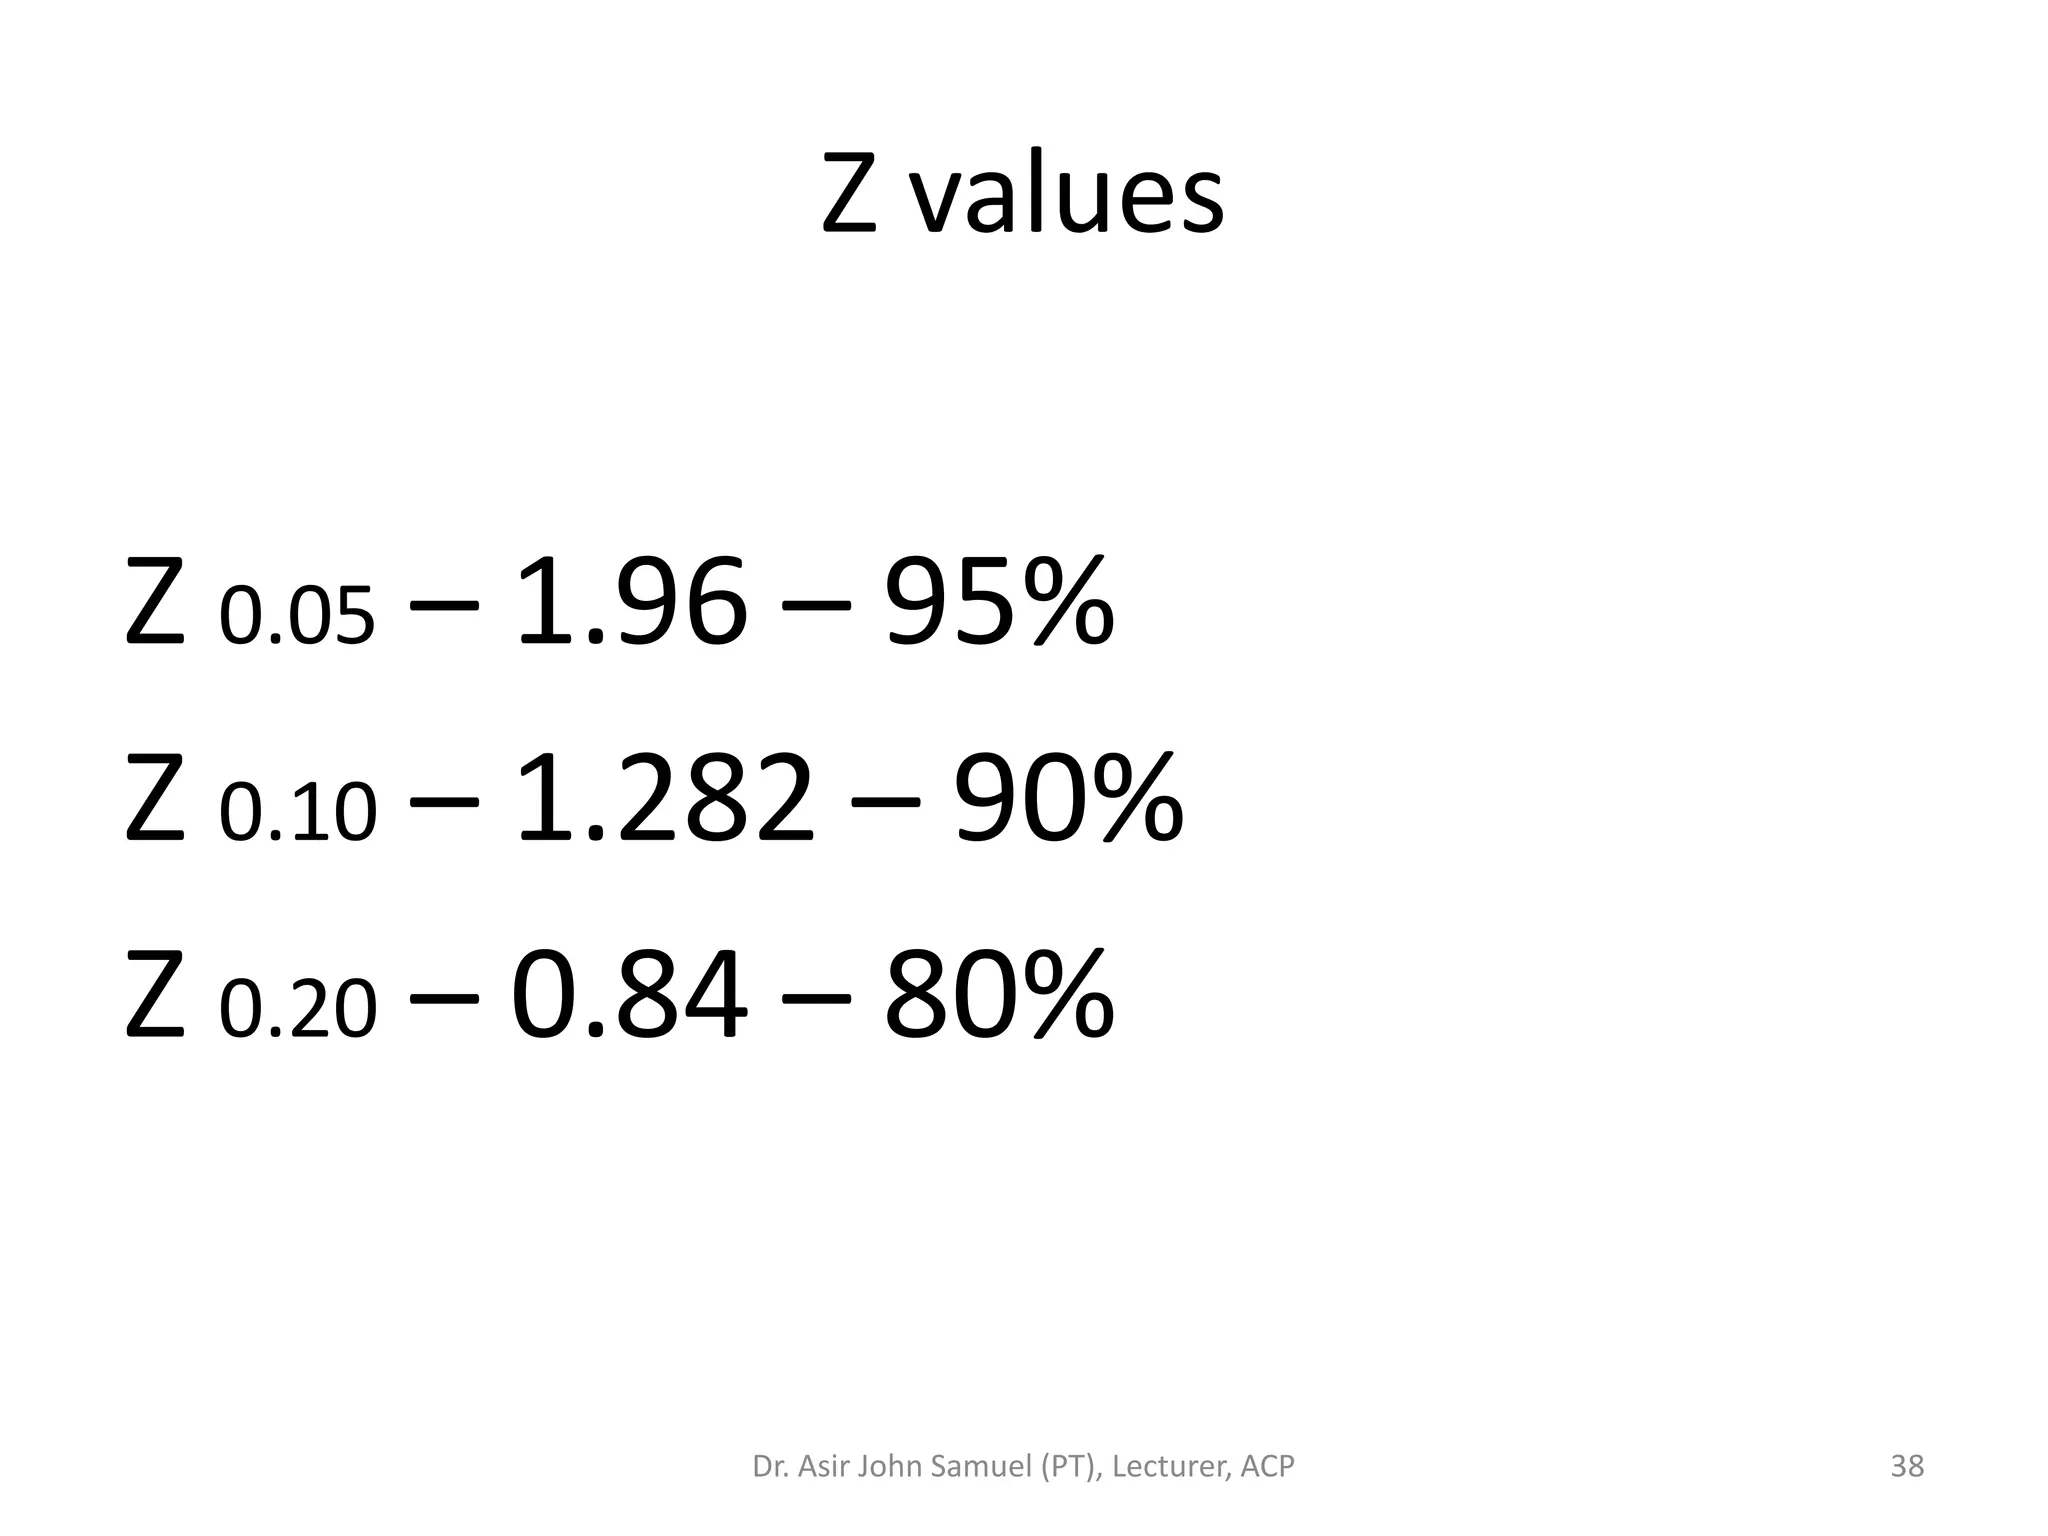
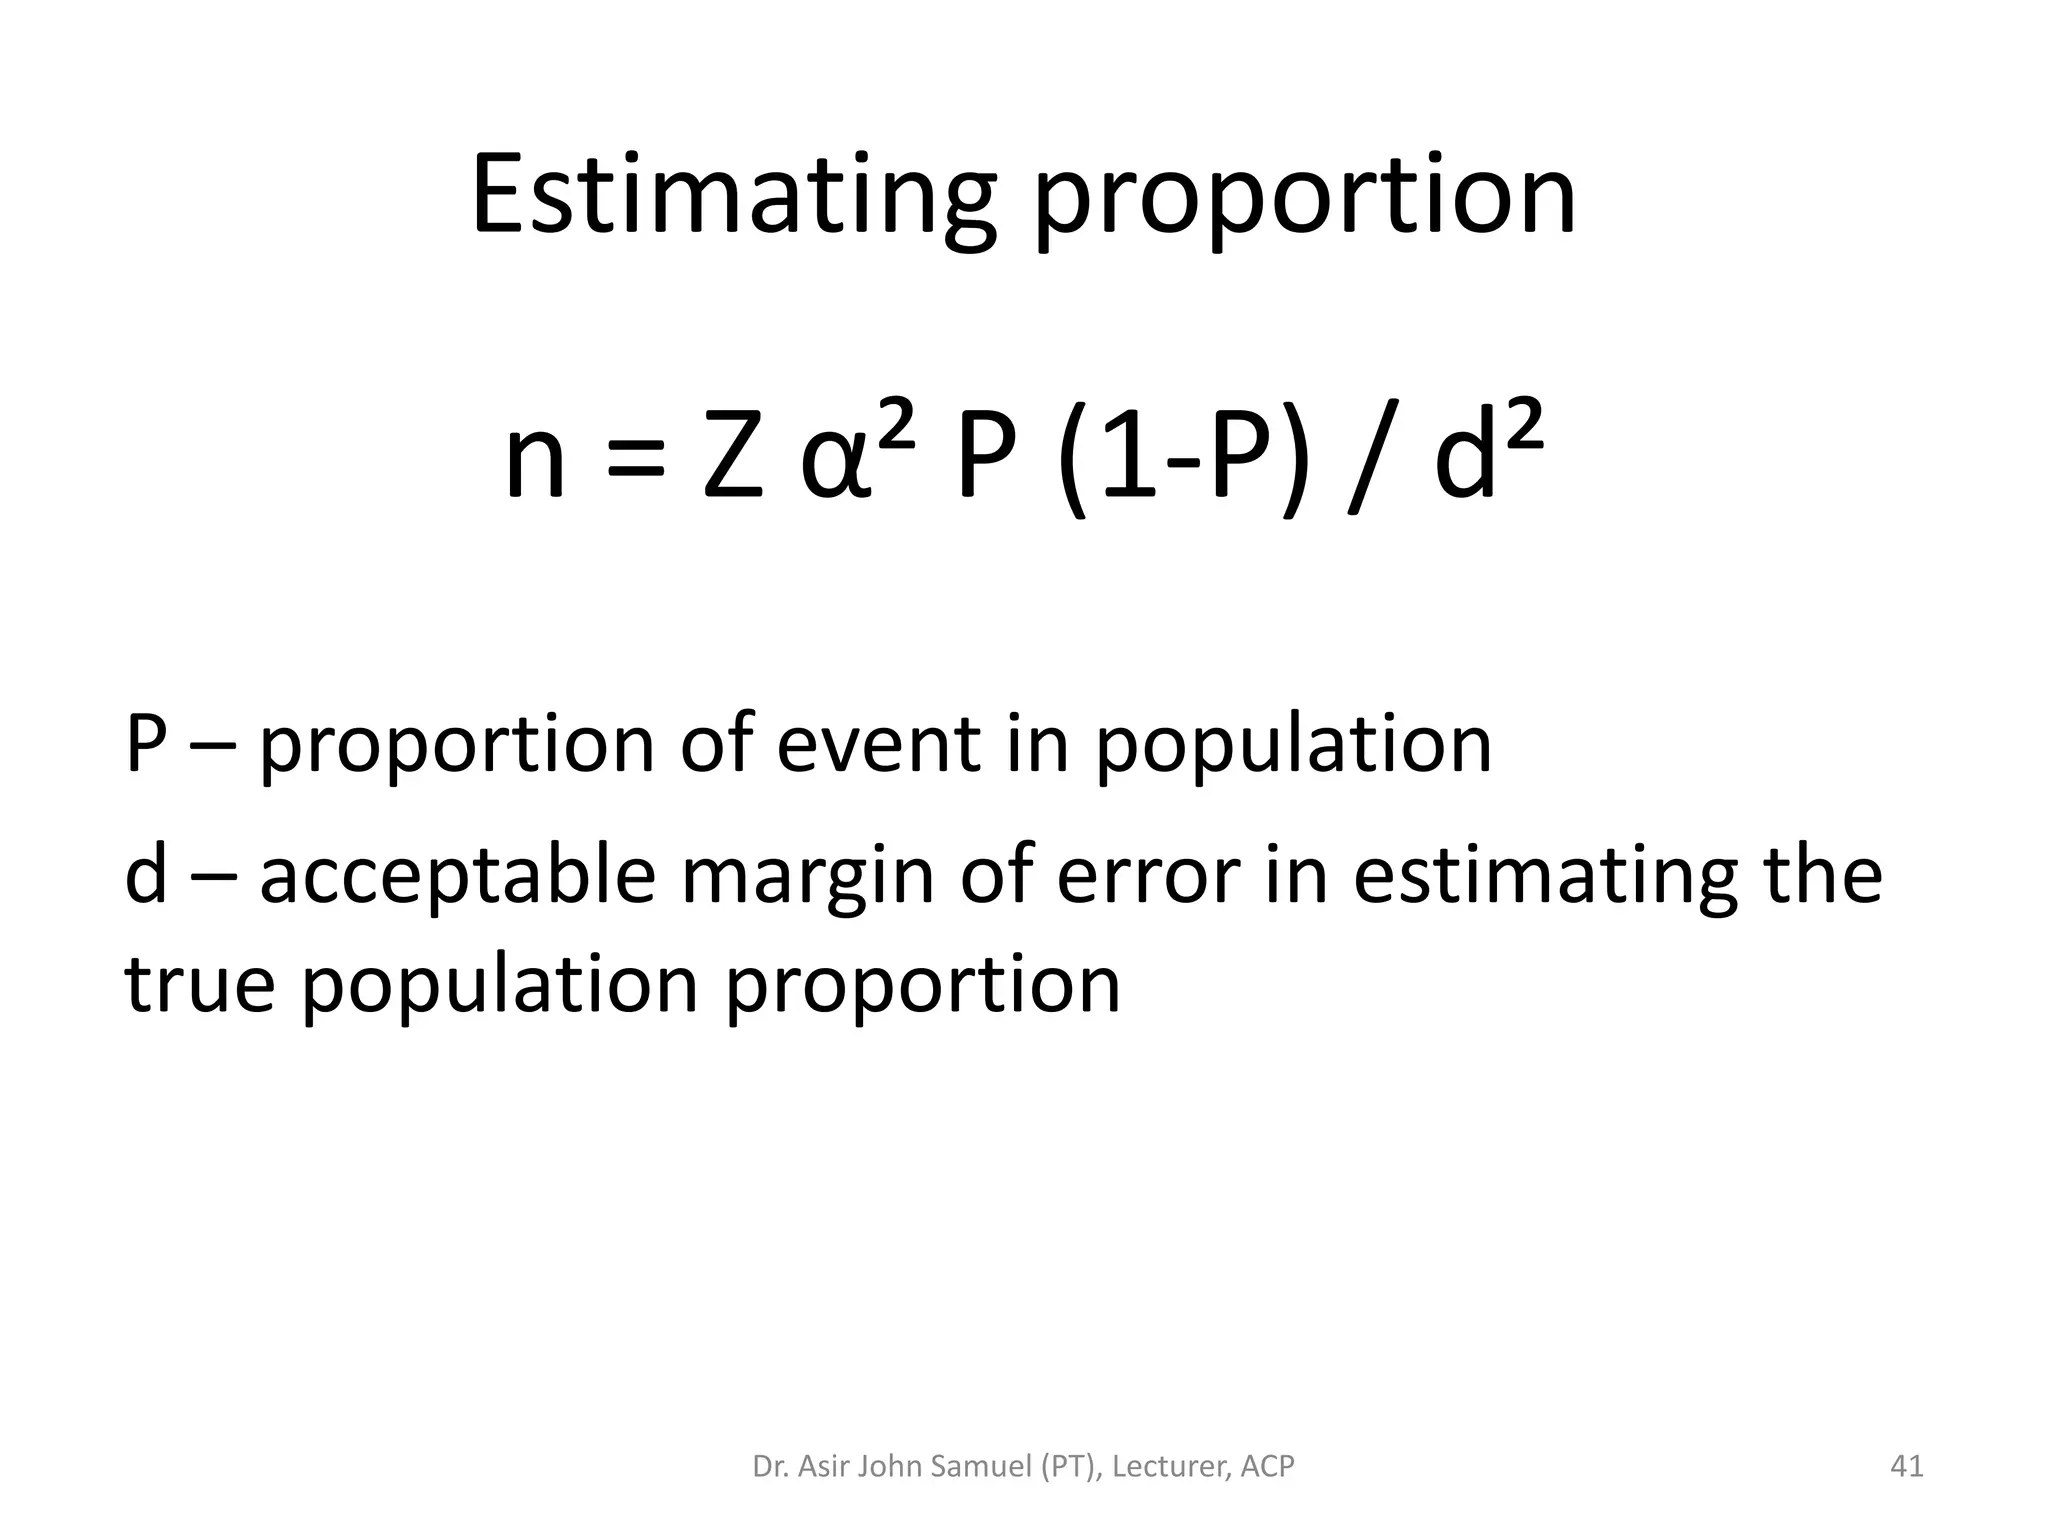
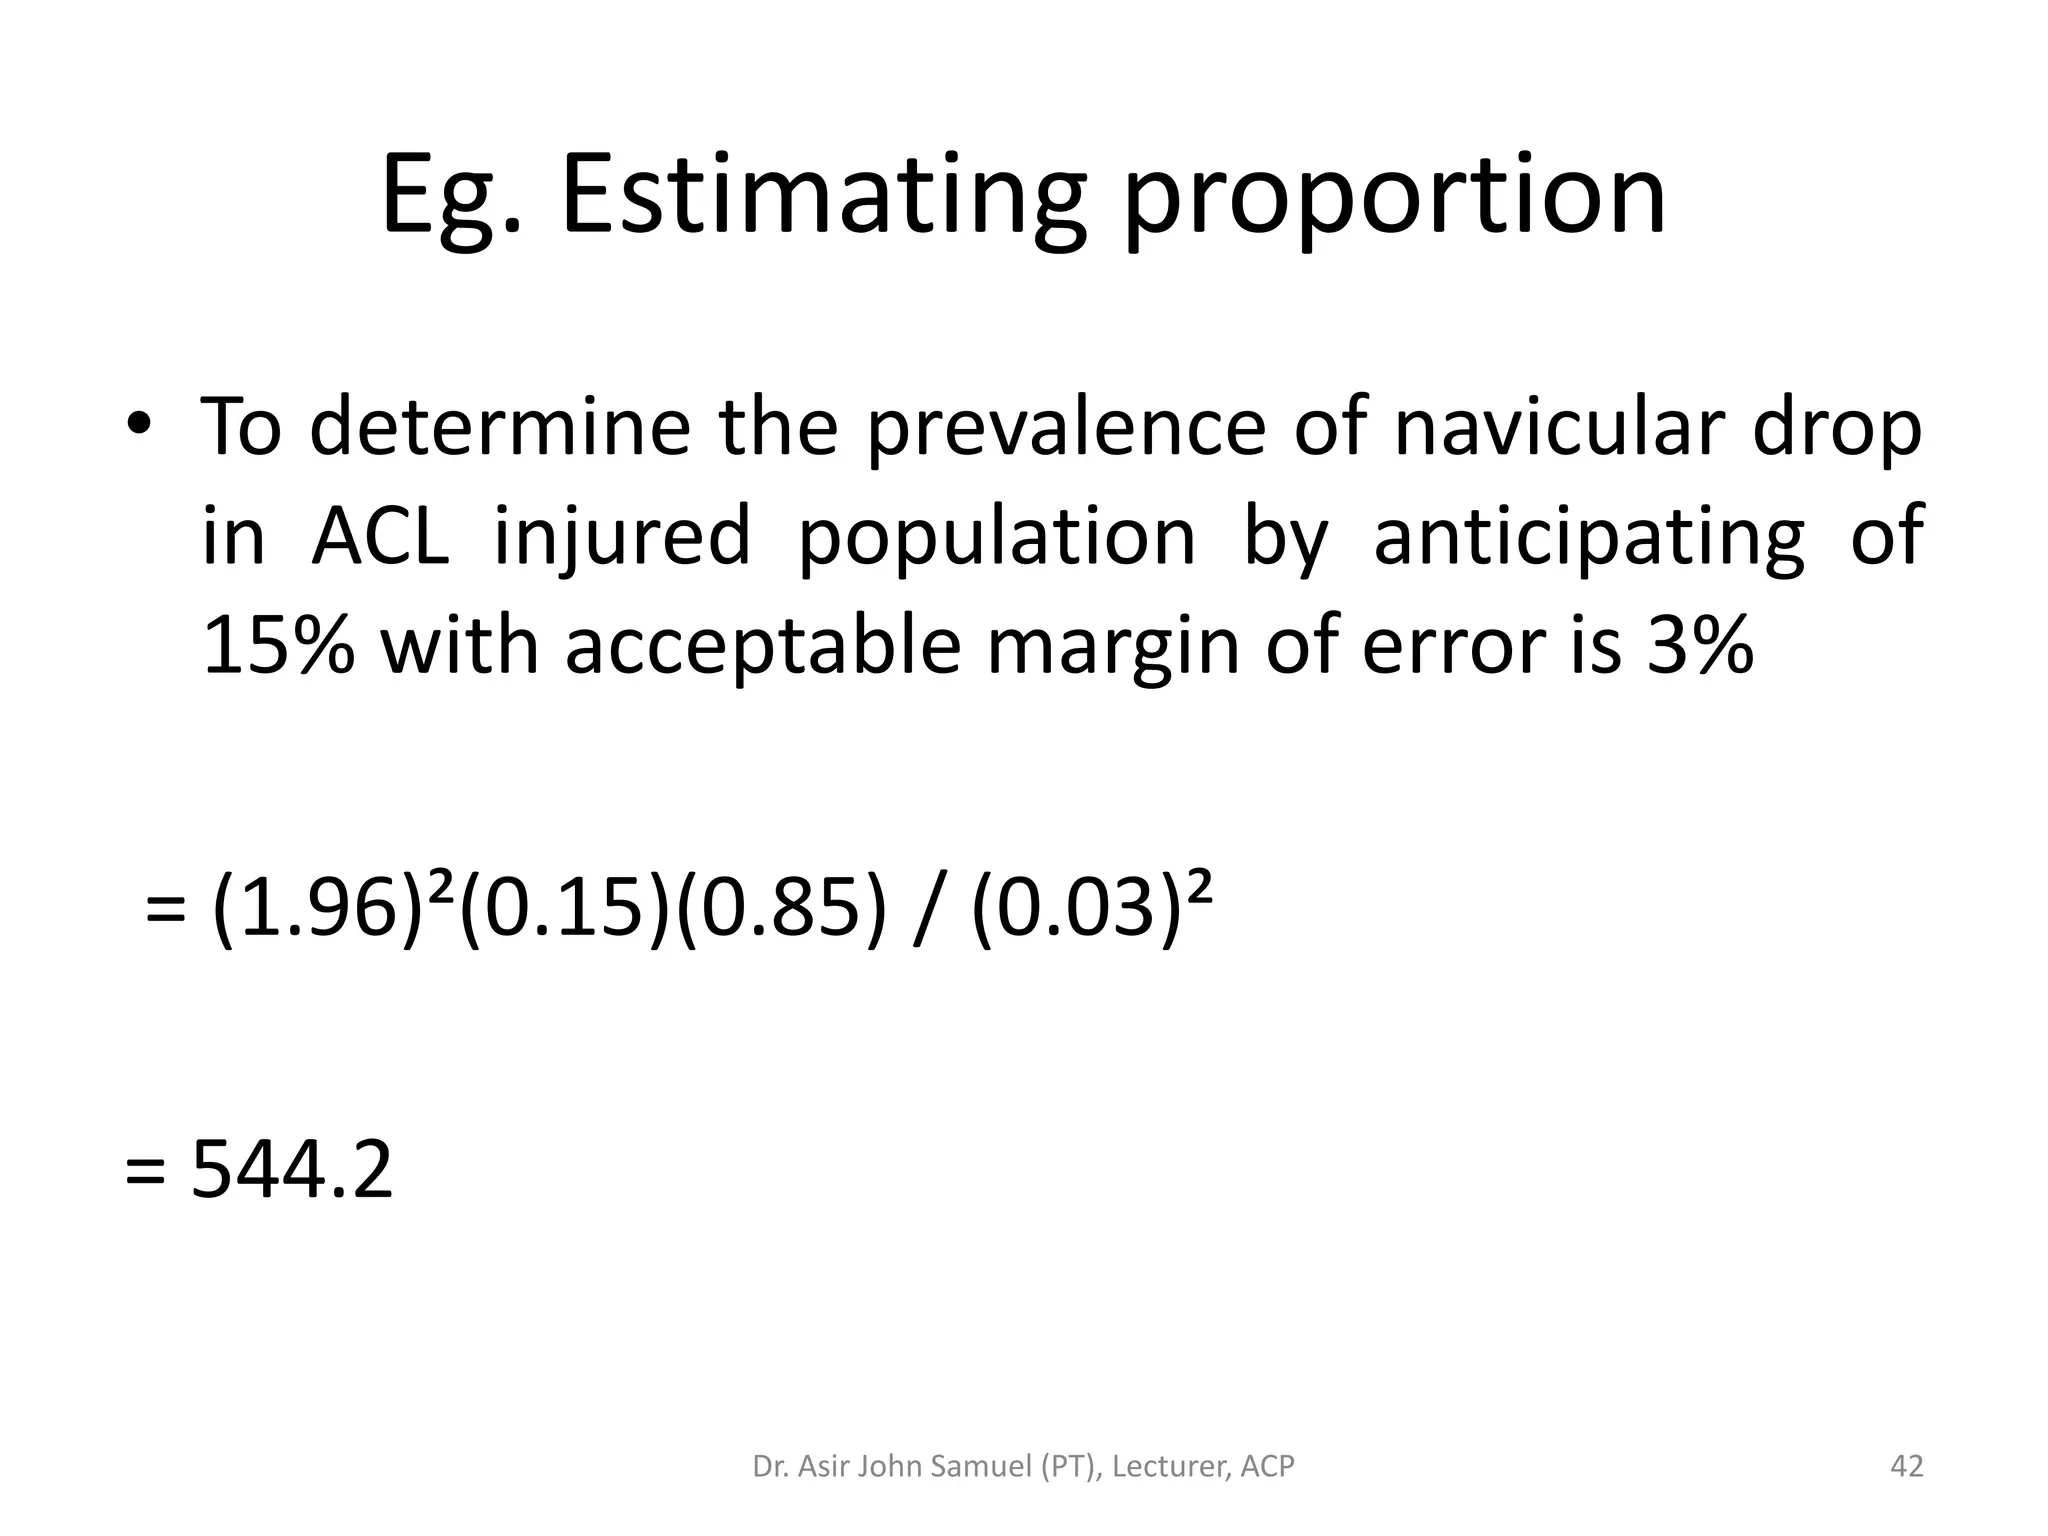
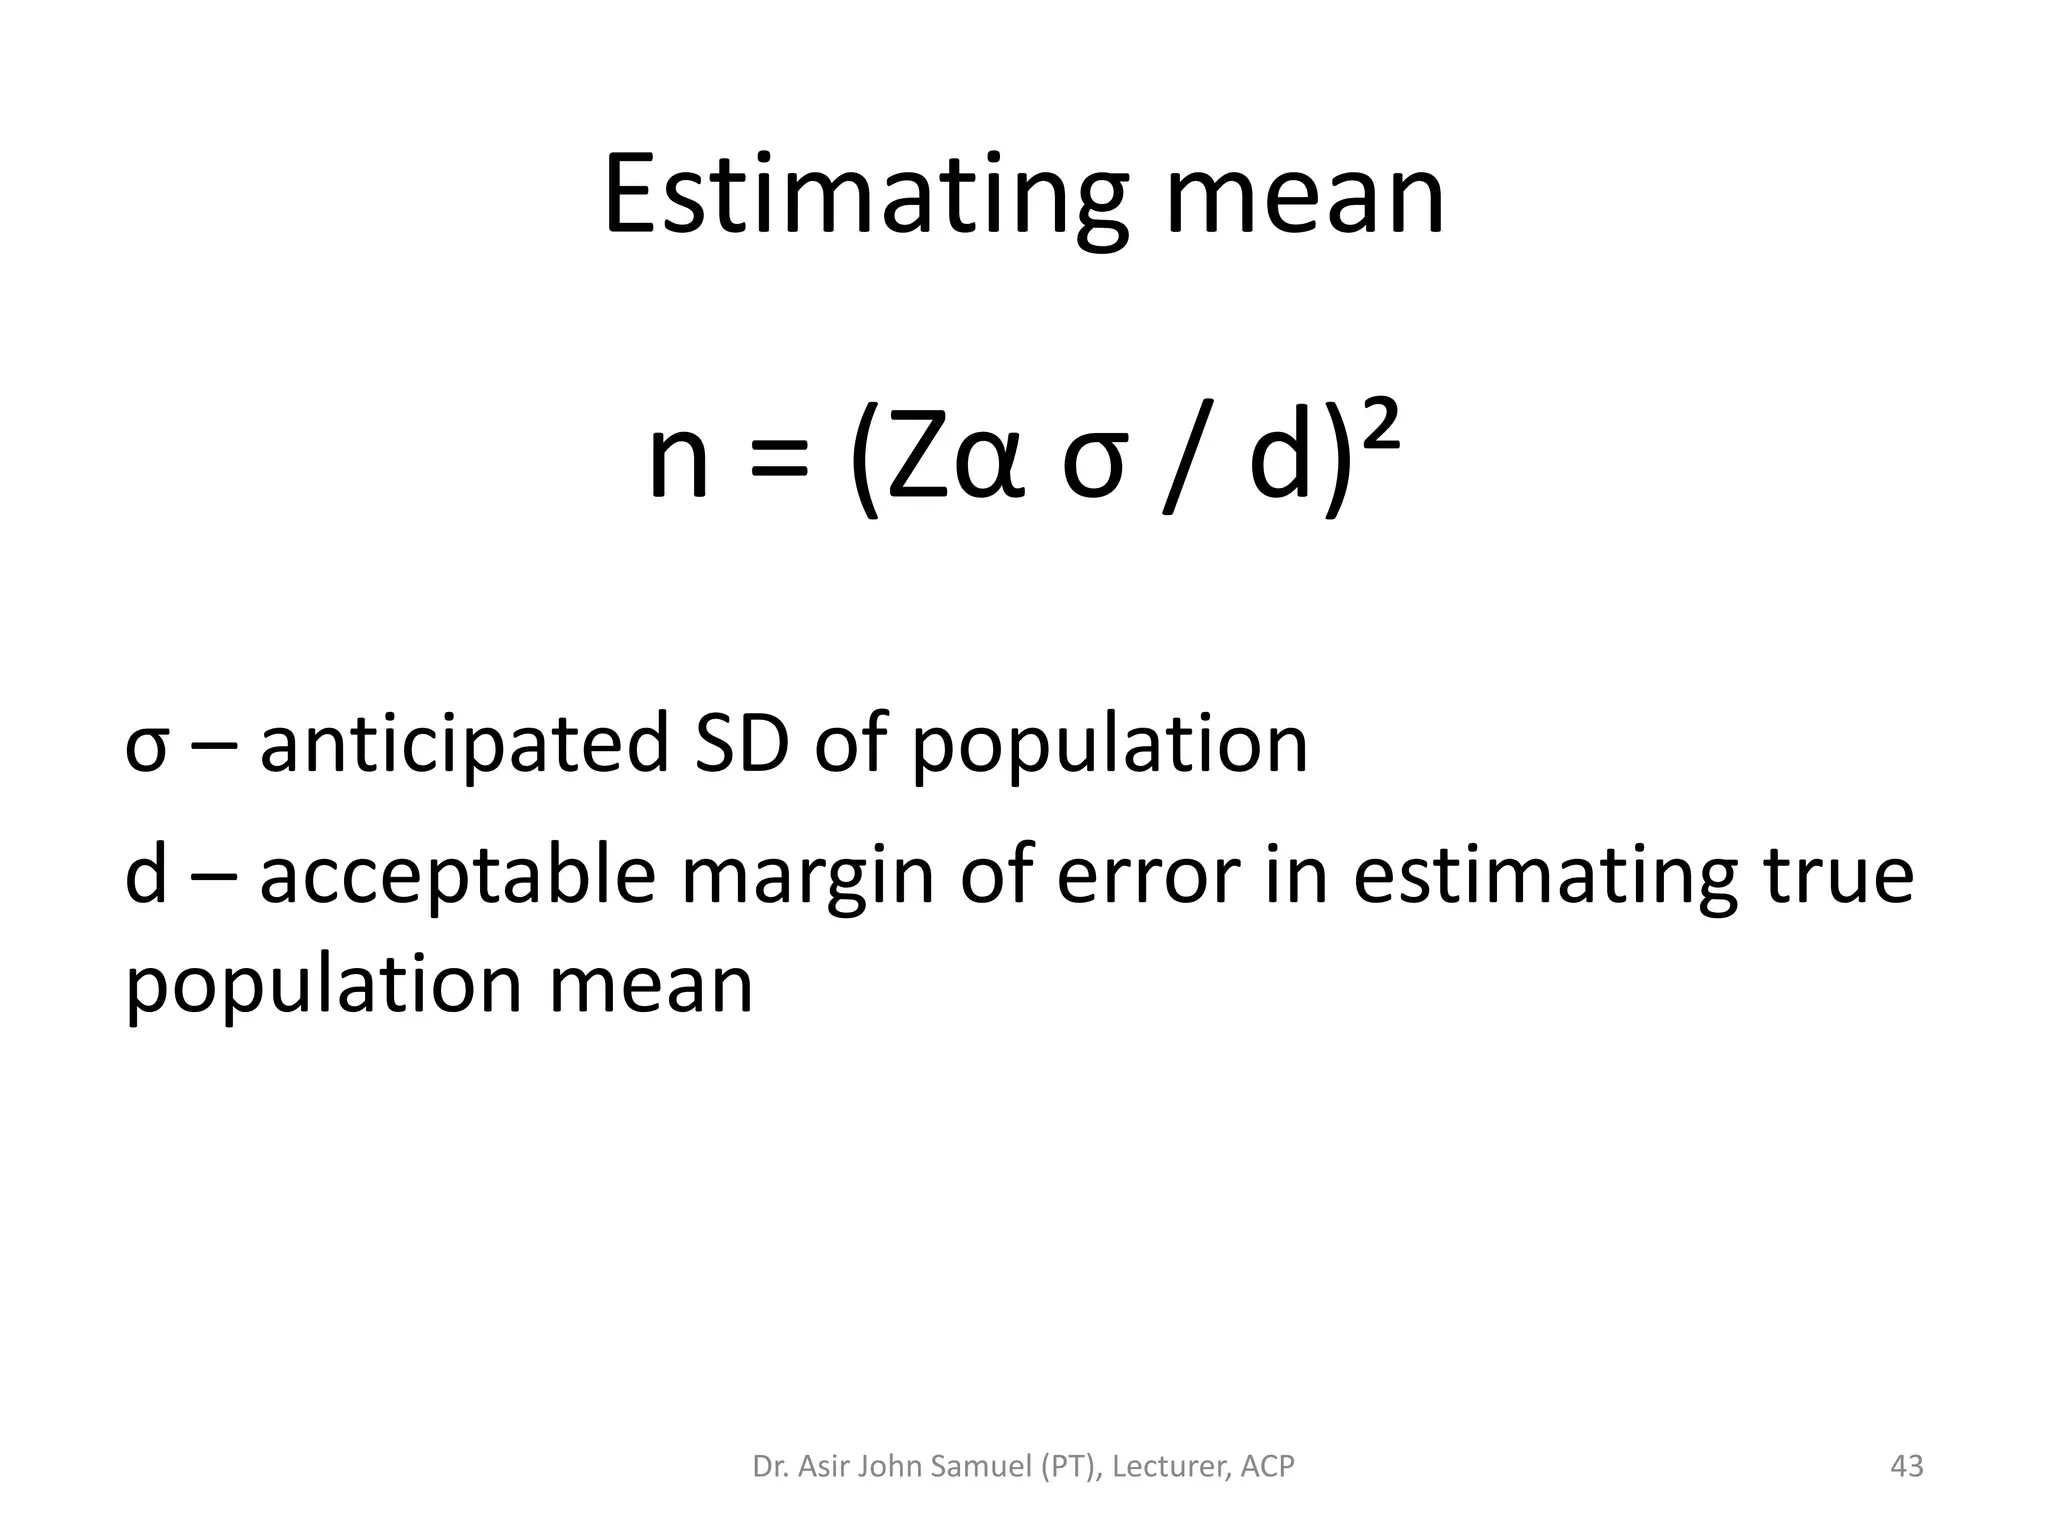
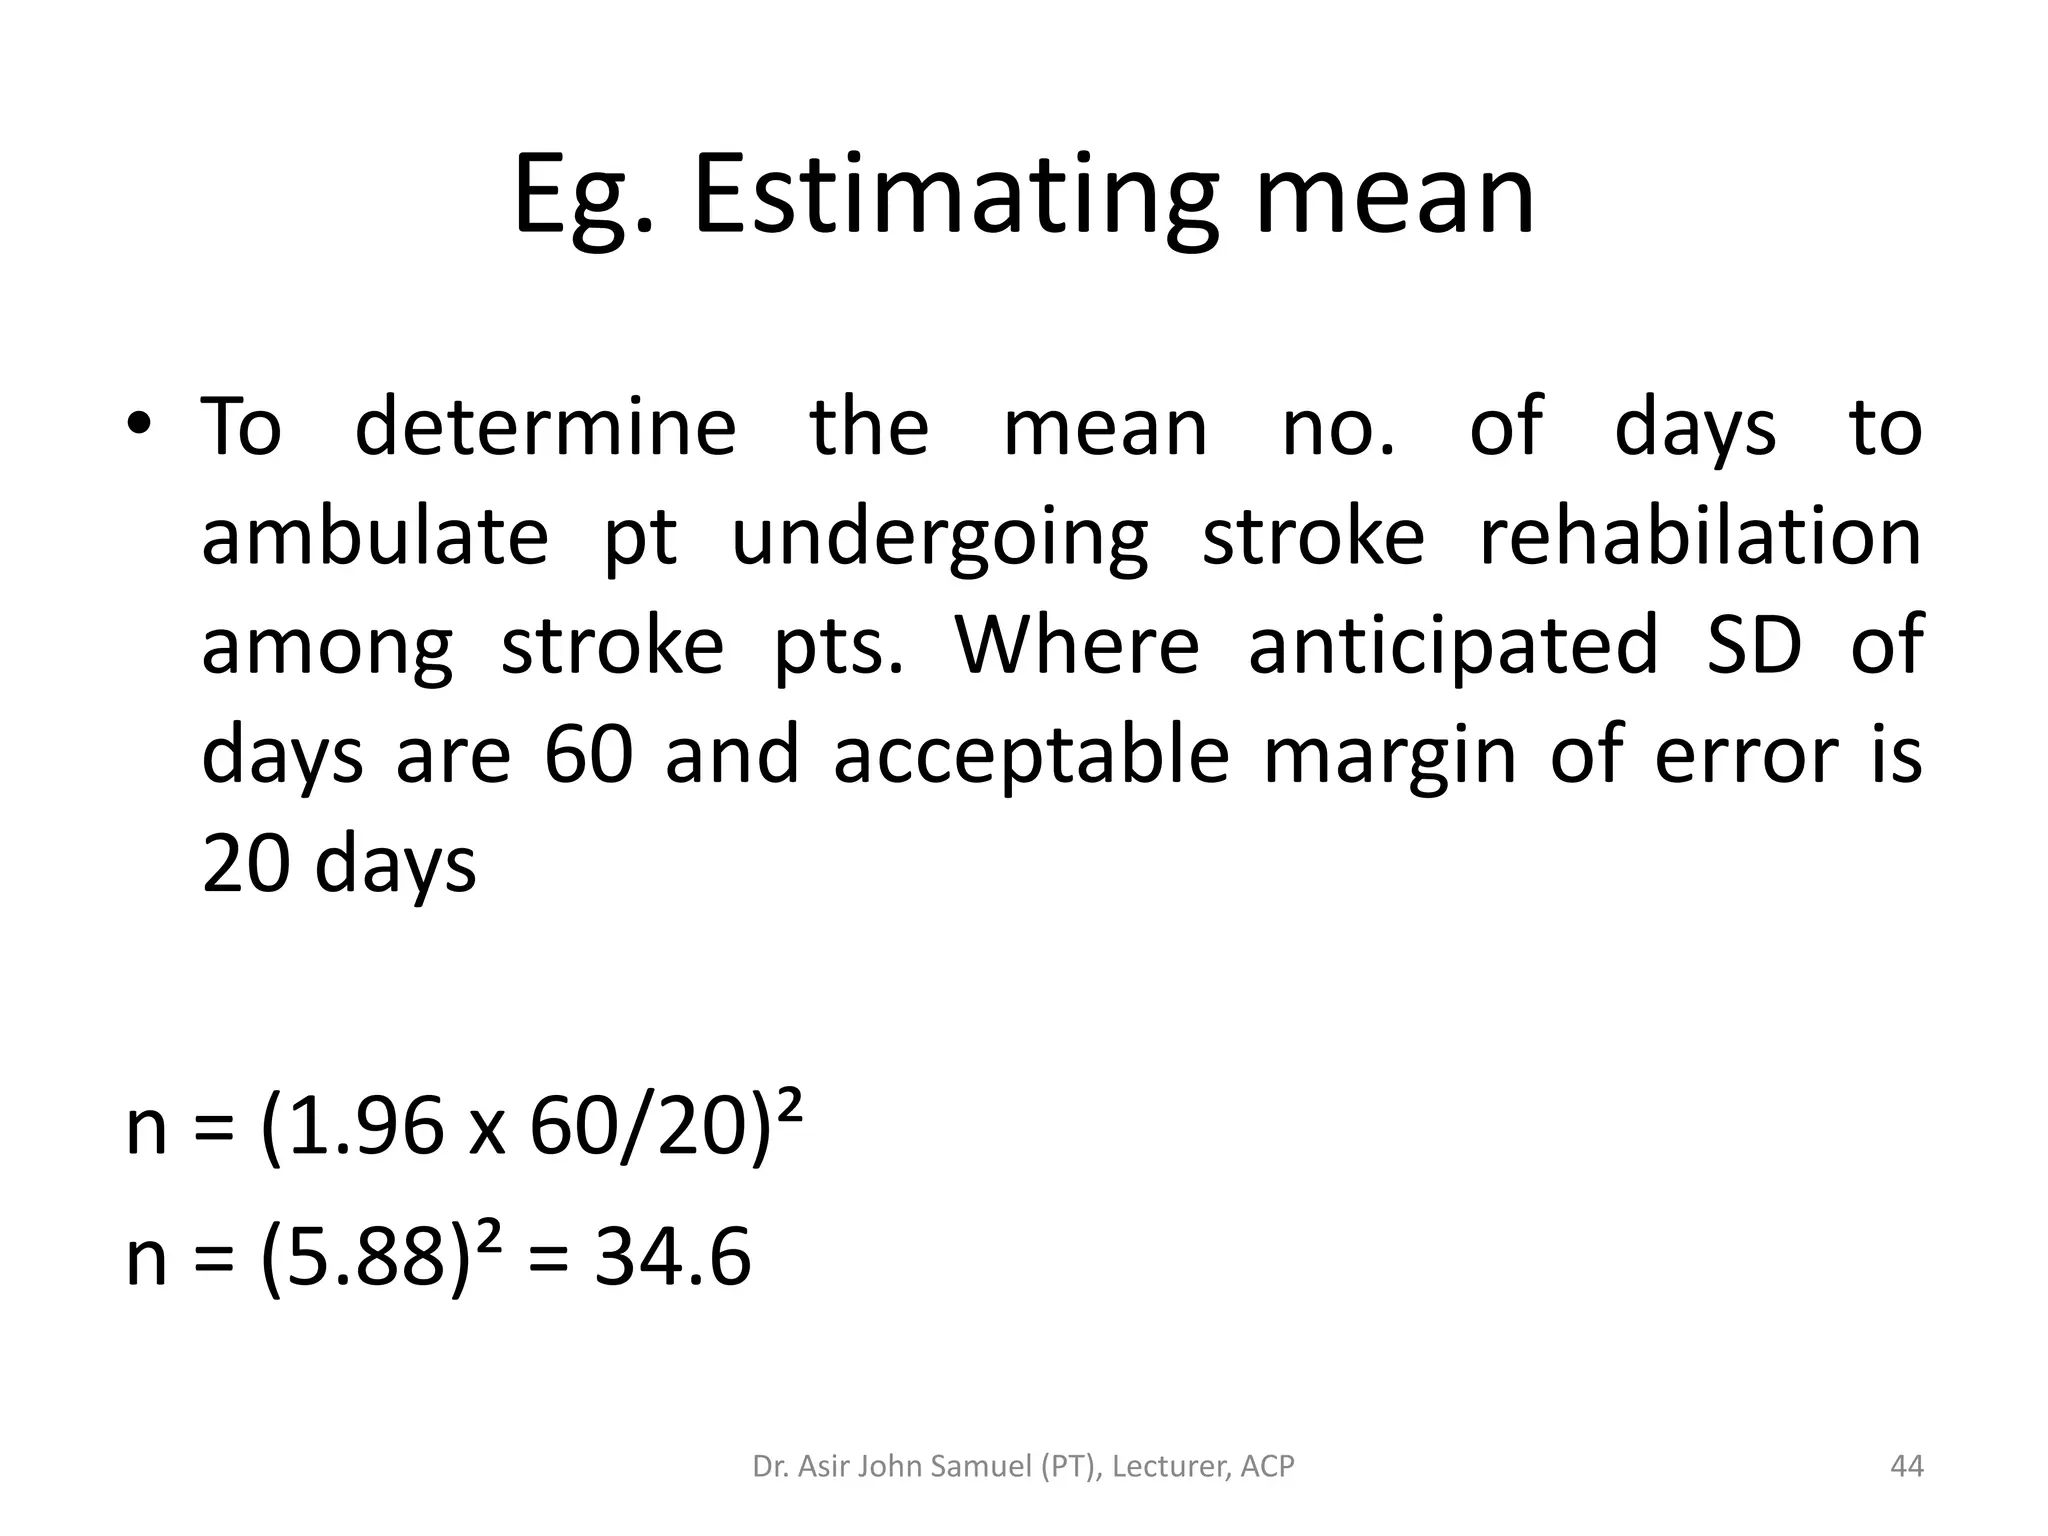
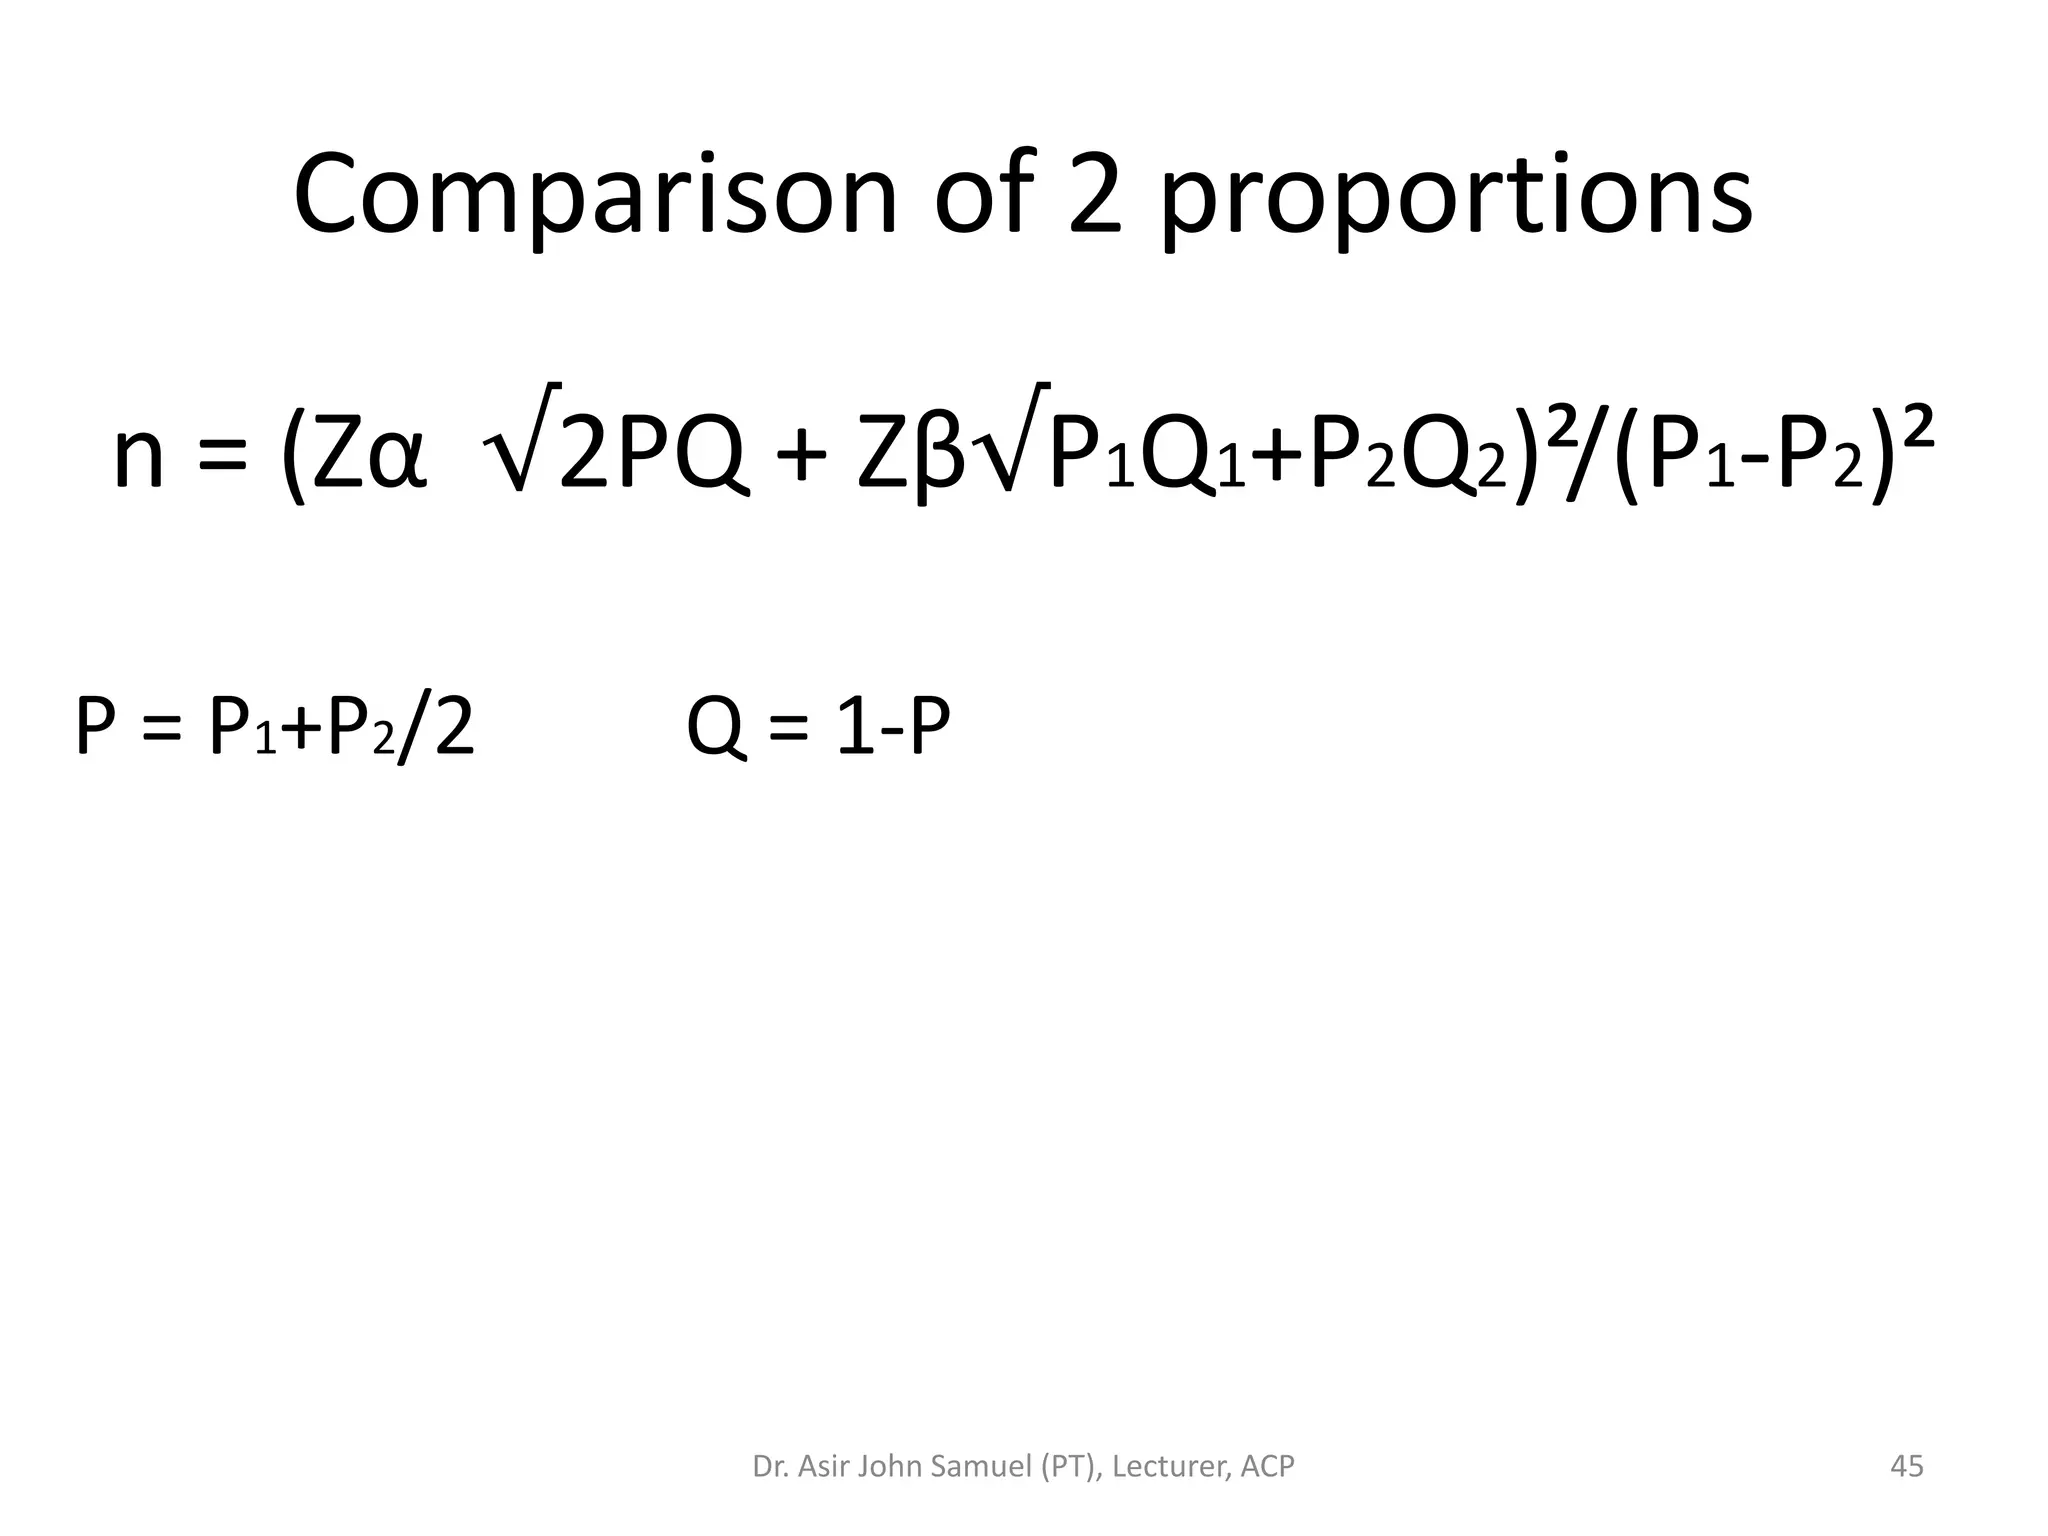
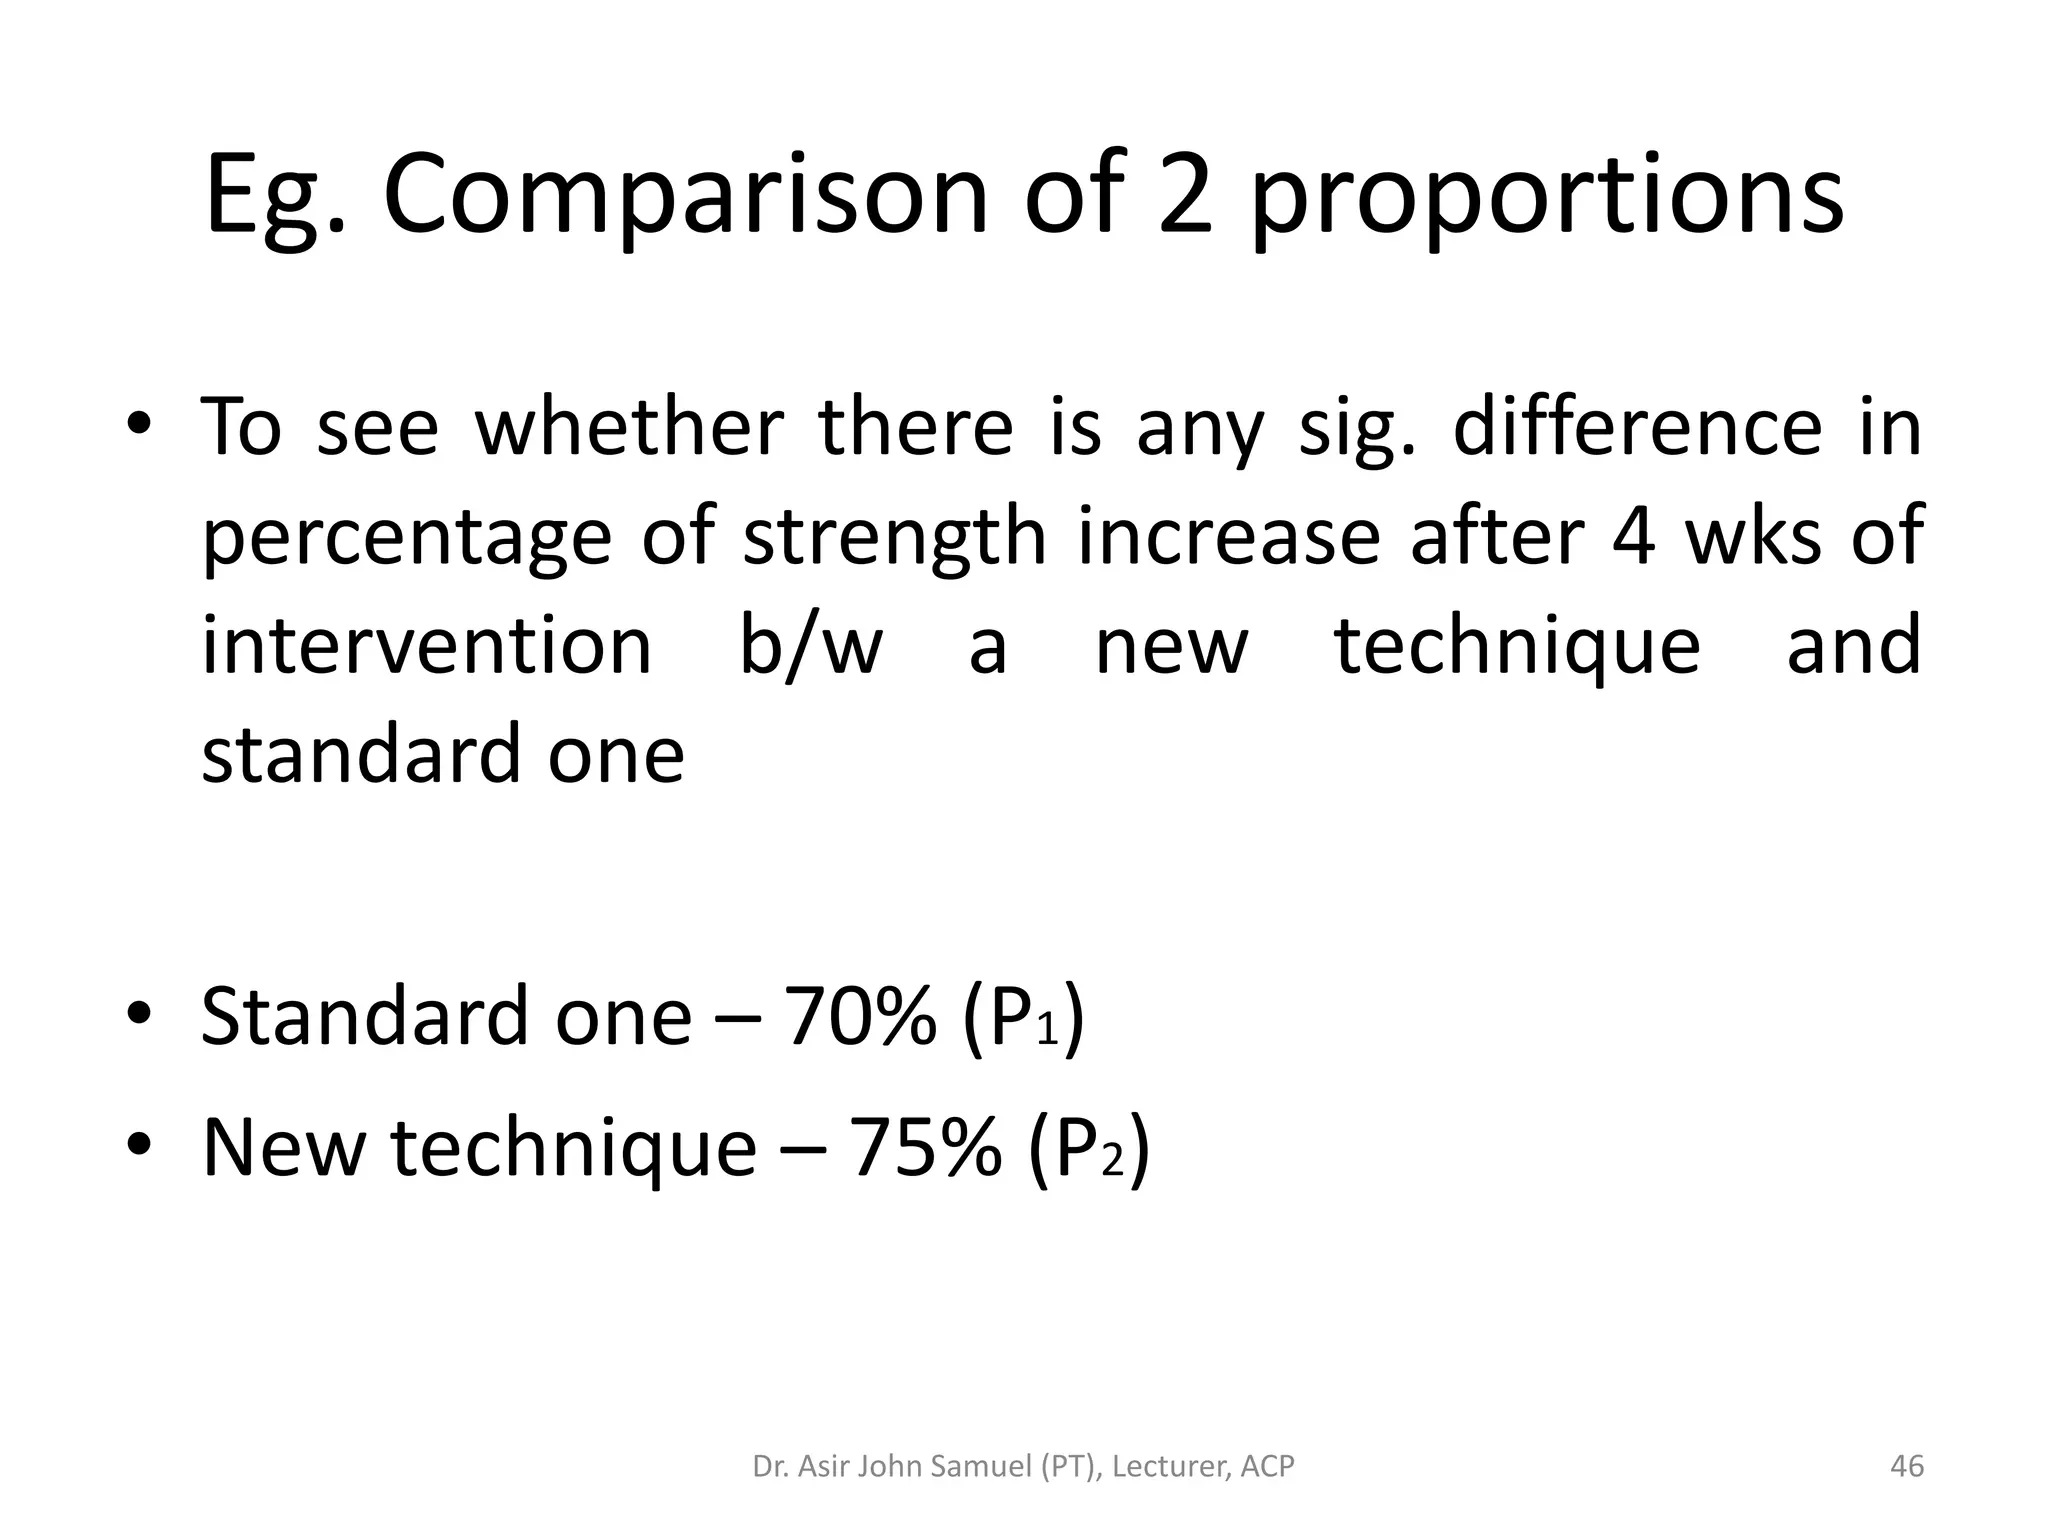
Covers concepts like p-value, hypothesis testing, and methods for estimating sample sizes.


