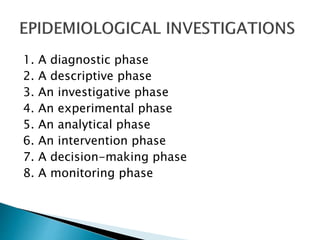
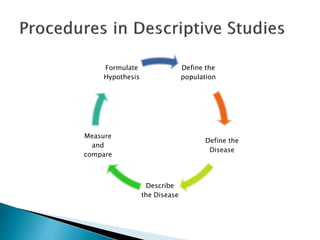
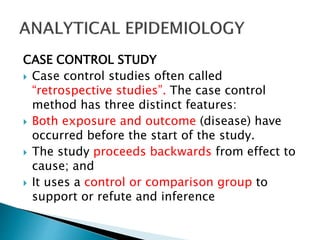
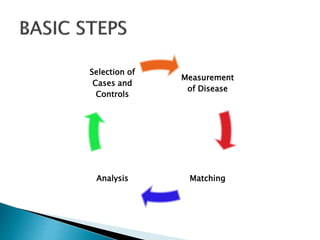
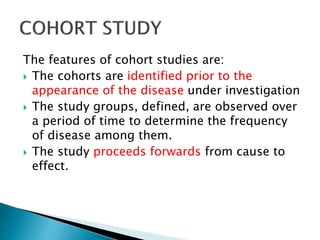
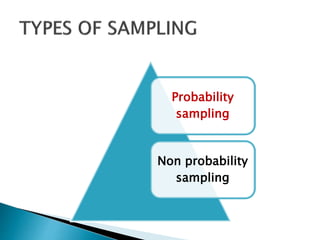
Mrs.Madhurima.D
Community Health Nursing Department
Hindu Mission College of Nursing
 Epidemiology is defined as the study of the
distribution and determinants of health
related states or events in specified
populations and the application of this study
to control the health problems.
John M.Last 1988.
1. A diagnostic phase
2. A descriptive phase
3. An investigative phase
4. An experimental phase
5. An analytical phase
6. An intervention phase
7. A decision-making phase
8. A monitoring phase
Asking questions
Making comparisons
 What is the event?
 What is the magnitude?
 Where did it happen?
 When did it happen?
 Who are affected?
 Why did it happen?
 What can be done to reduce the problem and
its consequences?
 How can it be prevented?
 What action to be taken by the community?
 OBSERVATIONAL STUDIES
 EXPERIMENTAL STUDIES
 Descriptive Studies
 Analytical Studies
◦ Ecological or co-relational- with Populations as
unit of study
◦ Cross-sectional or prevalence -with Individuals
as unit of study
◦ Case control or case reference - with Individuals
as unit of study
◦ Cohort or follow-up - with individuals as unit of
study
 Randomized Control Trials
 Field Trials
 Community Trials
 Descriptive studies are usually the first phase
of an epidemiological investigation. These
studies are concerned with observing the
distribution of disease or health-related
characteristics in human populations and
identifying the characteristics with which the
disease in question seems to be associated.
Define the
population
Define the
Disease
Describe
the Disease
Measure
and
compare
Formulate
Hypothesis
CASE CONTROL STUDY
 Case control studies often called
“retrospective studies”. The case control
method has three distinct features:
 Both exposure and outcome (disease) have
occurred before the start of the study.
 The study proceeds backwards from effect to
cause; and
 It uses a control or comparison group to
support or refute and inference
Measurement
of Disease
MatchingAnalysis
Selection of
Cases and
Controls
The features of cohort studies are:
 The cohorts are identified prior to the
appearance of the disease under investigation
 The study groups, defined, are observed over
a period of time to determine the frequency
of disease among them.
 The study proceeds forwards from cause to
effect.
(a) when there is good evidence of an
association between exposure and disease
(b) when exposure is rare, but the incidence of
disease high among exposed
(c) when attrition of study population can be
minimized
(d) when ample funds are available.
 Prospective cohort studies
 Retrospective cohort studies
 A combination of retrospective and
prospective cohort studies
The Steps of a cohort study are:
 Selection of study objects
 Obtaining data on exposure
 Selection of comparison groups
 Follow-up
 Analysis
Types
1. Randomized Control Trials
2. Non-Randomized Trials
 1. Uncontrolled trials
 2. Natural Experiments
 3. Before & after Comparison studies
Target Population
 Target population refers to all the
members who meet the particular
criterion specified for a research
investigation.
 A single entity of any given population which
is not decomposable further is called as an
element.
 An element may be an individual, a
household, a factory, a market place, a
school, etc.
Element depends on nature of population
Population depends on nature of investigation
 A population is said to be homogenous when
its every element is similar to each other in all
aspects.
Example
 if the goal of a research is to investigate
average IQ of the employs of XYZ Company.
The population is homogenous which is
composed of people who work at the
company.
 Elements are not similar to each other in all
aspects.
 Common variables that may differ are gender,
age, ethnicity, socioeconomic status etc.
Example
 To find if the environment of the Company is
satisfactory for its employs. In this case, men
and women are likely to keep different
opinions
 The process through which a sample is
extracted from a population is called as
sampling.
 The more the sample is representative of the
population, the higher is the accuracy of the
inferences and better are the results
generalisable.
 The characteristics of elements selected
are similar to that of entire target
population.
 The findings obtained from sample are
equally true for the entire target
population.
 An incorrect or false representation of the
sample.
 The selected sample does not truly reflect the
characteristics of population
 Economical
 Improved quality of data
 Quick study results
 Precision and accuracy of data
 Representative
 Free from bias and errors
 No substitution and incompleteness
 Appropriate sample size
Probability
sampling
Non probability
sampling
 Every member of the population has a
probability of being included in the sample.
 Also called as random sampling or
representative sampling.
Example:
 The target population is defined as students
of 2015-16 batch of MMC
 It means only those students constitute our
population who study at the college during
the mentioned period.
 Every unit of population does not get an
equal chance of participation in the
investigation.
 It is also called as judgment or non-
random sampling
 The selection of the sample is made on
the basis of subjective judgment of the
investigator
 EXAMPLE :If target population is defined
as college students. It means person
studying at any college of the world is
an element of our population.
PROBABILITY
SAMPLING
 Reduces the
chance of
systematic errors
 Minimize the
chance of
sampling biases.
 Inferences are
generalisable
NON PROBABILITY
SAMPLING
 Need less effort.
 Need less time to
finish up
 Not much costly
Probability sampling
 Need a lot of efforts
 A lot of time is
consumed
 They are expensive.
Non probability sampling
 Encounter with
systematic errors and
sampling biases.
 Cannot be claimed to be
a good representative
 Inferences are not
generalisable
Simple random
sampling
Systematic
random sampling
Stratified random
sampling
Cluster sampling
Multistage
smapling
 Every element of the population has an equal
chance of being selected in the sample.
 Every element must be able to distinguish
from one another and does not have any
overlapping characteristics.
 The population must be homogenous
 Population has to be defined
 Preparation of list of all the elements
 Selection is done through Lottery
method
Or random table
The owner of Company X wants to know if his
employs are satisfied with the quality of food
provided in the company.
 Target population – every person works in the
company (1000)
 Samples needed (100)
 Make a list of employees
 Give numbers to each member
 Select 100 numbers randomly
 People corresponding to the numbers are
samples
BENEFITS
 No possible sampling
bias
 Good representatives
of population
DRAWBACKS
 Very costly and time
consuming
 Needs a lot of efforts
 It is not possible to
get or prepare an
exhaustive list of
elements
 The elements are selected at a regular interval.
 The interval may be in terms of time, space or
order.
 Regularity and uniformity in selection makes the
sampling systematic
 The list of elements may or may not be required
 Population needed to be defined
 If exhaustive list is available, It is arranged/
numbered in an order 1 to N.
 Population contains N number of elements and
we need a sample of n size.
 Divide N by n. the answer is K and gives the
appropriate interval size
 For eg if population is 300 elements and we need
30 participants,
300/30=10
 Interval size will be 10 so we need to select every
tenth element
A super market has been advertised through bill board
a few meters away from its existence. The owner
wants to know how much this advertisement has
contributed to bring the costumer to the market.
 Population – every person who visits the super
market
 Exhaustive list – not possible
 Include any no of population –eg 3rd or 5th
 Every 10th person from the 3rd is taken as the
samples – eg 13th, 23rd, 33rd
Benefits:
 Extension of sample to the whole population
 way to get a random and representative sample in
the situation where prior listing up of elements is
not possible.
Draw Backs:
 It may be very costly and time consuming
 It needs a lot of efforts especially for a large
population.
 If the order of the list is biased in some way,
systematic error may occur.
 This is used when population is heterogeneous.
 Sub groups are formed that are homogenous
 The sub groups are called as strata (single
stratum)
 The topic and nature of the investigation tells on
what criterion the strata are to be made.
 gender,age, ethnicity,socioeconomic status.
 For eg., if an investigation is taking young
adults into account,
 This population need to be divided into sub
groups like
 male and female
 educated and uneducated
 high income and low income etc.
 Each stratum is a different population
 Define the population
 Describe the criterions to select the sub-
strata
 Make a list of population
 Select the samples using lottery or
stratified random sampling
The owner of a chain of schools wants to
know what percentages on an average
have been obtained by his grade 10
students in the Board examination. He
has six branches of his schools.
 The target population - every student who
studies in grade 10 of any branch of the
school.
 population is heterogeneous
 The 6 schools are divided into 6 sub groups
or strata.
 Students are now randomly selected from
each stratum using systematic random or
simple random sampling.
Benefits:
 For a heterogeneous population it
produces a representative sample
Draw Backs
 It needs a lot of efforts.
 It is costly and time consuming
 If the criterion characteristic/ variable
used for classification is not selected
correctly, the whole research may go in
vain.
 The group of elements residing in one
geographical region is called as cluster.
 Sampling of clusters is called as cluster sampling.
 It is used when the elements of population are
spread over a wide geographical area.
 The population is divided into sub-groups called
as clusters on the basis of their geographical
allocation.
 First divide the population into clusters.
 Random selection of clusters.
 The selected clusters are visited.
 All the elements (may be individuals,
households, schools, markets etc. depending
on the nature of investigation) within the
selected clusters are investigated.
Education department wants to inspect quality of
education in schools of ABC City.
There are twenty five thousand schools in the city;
the researcher wants to take a sample of 1000
schools.
 The city’s population is divided into 21 towns;
thus into 21 clusters.
 A number is allotted to each cluster.
 Then 7 clusters are selected using simple random
sampling.
Advantage:
 Reduce cost as compare to simple random or
systematic random sampling.
 It consumes less time and efforts than
 we get a group of elements in one geographical
region.
Crucial Issues/ Draw Backs:
 lead to sampling biases and systematic errors.
 If clusters are not homogeneous among them, the
final sample may not be representative of the
population.
 Two or more probability techniques are
combined.
 Used when elements of population are spread
over a wide geographical region
 sampling within the sample.
 Several stages of sampling is done
 The final unit or element of population is used in
investigation
 Target population is divided into clusters.
 The clusters are selected randomly.
 These clusters are called as first stage units
or primary units
 These clusters are homogenous among them
but may be heterogeneous inside
 To overcome this heterogeneity, homogenous
sub groups called as strata are formed.
 So the strata are called the second stage units
or sub-units.
 The formation of these strata can be done using
cluster sampling technique or stratified random
sampling technique depending on the nature of
investigation.
 In each stratum the units may need to be further
divided, for instance market places into shops,
buildings into houses etc.
 The final units obtained are investigated.
Example:
 The purpose of a research is to find out the
best seller food products brands of the year in
the country.
 In this case the target population is constituted
by every market where the food products are
sold. So the population is not only spread over
a wide geographical region of the country but
is also dispersed.
 Divides the country into cities; there is a
formation of 150 clusters
 Selects 30 clusters randomly; these form the first
stage units
 The sale of a food product is likely to be
impacted by its price; so there is a possibility
that people belonging to lower and higher
income groups are different in their preference of
food products.
 Thus the researcher divides each city into 3
strata: residence of lower class, middle class and
upper class; these strata form the second stage
units.
 it is not possible to take a random sample of
elements from each stratum
 So, the researcher makes clusters within
each stratum and then randomly selects
clusters from each of the 3 strata.
 These clusters form the final units of the
sample.
 Each element (i.e. food products selling shops
and markets) within the selected clusters are
now approached and investigated.
Advantages:
 It increases cost and time efficacy.
 The technique is also useful in overcoming the
heterogeneity problem within the clusters.
Draw Backs:
 The sample would not be representative of the
population.
 The whole research may go in vain if strata is
not selected appropriately
 Sample size is not fixed
 Investigator usually selects small sample and
tries out to make inferences
 If not drawn the results, adds more subjects
untill clear cut inferences can be drawn.
 Association between smoking and cancer
 Smallest sample is taken to draw inferences,
if unable to draw any inferences, researcher
continues to draw the sample until
meaningful inferences are drawn.
MERITS
 Used to study on smallest representative
sample
 Helps to find out the inferences of the study
DEMERITS
 Not possible to study a phenomenon which
needs to be study at one point of time
 Requires repeated entries into the field to
collect the sample
 If population is finite --- probability
sampling
 If population is infinite ….. Non probability
sampling
 If population is homogenous, & list of elements
is available……. Simple random sampling
 If population is homogenous, list of elements
cannot be produced…….. Systematic random
sampling
 If population is heterogeneous, not widely spread
….. Stratified random sampling
 If target population is homogenous, spread in a
wide geographical area…… cluster sampling
 If population is spread over wide geographical
area…… multistage sampling
Epidemiological approach

Epidemiological approach

  • 1.
    Mrs.Madhurima.D Community Health NursingDepartment Hindu Mission College of Nursing
  • 2.
     Epidemiology isdefined as the study of the distribution and determinants of health related states or events in specified populations and the application of this study to control the health problems. John M.Last 1988.
  • 3.
    1. A diagnosticphase 2. A descriptive phase 3. An investigative phase 4. An experimental phase 5. An analytical phase 6. An intervention phase 7. A decision-making phase 8. A monitoring phase
  • 4.
  • 5.
     What isthe event?  What is the magnitude?  Where did it happen?  When did it happen?  Who are affected?  Why did it happen?
  • 6.
     What canbe done to reduce the problem and its consequences?  How can it be prevented?  What action to be taken by the community?
  • 8.
     OBSERVATIONAL STUDIES EXPERIMENTAL STUDIES
  • 9.
     Descriptive Studies Analytical Studies ◦ Ecological or co-relational- with Populations as unit of study ◦ Cross-sectional or prevalence -with Individuals as unit of study ◦ Case control or case reference - with Individuals as unit of study ◦ Cohort or follow-up - with individuals as unit of study
  • 10.
     Randomized ControlTrials  Field Trials  Community Trials
  • 11.
     Descriptive studiesare usually the first phase of an epidemiological investigation. These studies are concerned with observing the distribution of disease or health-related characteristics in human populations and identifying the characteristics with which the disease in question seems to be associated.
  • 12.
    Define the population Define the Disease Describe theDisease Measure and compare Formulate Hypothesis
  • 13.
    CASE CONTROL STUDY Case control studies often called “retrospective studies”. The case control method has three distinct features:  Both exposure and outcome (disease) have occurred before the start of the study.  The study proceeds backwards from effect to cause; and  It uses a control or comparison group to support or refute and inference
  • 14.
  • 15.
    The features ofcohort studies are:  The cohorts are identified prior to the appearance of the disease under investigation  The study groups, defined, are observed over a period of time to determine the frequency of disease among them.  The study proceeds forwards from cause to effect.
  • 16.
    (a) when thereis good evidence of an association between exposure and disease (b) when exposure is rare, but the incidence of disease high among exposed (c) when attrition of study population can be minimized (d) when ample funds are available.
  • 17.
     Prospective cohortstudies  Retrospective cohort studies  A combination of retrospective and prospective cohort studies
  • 18.
    The Steps ofa cohort study are:  Selection of study objects  Obtaining data on exposure  Selection of comparison groups  Follow-up  Analysis
  • 19.
    Types 1. Randomized ControlTrials 2. Non-Randomized Trials
  • 20.
     1. Uncontrolledtrials  2. Natural Experiments  3. Before & after Comparison studies
  • 21.
    Target Population  Targetpopulation refers to all the members who meet the particular criterion specified for a research investigation.
  • 22.
     A singleentity of any given population which is not decomposable further is called as an element.  An element may be an individual, a household, a factory, a market place, a school, etc. Element depends on nature of population Population depends on nature of investigation
  • 24.
     A populationis said to be homogenous when its every element is similar to each other in all aspects. Example  if the goal of a research is to investigate average IQ of the employs of XYZ Company. The population is homogenous which is composed of people who work at the company.
  • 25.
     Elements arenot similar to each other in all aspects.  Common variables that may differ are gender, age, ethnicity, socioeconomic status etc. Example  To find if the environment of the Company is satisfactory for its employs. In this case, men and women are likely to keep different opinions
  • 27.
     The processthrough which a sample is extracted from a population is called as sampling.  The more the sample is representative of the population, the higher is the accuracy of the inferences and better are the results generalisable.
  • 29.
     The characteristicsof elements selected are similar to that of entire target population.  The findings obtained from sample are equally true for the entire target population.
  • 30.
     An incorrector false representation of the sample.  The selected sample does not truly reflect the characteristics of population
  • 31.
     Economical  Improvedquality of data  Quick study results  Precision and accuracy of data
  • 32.
     Representative  Freefrom bias and errors  No substitution and incompleteness  Appropriate sample size
  • 34.
  • 35.
     Every memberof the population has a probability of being included in the sample.  Also called as random sampling or representative sampling.
  • 36.
    Example:  The targetpopulation is defined as students of 2015-16 batch of MMC  It means only those students constitute our population who study at the college during the mentioned period.
  • 37.
     Every unitof population does not get an equal chance of participation in the investigation.  It is also called as judgment or non- random sampling  The selection of the sample is made on the basis of subjective judgment of the investigator
  • 38.
     EXAMPLE :Iftarget population is defined as college students. It means person studying at any college of the world is an element of our population.
  • 39.
    PROBABILITY SAMPLING  Reduces the chanceof systematic errors  Minimize the chance of sampling biases.  Inferences are generalisable NON PROBABILITY SAMPLING  Need less effort.  Need less time to finish up  Not much costly
  • 40.
    Probability sampling  Needa lot of efforts  A lot of time is consumed  They are expensive. Non probability sampling  Encounter with systematic errors and sampling biases.  Cannot be claimed to be a good representative  Inferences are not generalisable
  • 41.
    Simple random sampling Systematic random sampling Stratifiedrandom sampling Cluster sampling Multistage smapling
  • 42.
     Every elementof the population has an equal chance of being selected in the sample.  Every element must be able to distinguish from one another and does not have any overlapping characteristics.  The population must be homogenous
  • 43.
     Population hasto be defined  Preparation of list of all the elements  Selection is done through Lottery method Or random table
  • 45.
    The owner ofCompany X wants to know if his employs are satisfied with the quality of food provided in the company.  Target population – every person works in the company (1000)  Samples needed (100)  Make a list of employees  Give numbers to each member  Select 100 numbers randomly  People corresponding to the numbers are samples
  • 46.
    BENEFITS  No possiblesampling bias  Good representatives of population DRAWBACKS  Very costly and time consuming  Needs a lot of efforts  It is not possible to get or prepare an exhaustive list of elements
  • 47.
     The elementsare selected at a regular interval.  The interval may be in terms of time, space or order.  Regularity and uniformity in selection makes the sampling systematic  The list of elements may or may not be required
  • 48.
     Population neededto be defined  If exhaustive list is available, It is arranged/ numbered in an order 1 to N.  Population contains N number of elements and we need a sample of n size.  Divide N by n. the answer is K and gives the appropriate interval size  For eg if population is 300 elements and we need 30 participants, 300/30=10  Interval size will be 10 so we need to select every tenth element
  • 50.
    A super markethas been advertised through bill board a few meters away from its existence. The owner wants to know how much this advertisement has contributed to bring the costumer to the market.  Population – every person who visits the super market  Exhaustive list – not possible  Include any no of population –eg 3rd or 5th  Every 10th person from the 3rd is taken as the samples – eg 13th, 23rd, 33rd
  • 51.
    Benefits:  Extension ofsample to the whole population  way to get a random and representative sample in the situation where prior listing up of elements is not possible. Draw Backs:  It may be very costly and time consuming  It needs a lot of efforts especially for a large population.  If the order of the list is biased in some way, systematic error may occur.
  • 52.
     This isused when population is heterogeneous.  Sub groups are formed that are homogenous  The sub groups are called as strata (single stratum)  The topic and nature of the investigation tells on what criterion the strata are to be made.
  • 53.
     gender,age, ethnicity,socioeconomicstatus.  For eg., if an investigation is taking young adults into account,  This population need to be divided into sub groups like  male and female  educated and uneducated  high income and low income etc.  Each stratum is a different population
  • 54.
     Define thepopulation  Describe the criterions to select the sub- strata  Make a list of population  Select the samples using lottery or stratified random sampling
  • 56.
    The owner ofa chain of schools wants to know what percentages on an average have been obtained by his grade 10 students in the Board examination. He has six branches of his schools.
  • 57.
     The targetpopulation - every student who studies in grade 10 of any branch of the school.  population is heterogeneous  The 6 schools are divided into 6 sub groups or strata.  Students are now randomly selected from each stratum using systematic random or simple random sampling.
  • 58.
    Benefits:  For aheterogeneous population it produces a representative sample Draw Backs  It needs a lot of efforts.  It is costly and time consuming  If the criterion characteristic/ variable used for classification is not selected correctly, the whole research may go in vain.
  • 59.
     The groupof elements residing in one geographical region is called as cluster.  Sampling of clusters is called as cluster sampling.  It is used when the elements of population are spread over a wide geographical area.  The population is divided into sub-groups called as clusters on the basis of their geographical allocation.
  • 60.
     First dividethe population into clusters.  Random selection of clusters.  The selected clusters are visited.  All the elements (may be individuals, households, schools, markets etc. depending on the nature of investigation) within the selected clusters are investigated.
  • 62.
    Education department wantsto inspect quality of education in schools of ABC City. There are twenty five thousand schools in the city; the researcher wants to take a sample of 1000 schools.  The city’s population is divided into 21 towns; thus into 21 clusters.  A number is allotted to each cluster.  Then 7 clusters are selected using simple random sampling.
  • 63.
    Advantage:  Reduce costas compare to simple random or systematic random sampling.  It consumes less time and efforts than  we get a group of elements in one geographical region. Crucial Issues/ Draw Backs:  lead to sampling biases and systematic errors.  If clusters are not homogeneous among them, the final sample may not be representative of the population.
  • 64.
     Two ormore probability techniques are combined.  Used when elements of population are spread over a wide geographical region  sampling within the sample.  Several stages of sampling is done  The final unit or element of population is used in investigation
  • 65.
     Target populationis divided into clusters.  The clusters are selected randomly.  These clusters are called as first stage units or primary units  These clusters are homogenous among them but may be heterogeneous inside  To overcome this heterogeneity, homogenous sub groups called as strata are formed.  So the strata are called the second stage units or sub-units.
  • 66.
     The formationof these strata can be done using cluster sampling technique or stratified random sampling technique depending on the nature of investigation.  In each stratum the units may need to be further divided, for instance market places into shops, buildings into houses etc.  The final units obtained are investigated.
  • 67.
    Example:  The purposeof a research is to find out the best seller food products brands of the year in the country.  In this case the target population is constituted by every market where the food products are sold. So the population is not only spread over a wide geographical region of the country but is also dispersed.
  • 68.
     Divides thecountry into cities; there is a formation of 150 clusters  Selects 30 clusters randomly; these form the first stage units  The sale of a food product is likely to be impacted by its price; so there is a possibility that people belonging to lower and higher income groups are different in their preference of food products.  Thus the researcher divides each city into 3 strata: residence of lower class, middle class and upper class; these strata form the second stage units.
  • 69.
     it isnot possible to take a random sample of elements from each stratum  So, the researcher makes clusters within each stratum and then randomly selects clusters from each of the 3 strata.  These clusters form the final units of the sample.  Each element (i.e. food products selling shops and markets) within the selected clusters are now approached and investigated.
  • 71.
    Advantages:  It increasescost and time efficacy.  The technique is also useful in overcoming the heterogeneity problem within the clusters. Draw Backs:  The sample would not be representative of the population.  The whole research may go in vain if strata is not selected appropriately
  • 72.
     Sample sizeis not fixed  Investigator usually selects small sample and tries out to make inferences  If not drawn the results, adds more subjects untill clear cut inferences can be drawn.
  • 73.
     Association betweensmoking and cancer  Smallest sample is taken to draw inferences, if unable to draw any inferences, researcher continues to draw the sample until meaningful inferences are drawn.
  • 74.
    MERITS  Used tostudy on smallest representative sample  Helps to find out the inferences of the study DEMERITS  Not possible to study a phenomenon which needs to be study at one point of time  Requires repeated entries into the field to collect the sample
  • 75.
     If populationis finite --- probability sampling  If population is infinite ….. Non probability sampling
  • 76.
     If populationis homogenous, & list of elements is available……. Simple random sampling  If population is homogenous, list of elements cannot be produced…….. Systematic random sampling  If population is heterogeneous, not widely spread ….. Stratified random sampling  If target population is homogenous, spread in a wide geographical area…… cluster sampling  If population is spread over wide geographical area…… multistage sampling