Download as PDF, PPTX


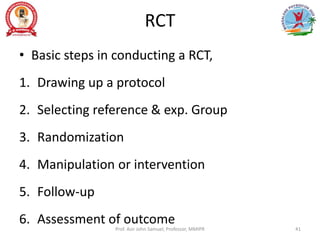


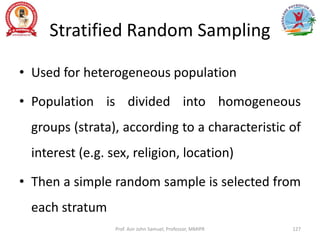


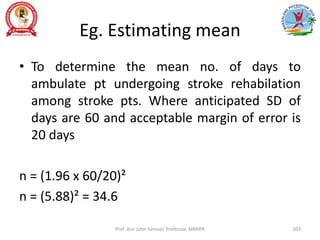
![Comparison of 2 means
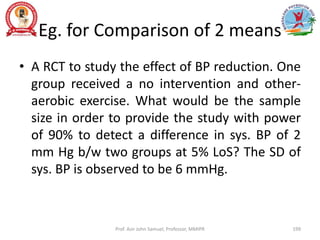
n= 2 [(Zα+Zβ)s/d]²
Zα – LoS
Zβ – power of study
s – pooled SD of the two sample
d – clinically significant difference
Prof. Asir John Samuel, Professor, MMIPR 198](https://image.slidesharecdn.com/quantativeresearch27-2832022-220329100817/85/Quantative-Research-Methods-198-320.jpg)


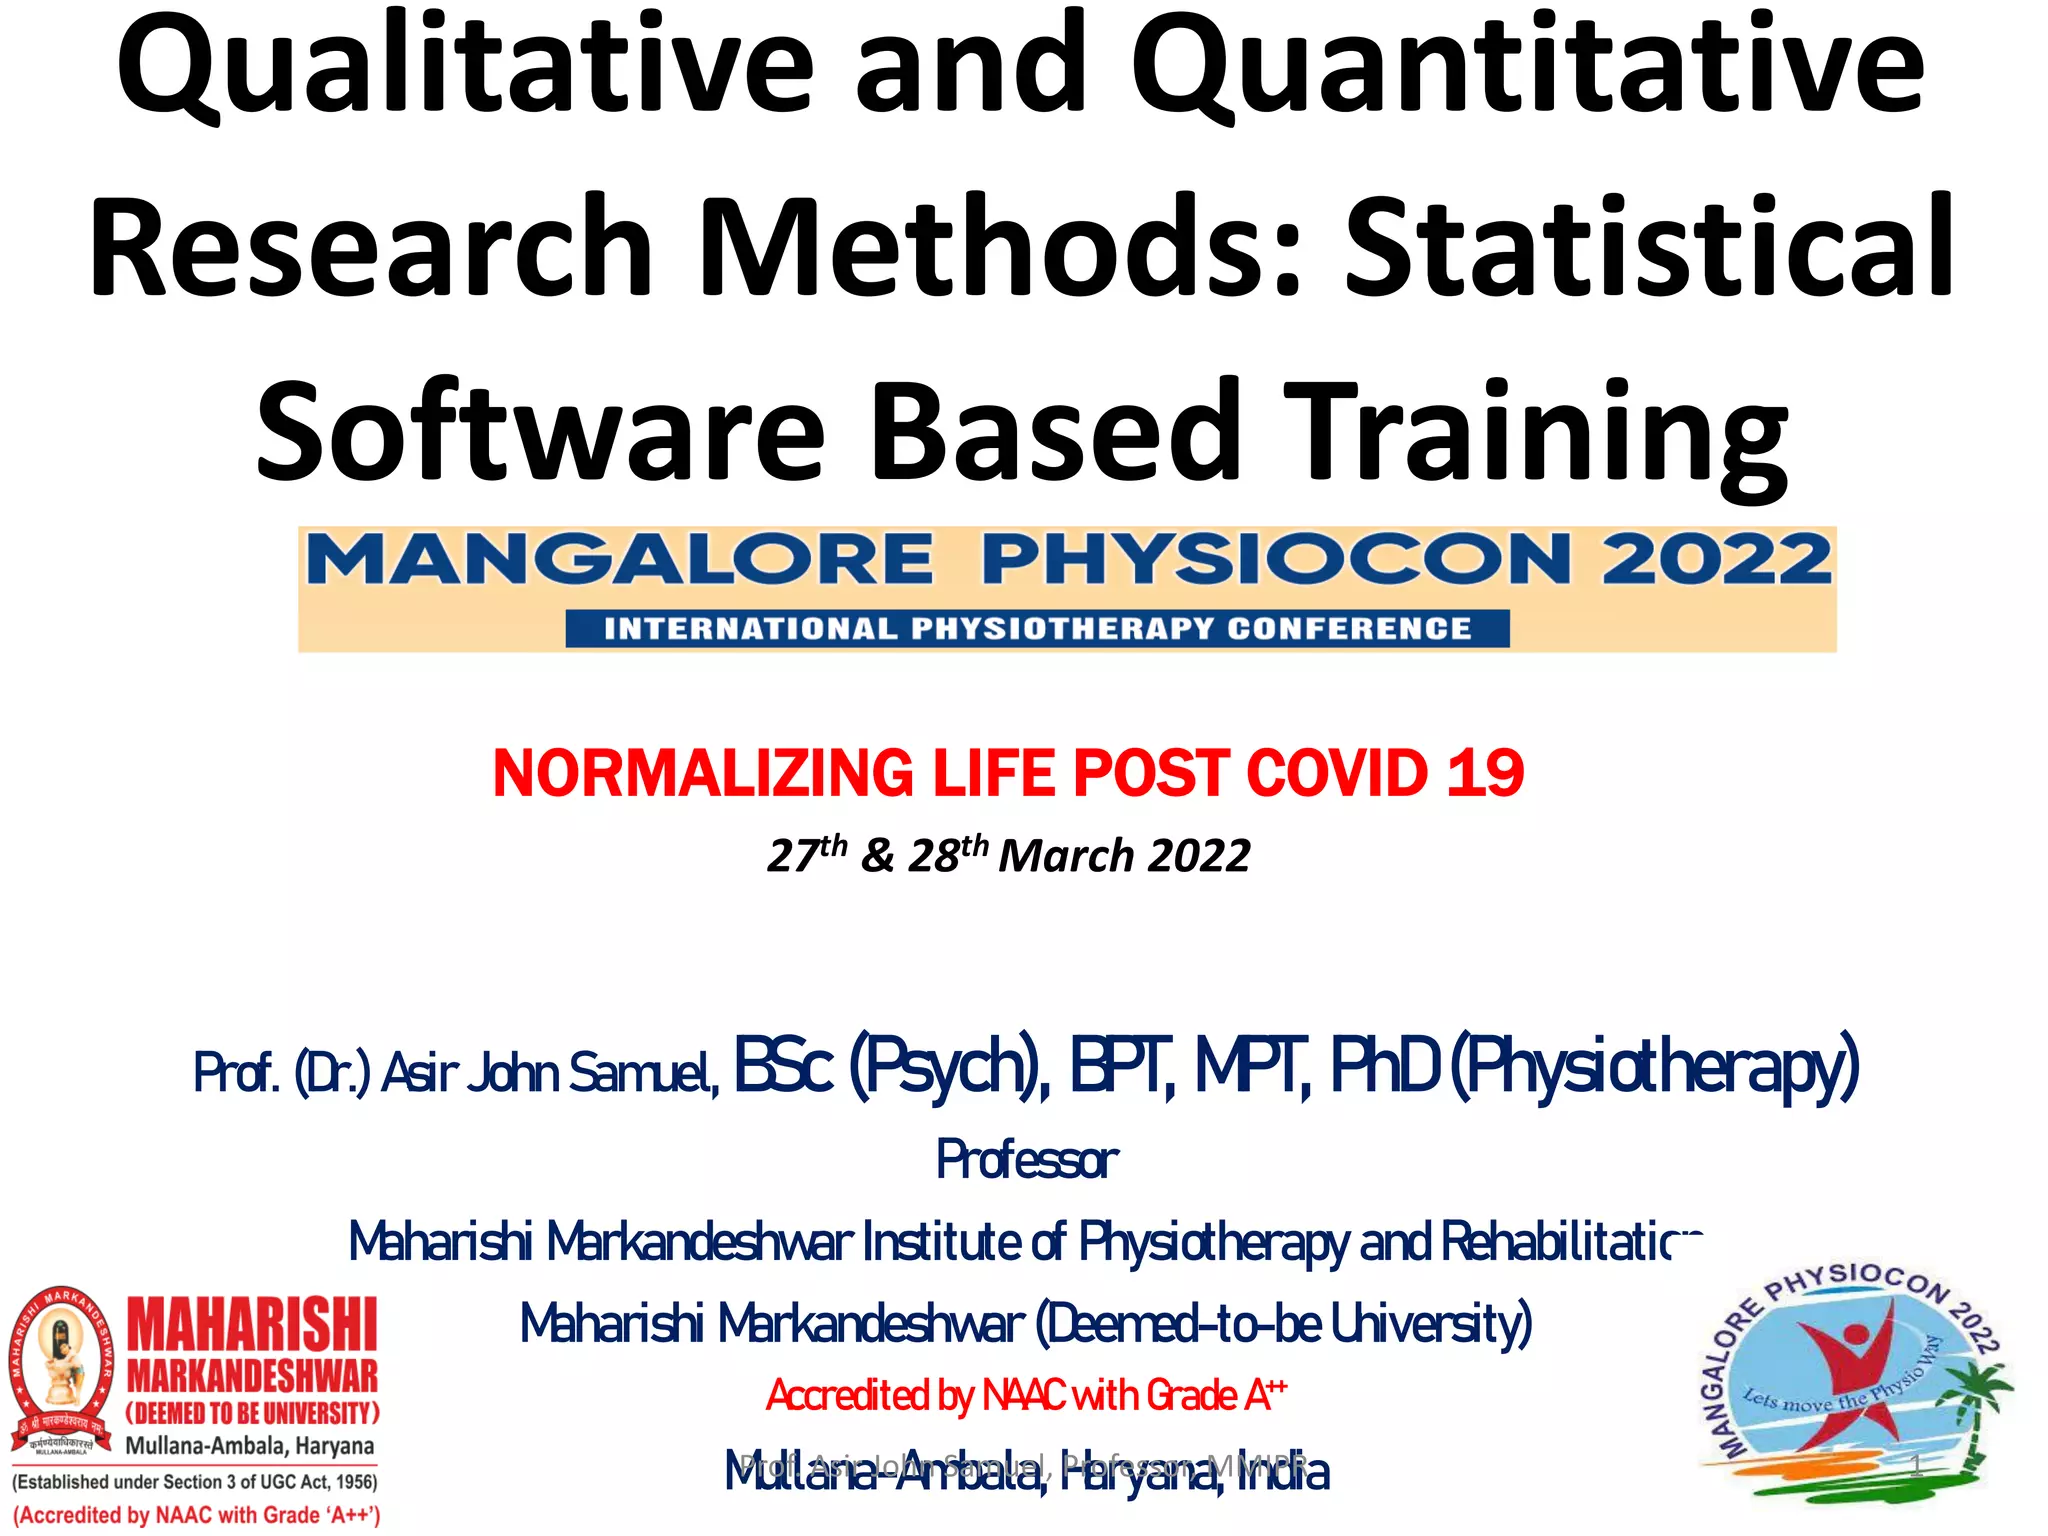
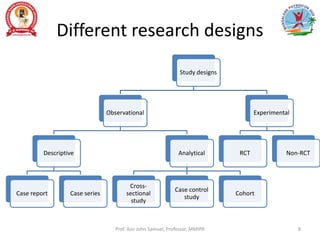
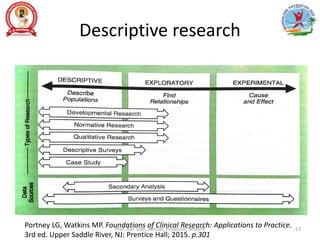
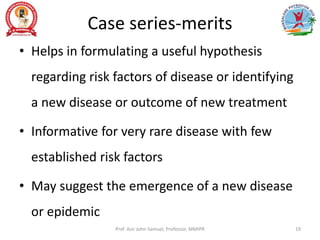
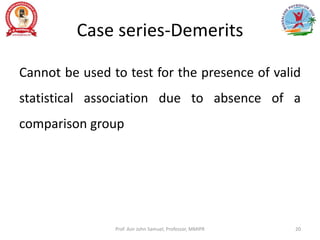
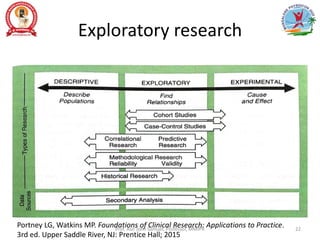
The document provides an in-depth overview of qualitative and quantitative research methods, particularly focusing on various research designs such as descriptive, observational, exploratory, and experimental studies. It outlines the merits and demerits of different study types, including case reports, case series, and cohort studies, as well as the importance of statistical analysis and reporting standards in health research. The presentation emphasizes the necessity of careful study design and execution to ensure valid and reliable research outcomes.


