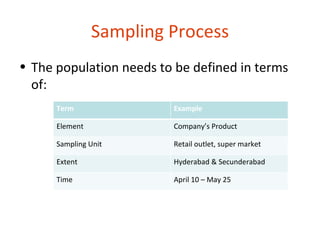
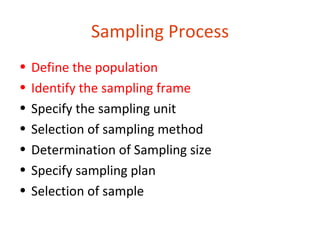
This document discusses sampling and different sampling methods. It defines key concepts like census, sampling, population, sampling frame, and sampling unit. It explains the sampling process which includes defining the population, identifying the sampling frame, specifying the sampling unit, selecting a sampling method, determining sample size, and selecting the sample. It also discusses different types of sampling methods like simple random sampling, systematic sampling, stratified sampling, cluster sampling, and non-probability sampling methods. Finally, it covers potential sources of error in sampling and key statistical concepts.


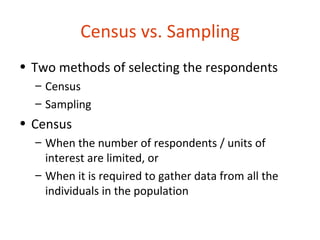

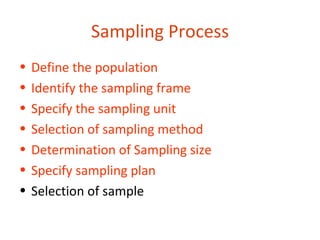
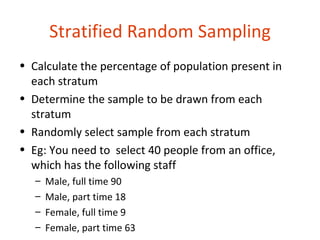
![Step 4:
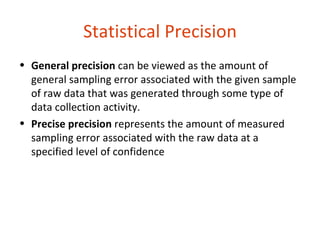
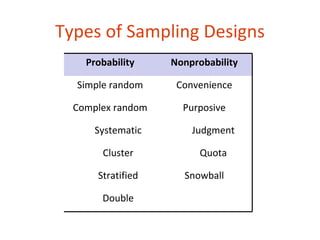
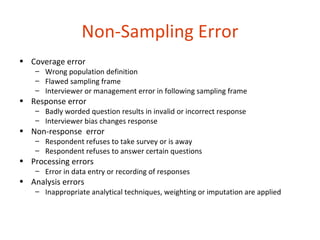
Specifying the sampling method
• Probability Sampling
– Every element in the target population or universe [sampling
frame] has equal probability of being chosen in the sample
for the survey being conducted.
– Scientific, operationally convenient and simple in theory.
– Results may be generalized.
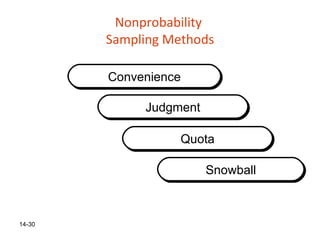
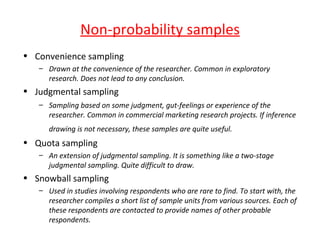
• Non-Probability Sampling
– Every element in the universe [sampling frame] does not
have equal probability of being chosen in the sample.
– Operationally convenient and simple in theory.
– Results may not be generalized.](https://image.slidesharecdn.com/t5-sampling-120306234356-phpapp02/85/T5-sampling-19-320.jpg)


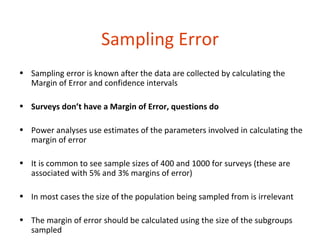
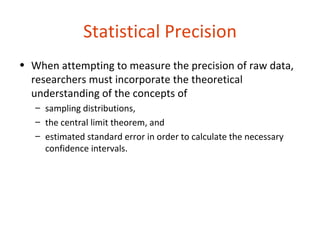
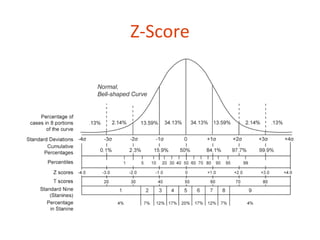
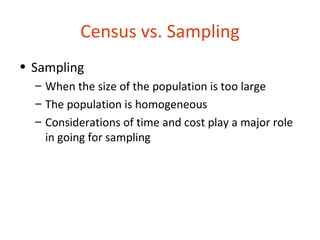
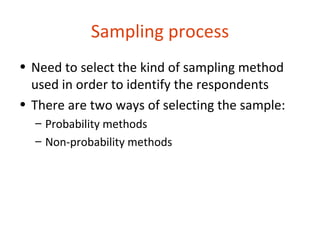
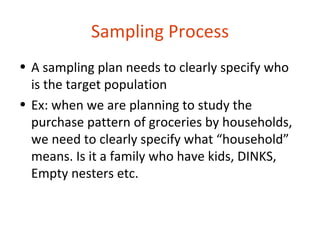
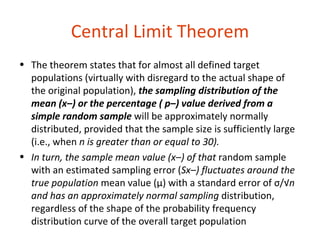
![Some Notations to remember
Population Parameters Symbol Sample Notations Symbol
Size N Size n
Mean value μ Mean value x-
Percentage value Percentage value
(population proportion) P (sample proportion) p–
Q or [1 – P] q– or [1 – p–]
Standard deviation σ Estimated standard deviation s–
Variance σ2 Estimated sample s –2
Standard error Estimated standard error
(population parameter) Sμ or SP (sample statistics) Sx – or Sp –
Other Sampling Concepts
Confidence intervals CIx – or CIp –
Tolerance level of error e
Critical z-value ZB
Confidence levels CL
Finite correction factor (the overall
square root of [N – n/N – 1] (also
referred to as “finite multiplier” or
“finite population correction”) fcf](https://image.slidesharecdn.com/t5-sampling-120306234356-phpapp02/85/T5-sampling-43-320.jpg)
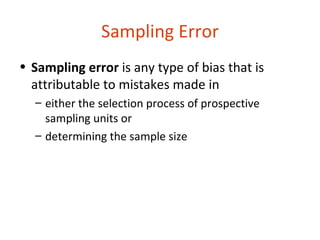
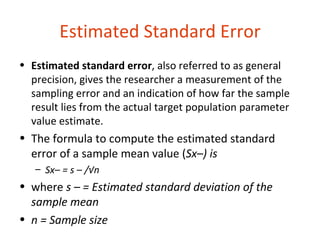
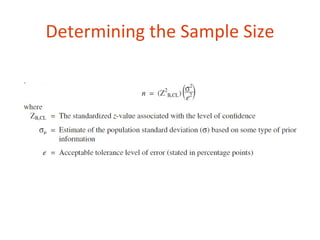
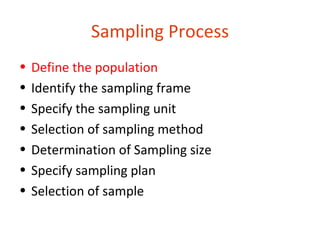
![Statistical Precision
• Using several statistical methods, the researcher will be
able to specify the critical tolerance level of error (i.e.,
allowable margin of error) prior to undertaking a
research study
• This critical tolerance level of error (e) represents general
precision (S) with no specific confidence level or precise
precision [(S)(ZB,CL)] when a specific level of confidence
is required](https://image.slidesharecdn.com/t5-sampling-120306234356-phpapp02/85/T5-sampling-47-320.jpg)