(Best) ENJOY Call Girls in Faridabad Ex | 8377087607
Ipca ru4 qfy2010-280510
1. 4QFY2010 Result Update I Pharmaceutical
May 28, 2010
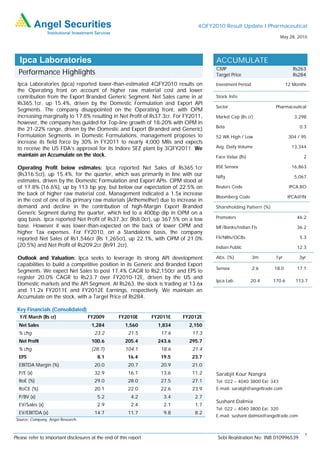
Ipca Laboratories ACCUMULATE
CMP Rs263
Performance Highlights Target Price Rs284
Ipca Laboratories (Ipca) reported lower-than-estimated 4QFY2010 results on Investment Period 12 Months
the Operating front on account of higher raw material cost and lower
contribution from the Export Branded Generic Segment. Net Sales came in at Stock Info
Rs365.1cr, up 15.4%, driven by the Domestic Formulation and Export API
Sector Pharmaceutical
Segments. The company disappointed on the Operating front, with OPM
increasing marginally to 17.8% resulting in Net Profit of Rs37.3cr. For FY2011, Market Cap (Rs cr) 3,298
however, the company has guided for Top-line growth of 18-20% with OPM in
Beta 0.3
the 21-22% range, driven by the Domestic and Export (Branded and Generic)
Formulation Segments. In Domestic Formulations, management proposes to 52 WK High / Low 304 / 95
increase its field force by 30% in FY2011 to nearly 4,000 MRs and expects
to receive the US FDA’s approval for its Indore SEZ plant by 3QFY2011. We Avg. Daily Volume 13,344
maintain an Accumulate on the stock. Face Value (Rs) 2
Operating Profit below estimates: Ipca reported Net Sales of Rs365.1cr BSE Sensex 16,863
(Rs316.5cr), up 15.4%, for the quarter, which was primarily in line with our Nifty 5,067
estimates, driven by the Domestic Formulation and Export APIs. OPM stood at
of 17.8% (16.6%), up by 113 bp yoy, but below our expectation of 22.5% on Reuters Code IPCA.BO
the back of higher raw material cost. Management indicated a 1.5x increase
Bloomberg Code IPCA@IN
in the cost of one of its primary raw materials (Arthemether) due to increase in
demand and decline in the contribution of high-Margin Export Branded Shareholding Pattern (%)
Generic Segment during the quarter, which led to a 400bp dip in OPM on a
qoq basis. Ipca reported Net Profit of Rs37.3cr (Rs8.0cr), up 367.5% on a low Promoters 46.2
base. However it was lower-than-expected on the back of lower OPM and MF/Banks/Indian FIs 36.2
higher Tax expenses. For FY2010, on a Standalone basis, the company
reported Net Sales of Rs1,546cr (Rs 1,265cr), up 22.1%, with OPM of 21.0% FII/NRIs/OCBs 5.3
(20.5%) and Net Profit of Rs209.2cr (Rs91.2cr). Indian Public 12.3
Outlook and Valuation: Ipca seeks to leverage its strong API development Abs. (%) 3m 1yr 3yr
capabilities to build a competitive position in its Generic and Branded Export
Sensex 2.6 18.0 17.1
Segments. We expect Net Sales to post 17.4% CAGR to Rs2,150cr and EPS to
register 20.0% CAGR to Rs23.7 over FY2010-12E, driven by the US and
Ipca Lab. 20.4 170.6 113.7
Domestic markets and the API Segment. At Rs263, the stock is trading at 13.6x
and 11.2x FY2011E and FY2012E Earnings, respectively. We maintain an
Accumulate on the stock, with a Target Price of Rs284.
Key Financials (Consolidated)
Y/E March (Rs cr) FY2009 FY2010E FY2011E FY2012E
Net Sales 1,284 1,560 1,834 2,150
% chg 23.2 21.5 17.6 17.3
Net Profit 100.6 205.4 243.6 295.7
% chg (28.7) 104.1 18.6 21.4
EPS 8.1 16.4 19.5 23.7
EBITDA Margin (%) 20.0 20.7 20.9 21.0
P/E (x) 32.9 16.1 13.6 11.2 Sarabjit Kour Nangra
RoE (%) 29.0 28.0 27.5 27.1 Tel: 022 – 4040 3800 Ext: 343
RoCE (%) 20.1 22.0 22.6 23.9 E-mail: sarabjit@angeltrade.com
P/BV (x) 5.2 4.2 3.4 2.7
Sushant Dalmia
EV/Sales (x) 2.9 2.4 2.1 1.7
Tel: 022 – 4040 3800 Ext: 320
EV/EBITDA (x) 14.7 11.7 9.8 8.2
E-mail: sushant.dalmia@angeltrade.com
Source: Company, Angel Research.
1
Please refer to important disclosures at the end of this report Sebi Registration No: INB 010996539
2. Ipca Laboratories I 4QFY2010 Result Update
Exhibit 1: 4QFY2010 Performance (Standalone)
Y/E March (Rs cr) 4QFY10 4QFY09 % chg FY10 FY09 % chg
Net Sales 365 317 15.4 1,546 1,265 22.1
Other Income 3.4 2.1 13.4 10.3
Total Income 369 319 15.7 1,559 1,276 22.2
PBIDT 64.9 52.7 23.2 324.7 259.8 25.0
Operating Margin (%) 17.8 16.6 21.0 20.5
Interest 5.9 7.8 (25.0) 25.8 30.4 (15.0)
Depreciation 11.7 10.6 10.6 46.3 39.3 17.9
PBT 50.7 36.3 39.6 265.9 200.3 32.7
Provision for Taxation 15.2 2.9 425.5 62.5 23.2 169.1
PAT before Extra-ord. item 35.5 33.4 6.1 203.4 177.1 14.8
Less: Exceptional Items 1.8 (25.4) - 5.8 (85.4) -
PAT after Extra-ord. item &
37.3 8.0 367.5 209.2 91.2 129.3
MI
EPS (Rs) 3.0 1.4 16.7 8.1
Source: Company, Angel Research
Key Highlights
Revenue in line with expectation, up 15.4%: Ipca reported Net Sales of Rs365.1cr
(Rs316.5cr), up 15.4%, for the quarter, which was primarily in line with our
estimates. Growth was driven by the Domestic Formulation and Export API
Segments. The Domestic Formulation Segment grew by 28.9% to Rs121.0cr
(Rs93.9cr), while the Domestic API Segment grew 9.5% to Rs32.3cr (Rs29.6cr).
However, the Export Formulation Segment disappointed, registering mere growth of
1.3% to Rs130.9cr (Rs129.3cr), as the Branded Generic business comprising mainly
the CIS region declined by 45.8% to Rs26.0cr (Rs48.0cr), while the Generic Segment
grew by a strong 29.2% to Rs104.4cr (Rs80.8cr). The Export API Segment grew at a
healthy 25.8% to Rs79.1cr (Rs62.8cr). Overall, the high-Margin Formulation
Segment grew by 12.9% to Rs251.9cr (Rs223.2cr), while the low-Margin API
Segment grew at a stronger pace of 20.6% to Rs111.5cr (Rs92.4cr) for the quarter.
For FY2010, the company reported Net Sales of Rs1,546cr (Rs 1,265cr), up 22.1%,
driven by the Domestic Formulation and the API Segments.
OPM below expectation on higher Raw material cost: Ipca reported OPM of 17.8%
(16.6%), up 113 bp yoy, but below our expectation of 22.5%. This was largely on
account of higher raw material cost. Management indicated a 1.5x increase in the
cost of one of its primary raw materials (Arthemether) on the back of increase in
demand and decline in the contribution of the high-Margin Export Branded Generic
Segment during the quarter, which led to the 400bp dip in OPM on a qoq basis.
However, going forward, the company expects raw material cost (Arthemether) to
decline and contribution from the high-Margin Export Branded Generic Segment to
grow at a stronger pace. Employee expenses for the quarter came in at Rs53.0cr
(Rs49.4cr), up 7.3% yoy. For FY2010, the company reported OPM of 21.0%
(20.5%), up 50bp on the back of lower other expenses.
Net Profit hit by lower OPM, higher Tax charges: Ipca reported Net Profit of Rs37.3cr
(Rs8.0cr), up 367.5% on a low base. However, it was lower-than-expected on the
back of lower OPM and higher Tax expenses. For FY2010, Net Profit doubled to
RsRs209.2cr (Rs91.2cr) on a low base. Excluding one-offs, Recurring Net Profit grew
14.8% to Rs203.4cr (Rs177.1cr).
May 28, 2010 2
3. Ipca Laboratories I 4QFY2010 Result Update
Other Takeaways
Ipca has guided for Top-line growth of 18-20% and OPM of 21-22% for
FY2011E. Management expects the Export Branded Generic business to grow
at a stellar pace on a low base and stable pricing environment. The company
is also targeting the Tender business of Rs80cr-100cr in FY2011E on the
anti-Malarial front.
Ipca has forward hedges worth US $144mn, which covers 50% of its exports
for the next 18 months at Rs48.4/US$.
Management expects its Indore SEZ to get the USFDA’s nod by 3QFY2011,
which will provide a significant boost to the company’s US business.
Management also plans to file 12 ANDAs during the year.
Management expects to incur capex of Rs150cr in FY2011E primarily at its
Sikkim facility.
Management plans to ramp up its field force significantly by 1,000MR (30%
increase) by adding three more divisions in the Domestic Formulation
Segment, taking the total strength to nearly 4,000 MRs by end FY2011.
Outlook and Valuation
Ipca, a vertically integrated company with a geographically diversified business
model, has been registering steady growth. Over FY2006-09, the company posted
CAGR of 19.1% and 17.9% in Net Sales and Net Profit, respectively. Growth was
primarily driven by the Domestic Formulations Segment. Going ahead, Ipca seeks to
leverage its strong API development capabilities to build a competitive position in its
Generic Formulation and Branded Exports Segments. Ipca's increasing visibility in
the US Generic Formulation Segment started contributing from FY2009. The
Domestic Formulation business, which contributed nearly 39% to total Revenues in
FY2010, will continue to register strong growth and register higher Margins, as the
company increases its presence in the Chronic and Lifestyle Therapeutic Segments
and expands its field force.
We expect Ipca to post CAGR of 17.4% in Net Sales to Rs2,150cr, while EPS is
expected to register CAGR of 20.0% to Rs23.7 over FY2010-12E, largely driven by
the US and Domestic markets and the API Segment. At Rs263, the stock is trading at
13.6x and 11.2x FY2011E and FY2012E Earnings. We maintain an Accumulate on
the stock, with a Target Price of Rs284.
Exhibit 2: One-year Forward PE Band
350
16x
300
250 12x
200
(Rs)
8x
150
100
4x
50
-
Jul-05
Jan-06
Jul-06
Jan-07
Jul-07
Jan-08
Jul-08
Jan-09
Jul-09
Jan-10
Apr-05
Apr-06
Apr-07
Apr-08
Apr-09
Apr-10
Oct-05
Oct-06
Oct-07
Oct-08
Oct-09
Source: C-line, Angel Research
May 28, 2010 3
7. Ipca Laboratories I 4QFY2010 Result Update
Research Team Tel: 022- 4040 3800 E-mail: research@angeltrade.com Website: www.angeltrade.com
DISCLAIMER
This document is solely for the personal information of the recipient, and must not be singularly used as the basis of any investment decision. Nothing in this
document should be construed as investment or financial advice. Each recipient of this document should make such investigations as they deem necessary to
arrive at an independent evaluation of an investment in the securities of the companies referred to in this document (including the merits and risks involved),
and should consult their own advisors to determine the merits and risks of such an investment.
Angel Securities Limited, its affiliates, directors, its proprietary trading and investment businesses may, from time to time, make investment decisions that are
inconsistent with or contradictory to the recommendations expressed herein. The views contained in this document are those of the analyst, and the company
may or may not subscribe to all the views expressed within.
Reports based on technical and derivative analysis center on studying charts of a stock's price movement, outstanding positions and trading volume, as
opposed to focusing on a company's fundamentals and, as such, may not match with a report on a company's fundamentals.
The information in this document has been printed on the basis of publicly available information, internal data and other reliable sources believed to be true,
and are for general guidance only. Angel Securities Limited has not independently verified all the information contained within this document. Accordingly,
we cannot testify, nor make any representation or warranty, express or implied, to the accuracy, contents or data contained within this document. While
Angel Securities Limited endeavours to update on a reasonable basis the information discussed in this material, there may be regulatory, compliance, or
other reasons that prevent us from doing so.
This document is being supplied to you solely for your information, and its contents, information or data may not be reproduced, redistributed or passed on,
directly or indirectly.
Angel Securities Limited and its affiliates may seek to provide or have engaged in providing corporate finance, investment banking or other advisory services
in a merger or specific transaction to the companies referred to in this report, as on the date of this report or in the past.
Neither Angel Securities Limited, nor its directors, employees or affiliates shall be liable for any loss or damage that may arise from or in connection with the
use of this information.
Note: Please refer to the important `Stock Holding Disclosure' report on the Angel website (Research Section).
Disclosure of Interest Statement Ipca Laboratories
1. Analyst ownership of the stock No
2. Angel and its Group companies ownership of the stock No
3. Angel and its Group companies’ Directors ownership of the stock No
4. Broking relationship with company covered No
Note: We have not considered any Exposure below Rs 1 lakh for Angel and its Group companies.
Address: Acme Plaza, ‘A’ Wing, 3rd Floor, M.V. Road, Opp. Sangam Cinema, Andheri (E), Mumbai - 400 059.
Tel : (022) 3952 4568 / 4040 3800
Angel Broking Ltd: BSE Sebi Regn No : INB 010996539 / CDSL Regn No: IN - DP - CDSL - 234 - 2004 / PMS Regn Code: PM/INP000001546 Angel Securities Ltd:BSE: INB010994639/INF010994639 NSE:
INB230994635/INF230994635 Membership numbers: BSE 028/NSE:09946
Angel Capital & Debt Market Ltd: INB 231279838 / NSE FNO: INF 231279838 / NSE Member code -12798 Angel Commodities Broking (P) Ltd: MCX Member ID: 12685 / FMC Regn No: MCX / TCM /
CORP / 0037 NCDEX : Member ID 00220 / FMC Regn No: NCDEX / TCM / CORP / 0302
May 28, 2010 7