Download to read offline

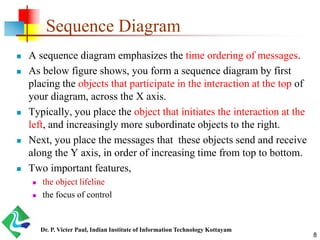
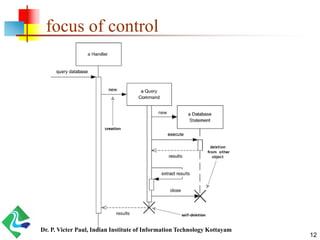
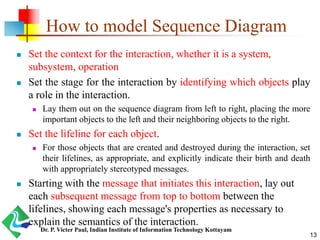
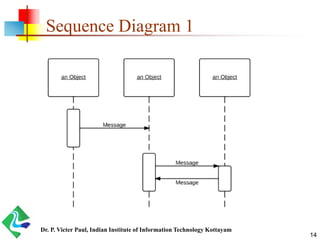
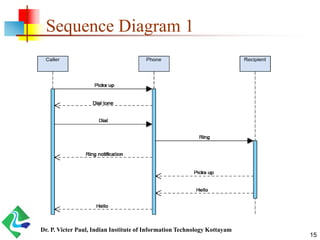
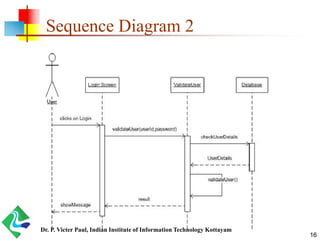
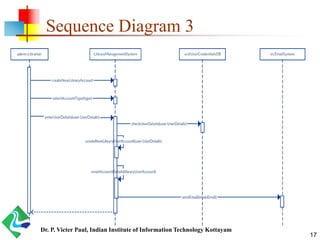
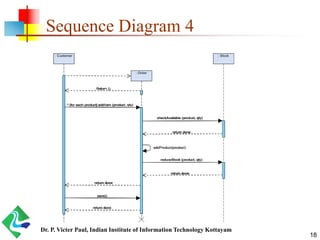
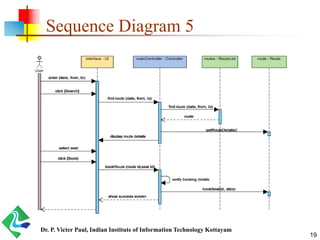
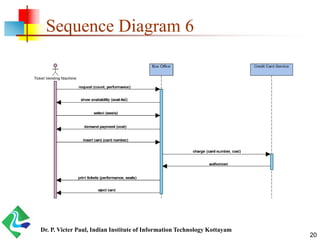
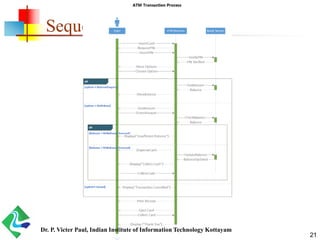
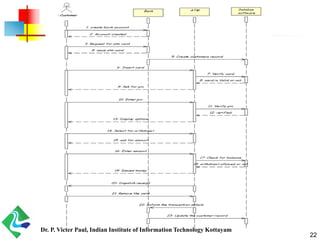
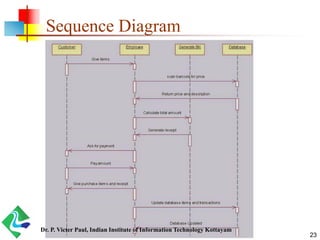
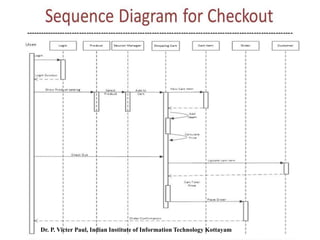
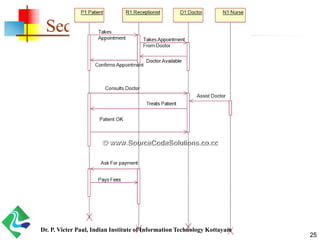
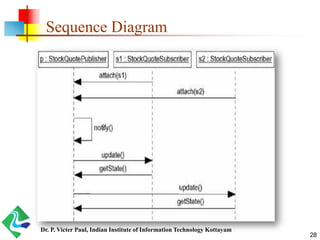
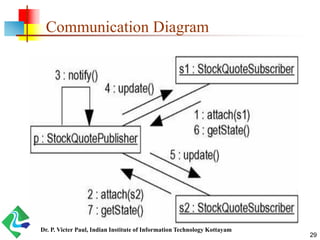
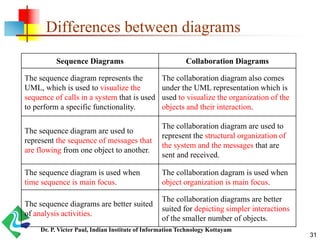
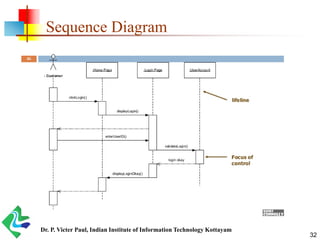
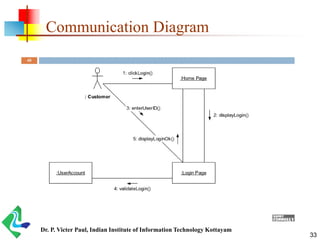
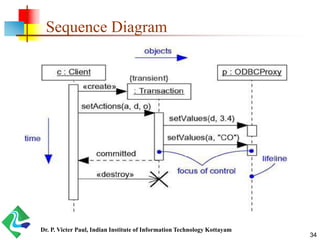
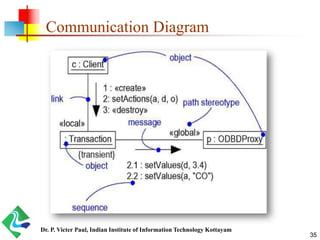
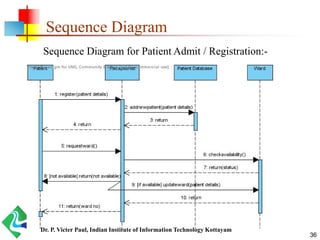
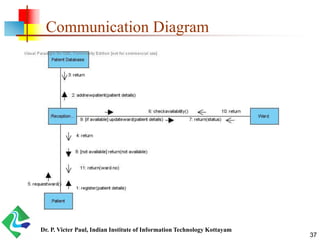
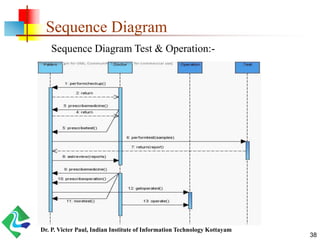
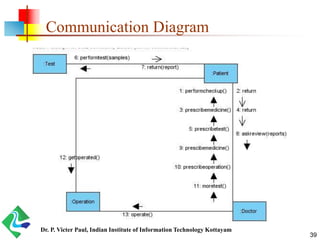
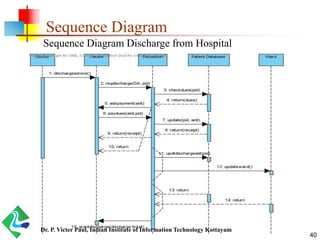
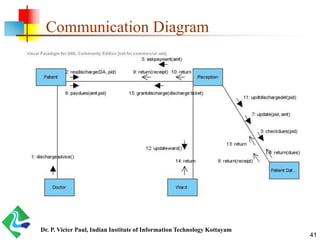


The document discusses interaction diagrams, specifically sequence diagrams and communication diagrams. It explains that interaction diagrams show interactions between objects by depicting the messages exchanged. A sequence diagram emphasizes the time ordering of messages, showing objects arranged from left to right and messages ordered from top to bottom. A communication diagram emphasizes the structural organization of objects, showing them as vertices connected by links along which messages pass. Both diagram types are semantically equivalent but visualize information differently based on their focus. Examples of sequence and communication diagrams are provided for processes like patient admission to a hospital.