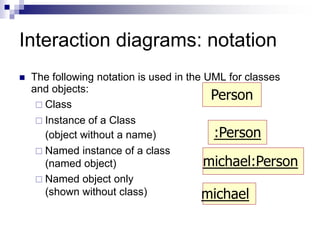
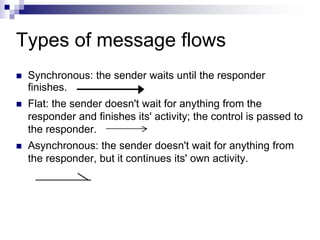
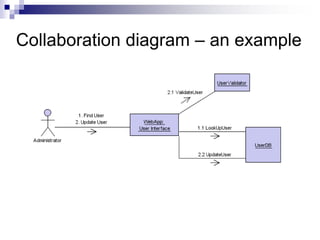
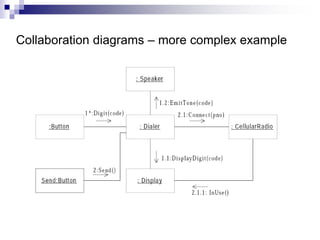
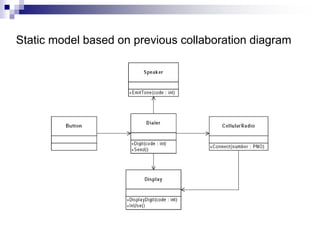
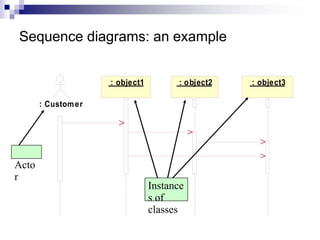
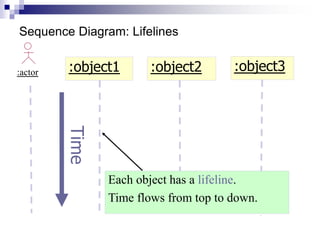
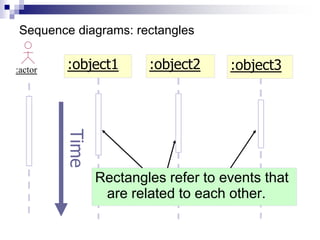
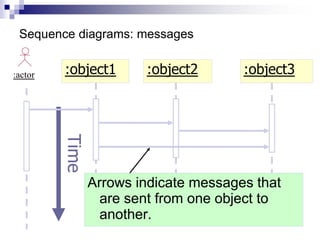
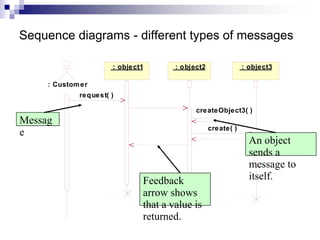
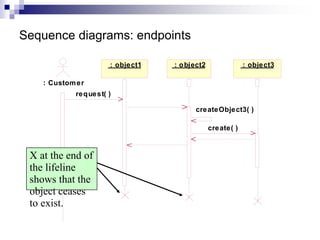
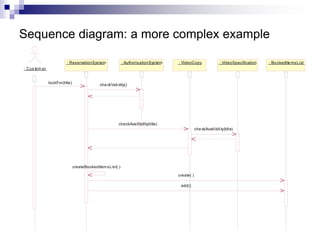
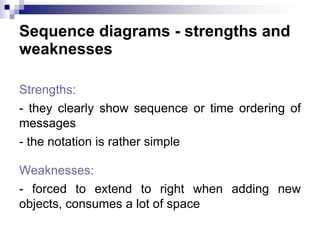
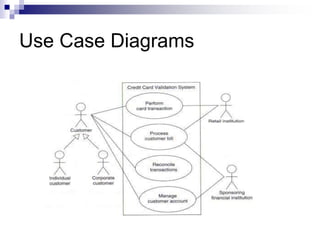
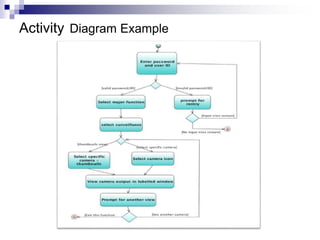
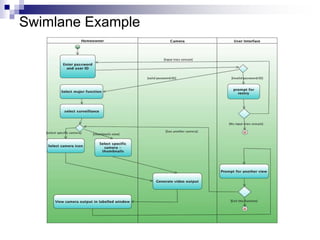
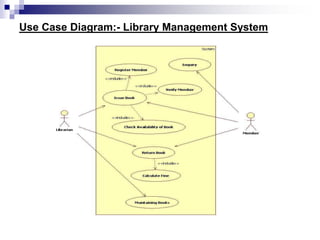
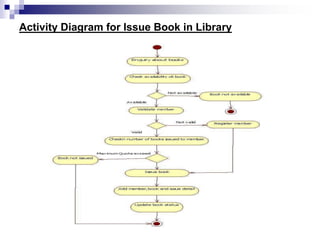
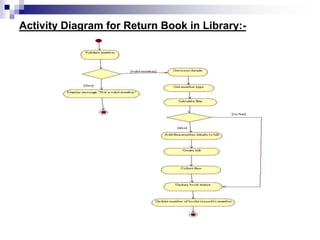
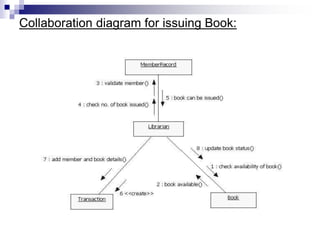
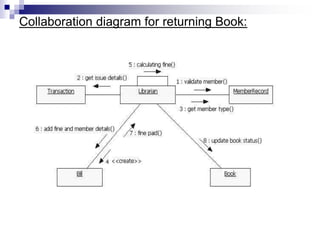
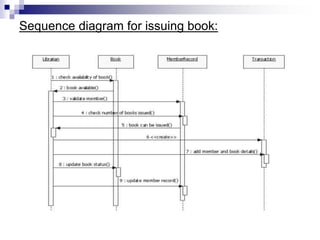
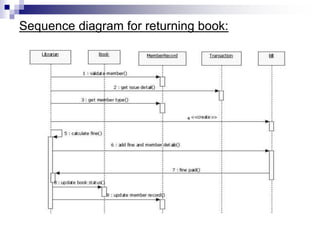
1
DEPARTMENT OF COMPUTER SCIENCE
AND ENGINEERING
(2016-17)
OBJECT ORIENTED ANALYSIS AND DESIGN
III B. Tech II Sem
UNIT-3
Interaction diagrams
Sequence and collaboration
diagrams
What are interaction diagrams?
 Interaction diagrams illustrate how objects
interact via messages in order to fulfil
certain tasks.
 There are two kinds of interaction
diagrams:
 collaboration diagrams
 sequence diagrams
Collaboration and sequence diagrams:
main differences
 Collaboration diagram illustrates object interactions in a
graph or network format, in which objects can be placed
anywhere on the diagram. It demonstrates how objects
are statically connected.
 Sequence diagram illustrates interaction in a kind of
fence format, in which each new object is added to the
right. It generally shows the sequence of events that
occur.
Interaction diagrams: when and how to
use them?
1. Identify the system events that are
implied by the use cases.
2. Make at least one interaction diagram for
each system event.
3. Make additional interaction diagrams for
alternative courses of events.
Interaction diagrams: notation
 The following notation is used in the UML for classes
and objects:
 Class
 Instance of a Class
(object without a name)
 Named instance of a class
(named object)
 Named object only
(shown without class)
Person
michael:Person
michael
:Person
Types of message flows
 Synchronous: the sender waits until the responder
finishes.
 Flat: the sender doesn't wait for anything from the
responder and finishes its' activity; the control is passed to
the responder.
 Asynchronous: the sender doesn't wait for anything from
the responder, but it continues its' own activity.
Collaboration diagrams
 A collaboration diagram shows the relationship
between objects and the order of messages
passed between them.
 The objects are listed as icons and arrows
indicate the messages being passed between
them.
 The numbers next to the messages are called
sequence numbers and, as the name suggests,
they show the sequence of the messages as
they are passed between the objects.
Collaboration diagram – an example
Collaboration diagrams – more complex example
Static model based on previous collaboration diagram
Collaboration diagrams – strenghts and weaknesses
One of the greatest strengths of collaboration diagrams is
their simplicity.
The principal weakness, however, is that although they are
good at describing behavior, they do not define it. They
typically do not show all the iteration and control that is
needed to give an computationally complete description.
Sequence diagrams
 A sequence diagram shows relations between
objects.
 It should be read from left to right and from top
to bottom.
 At the top of the diagram are names of objects
that interact with each other. These are the
concepts in the conceptual model.
 When the course of events is initiated by an
actor the actor symbol is displayed as the
leftmost object.
Sequence diagrams: an example
: Customer
: object1 : object2 : object3
Acto
r
Instance
s of
classes
Sequence Diagram: Lifelines
:actor :object1 :object2
Each object has a lifeline.
Time flows from top to down.
Time :object3
:actor :object1 :object2
Rectangles refer to events that
are related to each other.
Time :object3
Sequence diagrams: rectangles
Sequence diagrams: messages
:object3
:actor :object1 :object2
Arrows indicate messages that
are sent from one object to
another.
Time
Sequence diagrams - different types of messages
: Customer
: object1 : object2 : object3
request( )
createObject3( )
create( )
Messag
e
Feedback
arrow shows
that a value is
returned.
An object
sends a
message to
itself.
Sequence diagrams: endpoints
: Customer
: object1 : object2 : object3
request( )
createObject3( )
create( )
X at the end of
the lifeline
shows that the
object ceases
to exist.
Sequence diagram: a more complex example
: Cus tom er
: ReservationSystem : AuthorisationSystem : VideoCopy : BookedIte msList
: VideoSpecification
lookFor(title) che ckValidity()
checkAvailibility(title)
createBookedItemsList( )
create( )
add()
che ckAvailibility(title)
Sequence diagrams - strengths and
weaknesses
Strengths:
- they clearly show sequence or time ordering of
messages
- the notation is rather simple
Weaknesses:
- forced to extend to right when adding new
objects, consumes a lot of space
Use Cases and Actors
 A use case
Specifies the behavior of a system
Represents a functional requirement of your
system as a whole
Describes what a system not how it does it
 An actor
Represents users of use case play when
interacting with use cases
It’s not part of the system
Use Cases and Actors
Organizing Use Cases
 Organize use case by specifying
Generalization
Include
 The base use case pulling behavior from the
supplier use case
Extend
 Pushing behavior to the base use case
Use Case Diagrams
 A use case diagram
A diagram shows a set of use cases and
actors and their relationship
Contents
 Use cases
 Actors
 Dependency, generalization, and association
relationships
Use Case Diagrams
Activity Diagrams
 Activity diagrams represent the dynamics of the system.
 They are flow charts that are used to show the workflow
of a system.
 They show.
 The flow of control from activity to activity in the system,
 What activities can be done in parallel.
 Alternate paths through the flow.
 They can show the flow across use cases or within a use
case.
 Core symbol is an activity.
Activity Diagram
 An activity is some task which needs to be
done.
 Each activity can be followed by another
activity (sequencing).
 Triggers from the activity may be guarded
as in state diagrams.
Decision Activities
 Diamond.
 Each trigger coming from it has a guard.
 Synchronisation bar.
 All triggers from this attach to activities that can
occur in parallel, with no specific sequence, or
concurrently.
 The next synchronisation bar closes the
concurrency.
 Iteration is represented by a * on the trigger.
Activity Diagram Example
Swimlane
 Arrange activity diagrams into vertical
zones separated by dashed lines.
 Each zone represents the responsibilities
of a particular class or department.
Swimlane Example
Use Case Diagram:- Library Management System
Activity Diagram for Issue Book in Library
Activity Diagram for Return Book in Library:-
Collaboration diagram for issuing Book:
Collaboration diagram for returning Book:
Sequence diagram for issuing book:
Sequence diagram for returning book:
THANKYOU

OOAD-Unit-3.ppt UML and ANALYSISI AND DESIGN

  • 1.
    1 DEPARTMENT OF COMPUTERSCIENCE AND ENGINEERING (2016-17) OBJECT ORIENTED ANALYSIS AND DESIGN III B. Tech II Sem UNIT-3
  • 2.
    Interaction diagrams Sequence andcollaboration diagrams
  • 3.
    What are interactiondiagrams?  Interaction diagrams illustrate how objects interact via messages in order to fulfil certain tasks.  There are two kinds of interaction diagrams:  collaboration diagrams  sequence diagrams
  • 4.
    Collaboration and sequencediagrams: main differences  Collaboration diagram illustrates object interactions in a graph or network format, in which objects can be placed anywhere on the diagram. It demonstrates how objects are statically connected.  Sequence diagram illustrates interaction in a kind of fence format, in which each new object is added to the right. It generally shows the sequence of events that occur.
  • 5.
    Interaction diagrams: whenand how to use them? 1. Identify the system events that are implied by the use cases. 2. Make at least one interaction diagram for each system event. 3. Make additional interaction diagrams for alternative courses of events.
  • 6.
    Interaction diagrams: notation The following notation is used in the UML for classes and objects:  Class  Instance of a Class (object without a name)  Named instance of a class (named object)  Named object only (shown without class) Person michael:Person michael :Person
  • 7.
    Types of messageflows  Synchronous: the sender waits until the responder finishes.  Flat: the sender doesn't wait for anything from the responder and finishes its' activity; the control is passed to the responder.  Asynchronous: the sender doesn't wait for anything from the responder, but it continues its' own activity.
  • 8.
    Collaboration diagrams  Acollaboration diagram shows the relationship between objects and the order of messages passed between them.  The objects are listed as icons and arrows indicate the messages being passed between them.  The numbers next to the messages are called sequence numbers and, as the name suggests, they show the sequence of the messages as they are passed between the objects.
  • 9.
  • 10.
    Collaboration diagrams –more complex example
  • 11.
    Static model basedon previous collaboration diagram
  • 12.
    Collaboration diagrams –strenghts and weaknesses One of the greatest strengths of collaboration diagrams is their simplicity. The principal weakness, however, is that although they are good at describing behavior, they do not define it. They typically do not show all the iteration and control that is needed to give an computationally complete description.
  • 13.
    Sequence diagrams  Asequence diagram shows relations between objects.  It should be read from left to right and from top to bottom.  At the top of the diagram are names of objects that interact with each other. These are the concepts in the conceptual model.  When the course of events is initiated by an actor the actor symbol is displayed as the leftmost object.
  • 14.
    Sequence diagrams: anexample : Customer : object1 : object2 : object3 Acto r Instance s of classes
  • 15.
    Sequence Diagram: Lifelines :actor:object1 :object2 Each object has a lifeline. Time flows from top to down. Time :object3
  • 16.
    :actor :object1 :object2 Rectanglesrefer to events that are related to each other. Time :object3 Sequence diagrams: rectangles
  • 17.
    Sequence diagrams: messages :object3 :actor:object1 :object2 Arrows indicate messages that are sent from one object to another. Time
  • 18.
    Sequence diagrams -different types of messages : Customer : object1 : object2 : object3 request( ) createObject3( ) create( ) Messag e Feedback arrow shows that a value is returned. An object sends a message to itself.
  • 19.
    Sequence diagrams: endpoints :Customer : object1 : object2 : object3 request( ) createObject3( ) create( ) X at the end of the lifeline shows that the object ceases to exist.
  • 20.
    Sequence diagram: amore complex example : Cus tom er : ReservationSystem : AuthorisationSystem : VideoCopy : BookedIte msList : VideoSpecification lookFor(title) che ckValidity() checkAvailibility(title) createBookedItemsList( ) create( ) add() che ckAvailibility(title)
  • 21.
    Sequence diagrams -strengths and weaknesses Strengths: - they clearly show sequence or time ordering of messages - the notation is rather simple Weaknesses: - forced to extend to right when adding new objects, consumes a lot of space
  • 22.
    Use Cases andActors  A use case Specifies the behavior of a system Represents a functional requirement of your system as a whole Describes what a system not how it does it  An actor Represents users of use case play when interacting with use cases It’s not part of the system
  • 23.
  • 24.
    Organizing Use Cases Organize use case by specifying Generalization Include  The base use case pulling behavior from the supplier use case Extend  Pushing behavior to the base use case
  • 25.
    Use Case Diagrams A use case diagram A diagram shows a set of use cases and actors and their relationship Contents  Use cases  Actors  Dependency, generalization, and association relationships
  • 26.
  • 27.
    Activity Diagrams  Activitydiagrams represent the dynamics of the system.  They are flow charts that are used to show the workflow of a system.  They show.  The flow of control from activity to activity in the system,  What activities can be done in parallel.  Alternate paths through the flow.  They can show the flow across use cases or within a use case.  Core symbol is an activity.
  • 28.
    Activity Diagram  Anactivity is some task which needs to be done.  Each activity can be followed by another activity (sequencing).  Triggers from the activity may be guarded as in state diagrams.
  • 29.
    Decision Activities  Diamond. Each trigger coming from it has a guard.  Synchronisation bar.  All triggers from this attach to activities that can occur in parallel, with no specific sequence, or concurrently.  The next synchronisation bar closes the concurrency.  Iteration is represented by a * on the trigger.
  • 30.
  • 31.
    Swimlane  Arrange activitydiagrams into vertical zones separated by dashed lines.  Each zone represents the responsibilities of a particular class or department.
  • 32.
  • 33.
    Use Case Diagram:-Library Management System
  • 34.
    Activity Diagram forIssue Book in Library
  • 35.
    Activity Diagram forReturn Book in Library:-
  • 36.
  • 37.
  • 38.
    Sequence diagram forissuing book:
  • 39.
    Sequence diagram forreturning book:
  • 40.