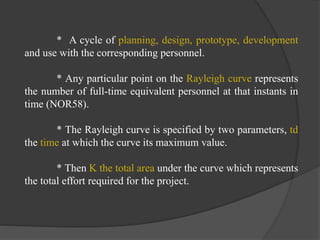
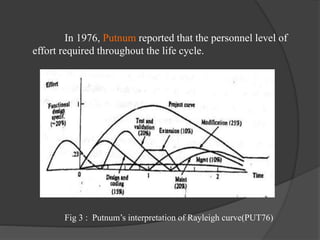
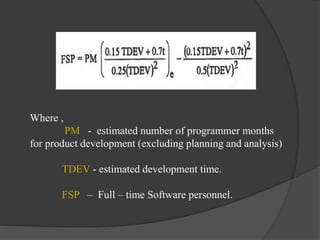
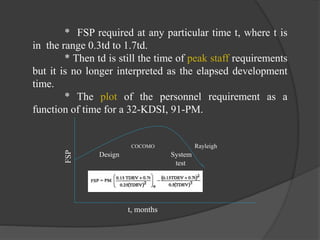
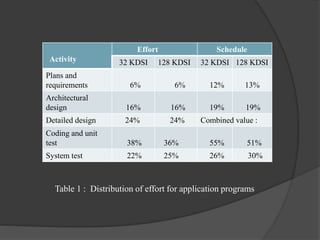
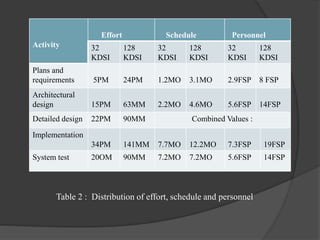
Software Engineering
Staffing Level Estimation
Submitted by,
M. Kavitha,
II – M.Sc (CS&IT),
Nadar Saraswathi College
of Arts & Science, Theni.
Staffing level estimation :
* The number of personnel required throughout a
software development project is not constant.
* Planning and analysis are performed by a small group
of people, architectural design by a large, but still group and
details design a large number of people.
* Implementation and system testing require the largest
number of people.
* Maintenance may require numerous personnel but the
number should decrease in a short time.
* In 1958, Norden research and development project.
Cycles :
A. Planning
B. Design
C. Prototype
D. Product
E. Modification
* A cycle of planning, design, prototype, development
and use with the corresponding personnel.
* Any particular point on the Rayleigh curve represents
the number of full-time equivalent personnel at that instants in
time (NOR58).
* The Rayleigh curve is specified by two parameters, td
the time at which the curve its maximum value.
* Then K the total area under the curve which represents
the total effort required for the project.
E = K / t2
d t e –t2/2t2
d
Fig 2 : The Rayleigh curve of effort vs. time
In 1976, Putnum reported that the personnel level of
effort required throughout the life cycle.
Fig 3 : Putnum’s interpretation of Rayleigh curve(PUT76)
A. Design and coding (15%)
B. Test and validation (20%)
C. Extension (10%)
D. Modification (25%)
E. Maintenance (20%)
F. Management (10%)
* The planning requirements analysis and functional
design in the project curve.
* Boehm the Rayleigh is reasonably accurate
estimator of personnel development cycle.
* The development cycle from architectural design
through implementation and system testing if the portion of
the curve between 0.3td and 1.7td.
Where ,
PM - estimated number of programmer months
for product development (excluding planning and analysis)
TDEV - estimated development time.
FSP – Full – time Software personnel.
* FSP required at any particular time t, where t is
in the range 0.3td to 1.7td.
* Then td is still the time of peak staff requirements
but it is no longer interpreted as the elapsed development
time.
* The plot of the personnel requirement as a
function of time for a 32-KDSI, 91-PM.
COCOMO Rayleigh
Design System
test
FSP
t, months
Activity
Effort Schedule
32 KDSI 128 KDSI 32 KDSI 128 KDSI
Plans and
requirements 6% 6% 12% 13%
Architectural
design 16% 16% 19% 19%
Detailed design 24% 24% Combined value :
Coding and unit
test 38% 36% 55% 51%
System test 22% 25% 26% 30%
Table 1 : Distribution of effort for application programs
Activity
Effort Schedule Personnel
32
KDSI
128
KDSI
32
KDSI
128
KDSI
32
KDSI
128
KDSI
Plans and
requirements 5PM 24PM 1.2MO 3.1MO 2.9FSP 8 FSP
Architectural
design 15PM 63MM 2.2MO 4.6MO 5.6FSP 14FSP
Detailed design 22PM 90MM Combined Values :
Implementation
34PM 141MM 7.7MO 12.2MO 7.3FSP 19FSP
System test 20OM 90MM 7.2MO 7.2MO 5.6FSP 14FSP
Table 2 : Distribution of effort, schedule and personnel
* Boehm also presents tables that specify the of
effort and schedule in a software development project.
* The total number of programmer months and total
development time can be used estimate the actual number
of programmer months and elapsed time for each activity.
* An estimate of the number of full time software
personnel required in each phase of software development
and divided number of programmer month.
Thank You

Staffing level estimation

  • 1.
    Software Engineering Staffing LevelEstimation Submitted by, M. Kavitha, II – M.Sc (CS&IT), Nadar Saraswathi College of Arts & Science, Theni.
  • 2.
    Staffing level estimation: * The number of personnel required throughout a software development project is not constant. * Planning and analysis are performed by a small group of people, architectural design by a large, but still group and details design a large number of people. * Implementation and system testing require the largest number of people. * Maintenance may require numerous personnel but the number should decrease in a short time.
  • 3.
    * In 1958,Norden research and development project. Cycles : A. Planning B. Design C. Prototype D. Product E. Modification
  • 4.
    * A cycleof planning, design, prototype, development and use with the corresponding personnel. * Any particular point on the Rayleigh curve represents the number of full-time equivalent personnel at that instants in time (NOR58). * The Rayleigh curve is specified by two parameters, td the time at which the curve its maximum value. * Then K the total area under the curve which represents the total effort required for the project.
  • 5.
    E = K/ t2 d t e –t2/2t2 d Fig 2 : The Rayleigh curve of effort vs. time
  • 6.
    In 1976, Putnumreported that the personnel level of effort required throughout the life cycle. Fig 3 : Putnum’s interpretation of Rayleigh curve(PUT76)
  • 7.
    A. Design andcoding (15%) B. Test and validation (20%) C. Extension (10%) D. Modification (25%) E. Maintenance (20%) F. Management (10%) * The planning requirements analysis and functional design in the project curve. * Boehm the Rayleigh is reasonably accurate estimator of personnel development cycle. * The development cycle from architectural design through implementation and system testing if the portion of the curve between 0.3td and 1.7td.
  • 8.
    Where , PM -estimated number of programmer months for product development (excluding planning and analysis) TDEV - estimated development time. FSP – Full – time Software personnel.
  • 9.
    * FSP requiredat any particular time t, where t is in the range 0.3td to 1.7td. * Then td is still the time of peak staff requirements but it is no longer interpreted as the elapsed development time. * The plot of the personnel requirement as a function of time for a 32-KDSI, 91-PM. COCOMO Rayleigh Design System test FSP t, months
  • 10.
    Activity Effort Schedule 32 KDSI128 KDSI 32 KDSI 128 KDSI Plans and requirements 6% 6% 12% 13% Architectural design 16% 16% 19% 19% Detailed design 24% 24% Combined value : Coding and unit test 38% 36% 55% 51% System test 22% 25% 26% 30% Table 1 : Distribution of effort for application programs
  • 11.
    Activity Effort Schedule Personnel 32 KDSI 128 KDSI 32 KDSI 128 KDSI 32 KDSI 128 KDSI Plansand requirements 5PM 24PM 1.2MO 3.1MO 2.9FSP 8 FSP Architectural design 15PM 63MM 2.2MO 4.6MO 5.6FSP 14FSP Detailed design 22PM 90MM Combined Values : Implementation 34PM 141MM 7.7MO 12.2MO 7.3FSP 19FSP System test 20OM 90MM 7.2MO 7.2MO 5.6FSP 14FSP Table 2 : Distribution of effort, schedule and personnel
  • 12.
    * Boehm alsopresents tables that specify the of effort and schedule in a software development project. * The total number of programmer months and total development time can be used estimate the actual number of programmer months and elapsed time for each activity. * An estimate of the number of full time software personnel required in each phase of software development and divided number of programmer month.
  • 13.