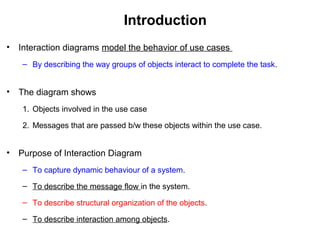
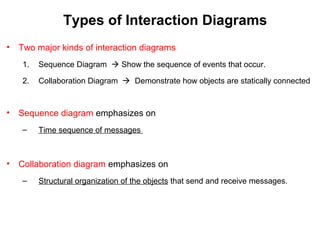
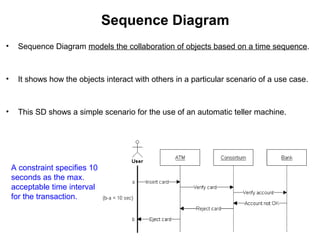
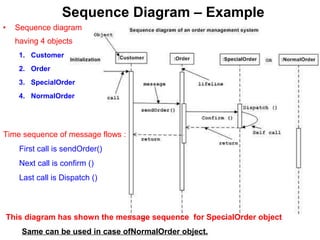
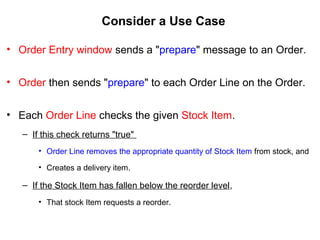
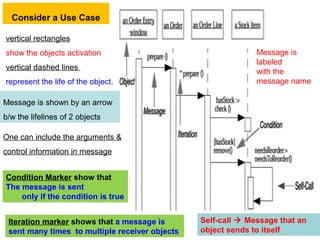
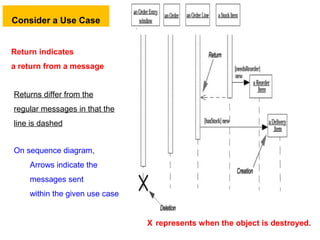
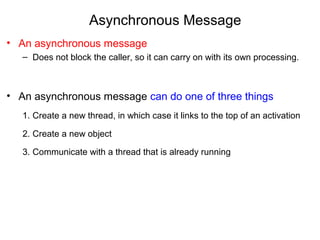
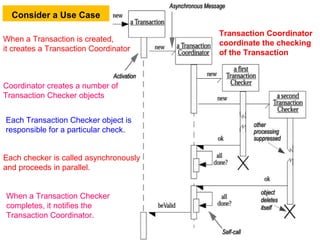
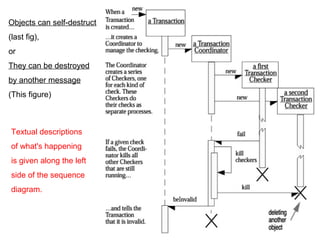
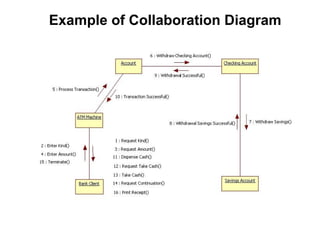
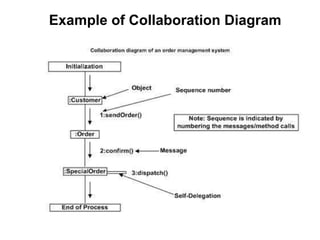
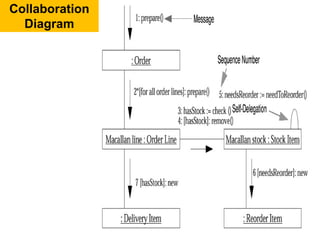
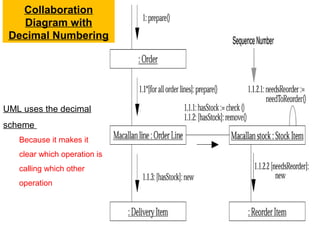
Welcome to my series of articles on Unified Modeling Language. This is "Session 10 – Sequence Diagram" of the series. Please view my other documents where I have covered each UML diagram with examples
This slide give the basic introduction about UML diagram and it's types, and brief intro about Activity Diagram, use of activity diagram in object oriented programming language..
The objective is to explain how a software design may be represented as a set of interacting objects that manage their own state and operations and to introduce various models that describe an object-oriented design.
Unified Modeling Language (UML) is a modeling language, used for design. Designed based on OMG Standard, Object this helps to express and design documents, software. This is particularly useful for OO design. Here is a brief tutorial that talks about UML usage.
The Unified Modeling Language (UML) is a general-
purpose, developmental, modeling language in the field
of software engineering, that is intended to provide a
standard way to visualize the design of a system.
Master sequence diagrams with this sequence diagram guide. It describes everything you need to know on sequence diagram notations, best practices as well as common mistakes. It also explains how to draw a sequence diagram step by step. Plus it offers Creately sequence diagram templates you can click and edit right away.
Cosmetic shop management system project report.pdfKamal Acharya
Buying new cosmetic products is difficult. It can even be scary for those who have sensitive skin and are prone to skin trouble. The information needed to alleviate this problem is on the back of each product, but it's thought to interpret those ingredient lists unless you have a background in chemistry.
Instead of buying and hoping for the best, we can use data science to help us predict which products may be good fits for us. It includes various function programs to do the above mentioned tasks.
Data file handling has been effectively used in the program.
The automated cosmetic shop management system should deal with the automation of general workflow and administration process of the shop. The main processes of the system focus on customer's request where the system is able to search the most appropriate products and deliver it to the customers. It should help the employees to quickly identify the list of cosmetic product that have reached the minimum quantity and also keep a track of expired date for each cosmetic product. It should help the employees to find the rack number in which the product is placed.It is also Faster and more efficient way.
Industrial Training at Shahjalal Fertilizer Company Limited (SFCL)MdTanvirMahtab2
This presentation is about the working procedure of Shahjalal Fertilizer Company Limited (SFCL). A Govt. owned Company of Bangladesh Chemical Industries Corporation under Ministry of Industries.
Water scarcity is the lack of fresh water resources to meet the standard water demand. There are two type of water scarcity. One is physical. The other is economic water scarcity.
NO1 Uk best vashikaran specialist in delhi vashikaran baba near me online vas...Amil Baba Dawood bangali
Contact with Dawood Bhai Just call on +92322-6382012 and we'll help you. We'll solve all your problems within 12 to 24 hours and with 101% guarantee and with astrology systematic. If you want to take any personal or professional advice then also you can call us on +92322-6382012 , ONLINE LOVE PROBLEM & Other all types of Daily Life Problem's.Then CALL or WHATSAPP us on +92322-6382012 and Get all these problems solutions here by Amil Baba DAWOOD BANGALI
#vashikaranspecialist #astrologer #palmistry #amliyaat #taweez #manpasandshadi #horoscope #spiritual #lovelife #lovespell #marriagespell#aamilbabainpakistan #amilbabainkarachi #powerfullblackmagicspell #kalajadumantarspecialist #realamilbaba #AmilbabainPakistan #astrologerincanada #astrologerindubai #lovespellsmaster #kalajaduspecialist #lovespellsthatwork #aamilbabainlahore#blackmagicformarriage #aamilbaba #kalajadu #kalailam #taweez #wazifaexpert #jadumantar #vashikaranspecialist #astrologer #palmistry #amliyaat #taweez #manpasandshadi #horoscope #spiritual #lovelife #lovespell #marriagespell#aamilbabainpakistan #amilbabainkarachi #powerfullblackmagicspell #kalajadumantarspecialist #realamilbaba #AmilbabainPakistan #astrologerincanada #astrologerindubai #lovespellsmaster #kalajaduspecialist #lovespellsthatwork #aamilbabainlahore #blackmagicforlove #blackmagicformarriage #aamilbaba #kalajadu #kalailam #taweez #wazifaexpert #jadumantar #vashikaranspecialist #astrologer #palmistry #amliyaat #taweez #manpasandshadi #horoscope #spiritual #lovelife #lovespell #marriagespell#aamilbabainpakistan #amilbabainkarachi #powerfullblackmagicspell #kalajadumantarspecialist #realamilbaba #AmilbabainPakistan #astrologerincanada #astrologerindubai #lovespellsmaster #kalajaduspecialist #lovespellsthatwork #aamilbabainlahore #Amilbabainuk #amilbabainspain #amilbabaindubai #Amilbabainnorway #amilbabainkrachi #amilbabainlahore #amilbabaingujranwalan #amilbabainislamabad
CFD Simulation of By-pass Flow in a HRSG module by R&R Consult.pptxR&R Consult
CFD analysis is incredibly effective at solving mysteries and improving the performance of complex systems!
Here's a great example: At a large natural gas-fired power plant, where they use waste heat to generate steam and energy, they were puzzled that their boiler wasn't producing as much steam as expected.
R&R and Tetra Engineering Group Inc. were asked to solve the issue with reduced steam production.
An inspection had shown that a significant amount of hot flue gas was bypassing the boiler tubes, where the heat was supposed to be transferred.
R&R Consult conducted a CFD analysis, which revealed that 6.3% of the flue gas was bypassing the boiler tubes without transferring heat. The analysis also showed that the flue gas was instead being directed along the sides of the boiler and between the modules that were supposed to capture the heat. This was the cause of the reduced performance.
Based on our results, Tetra Engineering installed covering plates to reduce the bypass flow. This improved the boiler's performance and increased electricity production.
It is always satisfying when we can help solve complex challenges like this. Do your systems also need a check-up or optimization? Give us a call!
Work done in cooperation with James Malloy and David Moelling from Tetra Engineering.
More examples of our work https://www.r-r-consult.dk/en/cases-en/
Hierarchical Digital Twin of a Naval Power SystemKerry Sado
A hierarchical digital twin of a Naval DC power system has been developed and experimentally verified. Similar to other state-of-the-art digital twins, this technology creates a digital replica of the physical system executed in real-time or faster, which can modify hardware controls. However, its advantage stems from distributing computational efforts by utilizing a hierarchical structure composed of lower-level digital twin blocks and a higher-level system digital twin. Each digital twin block is associated with a physical subsystem of the hardware and communicates with a singular system digital twin, which creates a system-level response. By extracting information from each level of the hierarchy, power system controls of the hardware were reconfigured autonomously. This hierarchical digital twin development offers several advantages over other digital twins, particularly in the field of naval power systems. The hierarchical structure allows for greater computational efficiency and scalability while the ability to autonomously reconfigure hardware controls offers increased flexibility and responsiveness. The hierarchical decomposition and models utilized were well aligned with the physical twin, as indicated by the maximum deviations between the developed digital twin hierarchy and the hardware.
Student information management system project report ii.pdfKamal Acharya
Our project explains about the student management. This project mainly explains the various actions related to student details. This project shows some ease in adding, editing and deleting the student details. It also provides a less time consuming process for viewing, adding, editing and deleting the marks of the students.
Student information management system project report ii.pdf
07 interaction diagrams
1. UNIT I UML DIAGRAMS
Introduction to OOAD – Unified Process –
UML diagrams – Use Case – Class Diagrams–
Interaction Diagrams – State Diagrams –
Activity Diagrams –
Package, component and Deployment Diagrams.
3. Introduction
• Interaction diagrams model the behavior of use cases
– By describing the way groups of objects interact to complete the task.
• The diagram shows
1. Objects involved in the use case
2. Messages that are passed b/w these objects within the use case.
• Purpose of Interaction Diagram
– To capture dynamic behaviour of a system.
– To describe the message flow in the system.
– To describe structural organization of the objects.
– To describe interaction among objects.
4. Types of Interaction Diagrams
• Two major kinds of interaction diagrams
1. Sequence Diagram Show the sequence of events that occur.
2. Collaboration Diagram Demonstrate how objects are statically connected
• Sequence diagram emphasizes on
– Time sequence of messages
• Collaboration diagram emphasizes on
– Structural organization of the objects that send and receive messages.
5. Sequence Vs Collaboration
• Main differences :
– Sequence diagrams show time-based object interaction
– Collaboration diagrams show how objects associate with each other.
• If the time sequence is important then sequence diagram is used
• If organization is required then collaboration diagram is used.
6. When to Use: Interaction Diagrams
• Interaction diagrams
– Used when you want to model the behavior of several objects in a use case.
– Demonstrate how the objects collaborate for the behavior.
– Do not give in depth representation of the behavior
• Things to be identified before drawing the interaction diagram:
– Objects taking part in the interaction.
– Message flows among the objects.
– Sequence in which the messages are flowing.
– Object organization.
7. Usage of Interaction Diagrams
• To model flow of control by time sequence.
• To model flow of control by structural organizations.
• For forward engineering.
• For reverse engineering.
8. Sequence Diagram
• Sequence Diagram models the collaboration of objects based on a time sequence.
• It shows how the objects interact with others in a particular scenario of a use case.
• This SD shows a simple scenario for the use of an automatic teller machine.
A constraint specifies 10
seconds as the max.
acceptable time interval
for the transaction.
9. • Sequence diagram
having 4 objects
1. Customer
2. Order
3. SpecialOrder
4. NormalOrder
Sequence Diagram – Example
Time sequence of message flows :
First call is sendOrder()
Next call is confirm ()
Last call is Dispatch ()
This diagram has shown the message sequence for SpecialOrder object
Same can be used in case ofNormalOrder object.
10. Consider a Use Case
• Order Entry window sends a "prepare" message to an Order.
• Order then sends "prepare" to each Order Line on the Order.
• Each Order Line checks the given Stock Item.
– If this check returns "true"
• Order Line removes the appropriate quantity of Stock Item from stock, and
• Creates a delivery item.
– If the Stock Item has fallen below the reorder level,
• That stock Item requests a reorder.
11. Consider a Use Case
vertical rectangles
show the objects activation
vertical dashed lines
represent the life of the object.
Message is shown by an arrow
b/w the lifelines of 2 objects
Message is
labeled
with the
message name
One can include the arguments &
control information in message
Self-call Message that an
object sends to itself
Condition Marker show that
The message is sent
only if the condition is true
Iteration marker shows that a message is
sent many times to multiple receiver objects
12. Return indicates
a return from a message
Returns differ from the
regular messages in that the
line is dashed
On sequence diagram,
Arrows indicate the
messages sent
within the given use case
Consider a Use Case
X represents when the object is destroyed.
13. Asynchronous Message
• An asynchronous message
– Does not block the caller, so it can carry on with its own processing.
• An asynchronous message can do one of three things
1. Create a new thread, in which case it links to the top of an activation
2. Create a new object
3. Communicate with a thread that is already running
14. Transaction Coordinator
coordinate the checking
of the Transaction
Each Transaction Checker object is
responsible for a particular check.
Coordinator creates a number of
Transaction Checker objects
Each checker is called asynchronously
and proceeds in parallel.
When a Transaction is created,
it creates a Transaction Coordinator
When a Transaction Checker
completes, it notifies the
Transaction Coordinator.
Consider a Use Case
15. Textual descriptions
of what's happening
is given along the left
side of the sequence
diagram.
Objects can self-destruct
(last fig),
or
They can be destroyed
by another message
(This figure)
16. Collaboration Diagram
• Collaboration diagrams
– Shows the objects and their association with other objects in the system apart
from how they interact with each other.
– i.e., show the message flow between objects in an OO application
• Association between objects is not represented in a Sequence diagram.
17. Notations
• Objects are shown as icons
• Interaction between the objects is denoted by arrows.
• Message sequence is indicated by some numbering technique
– Number indicates how the methods are called one after another.