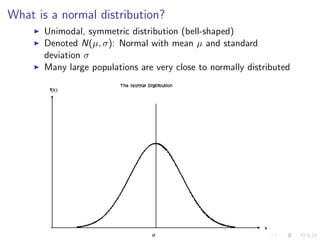
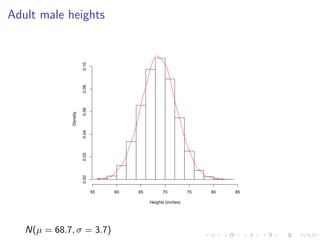
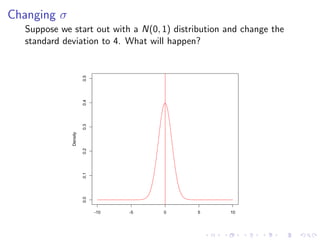
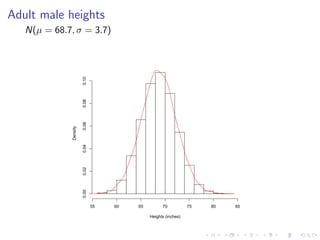
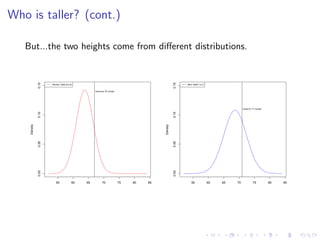
Normal Distribution
Adult male heights
Adult male heights
   National Health Statistics Report (2008) recorded the heights of
   4,482 males age 20 and older
Adult male heights
   National Health Statistics Report (2008) recorded the heights of
   4,482 males age 20 and older


                        0.10
                        0.08
                        0.06
              Density

                        0.04
                        0.02
                        0.00


                               55   60   65         70           75   80   85

                                              Heights (inches)
What is a normal distribution?
      Unimodal, symmetric distribution (bell-shaped)
      Denoted N(µ, σ): Normal with mean µ and standard
      deviation σ
      Many large populations are very close to normally distributed
Adult male heights


                       0.10
                       0.08
                       0.06
             Density

                       0.04
                       0.02
                       0.00


                              55   60   65         70           75   80   85

                                             Heights (inches)


   N(µ = 68.7, σ = 3.7)
Changing µ
  Suppose we start out with a N(0, 1) distribution and change the
  mean to 5. What will happen?


                       0.5
                       0.4
                       0.3
             Density

                       0.2
                       0.1
                       0.0


                             -10   -5   0   5      10
Changing µ
  Suppose we start out with a N(0, 1) distribution and change the
  mean to 5. What will happen?


                       0.5
                                   mean=0,sd=1
                       0.4
                       0.3         mean=5,sd=1
             Density

                       0.2
                       0.1
                       0.0


                             -10            -5   0   5   10
Changing σ
  Suppose we start out with a N(0, 1) distribution and change the
  standard deviation to 4. What will happen?


                       0.5
                       0.4
                       0.3
             Density

                       0.2
                       0.1
                       0.0


                             -10   -5   0   5      10
Changing σ
  Suppose we start out with a N(0, 1) distribution and change the
  standard deviation to 4. What will happen?


                       0.5
                                   mean=0,sd=1
                       0.4
                       0.3         mean=0,sd=4
             Density

                       0.2
                       0.1
                       0.0


                             -10            -5   0   5   10
Empirical Rule
   For normally distributed data,
        68.2% of data fall within 1 standard deviation of the mean
        95.4% of data fall within 2 standard deviations of the mean
        99.7% of data fall within 3 standard deviations of the mean
Adult male heights
   N(µ = 68.7, σ = 3.7)


                       0.10
                       0.08
                       0.06
             Density

                       0.04
                       0.02
                       0.00


                              55   60   65         70           75   80   85

                                             Heights (inches)
Adult male heights
   N(µ = 68.7, σ = 3.7)


                                                                   4468 out of 4482

                       0.10
                                   57.6                         99.68% of observations    79.8
                       0.08
                       0.06
             Density

                       0.04
                       0.02
                       0.00


                              55          60   65         70             75              80      85

                                                    Heights (inches)
Who is taller?


       Veronica: 67 inches; Coach K: 71 inches
Who is taller?


       Veronica: 67 inches; Coach K: 71 inches
   Who is taller relative to their gender?
Who is taller? (cont.)

   But...the two heights come from different distributions.
Who is taller? (cont.)

   But...the two heights come from different distributions.
              0.15


                                                                                               0.15
                     Women: N(63.8,2.9)                                                               Men: N(68.7,3.7)


                                                Veronica: 67 inches


                                                                                                                                        Coach K: 71 inches
              0.10


                                                                                               0.10
    Density


                                                                                     Density
              0.05


                                                                                               0.05
              0.00


                                                                                               0.00

                        55            60   65         70              75   80   85                       55              60   65   70            75          80   85
Standardizing


   We can compare data from different distributions using Z scores
Standardizing


   We can compare data from different distributions using Z scores
                                  xobs −µ
       Standardize a value: z =      σ
Standardizing


   We can compare data from different distributions using Z scores
                                  xobs −µ
       Standardize a value: z =      σ
       Gives the number of standard deviations above (or below) the
       mean an observation is.
Standardizing


   We can compare data from different distributions using Z scores
                                  xobs −µ
       Standardize a value: z =      σ
       Gives the number of standard deviations above (or below) the
       mean an observation is.
       Relates to standard normal distribution: N(0, 1)
Standardizing (cont.)
   So, we can obtain our two z-scores:
Standardizing (cont.)
   So, we can obtain our two z-scores:
        ZVeronica = 67−63.8 = 1.10
                      2.9
Standardizing (cont.)
   So, we can obtain our two z-scores:
        ZVeronica = 67−63.8 = 1.10
                      2.9
        ZCoachK = 71−68.7 = 0.89
                      3.7
Standardizing (cont.)
   So, we can obtain our two z-scores:
        ZVeronica = 67−63.8 = 1.10
                      2.9
        ZCoachK = 71−68.7 = 0.89
                      3.7


                        0.4
                        0.3


                                                        Coach K       Veronica
                                                         z=.89         z=1.1
              Density

                        0.2
                        0.1
                        0.0


                              -3   -2   -1         0              1              2   3

                                             Height (inches)

Normal Distribution

  • 1.
  • 2.
  • 3.
    Adult male heights National Health Statistics Report (2008) recorded the heights of 4,482 males age 20 and older
  • 4.
    Adult male heights National Health Statistics Report (2008) recorded the heights of 4,482 males age 20 and older 0.10 0.08 0.06 Density 0.04 0.02 0.00 55 60 65 70 75 80 85 Heights (inches)
  • 5.
    Adult male heights National Health Statistics Report (2008) recorded the heights of 4,482 males age 20 and older 0.10 0.08 0.06 Density 0.04 0.02 0.00 55 60 65 70 75 80 85 Heights (inches)
  • 6.
    What is anormal distribution? Unimodal, symmetric distribution (bell-shaped) Denoted N(µ, σ): Normal with mean µ and standard deviation σ Many large populations are very close to normally distributed
  • 7.
    Adult male heights 0.10 0.08 0.06 Density 0.04 0.02 0.00 55 60 65 70 75 80 85 Heights (inches) N(µ = 68.7, σ = 3.7)
  • 8.
    Changing µ Suppose we start out with a N(0, 1) distribution and change the mean to 5. What will happen? 0.5 0.4 0.3 Density 0.2 0.1 0.0 -10 -5 0 5 10
  • 9.
    Changing µ Suppose we start out with a N(0, 1) distribution and change the mean to 5. What will happen? 0.5 mean=0,sd=1 0.4 0.3 mean=5,sd=1 Density 0.2 0.1 0.0 -10 -5 0 5 10
  • 10.
    Changing σ Suppose we start out with a N(0, 1) distribution and change the standard deviation to 4. What will happen? 0.5 0.4 0.3 Density 0.2 0.1 0.0 -10 -5 0 5 10
  • 11.
    Changing σ Suppose we start out with a N(0, 1) distribution and change the standard deviation to 4. What will happen? 0.5 mean=0,sd=1 0.4 0.3 mean=0,sd=4 Density 0.2 0.1 0.0 -10 -5 0 5 10
  • 12.
    Empirical Rule For normally distributed data, 68.2% of data fall within 1 standard deviation of the mean 95.4% of data fall within 2 standard deviations of the mean 99.7% of data fall within 3 standard deviations of the mean
  • 13.
    Adult male heights N(µ = 68.7, σ = 3.7) 0.10 0.08 0.06 Density 0.04 0.02 0.00 55 60 65 70 75 80 85 Heights (inches)
  • 14.
    Adult male heights N(µ = 68.7, σ = 3.7) 4468 out of 4482 0.10 57.6 99.68% of observations 79.8 0.08 0.06 Density 0.04 0.02 0.00 55 60 65 70 75 80 85 Heights (inches)
  • 15.
    Who is taller? Veronica: 67 inches; Coach K: 71 inches
  • 16.
    Who is taller? Veronica: 67 inches; Coach K: 71 inches Who is taller relative to their gender?
  • 17.
    Who is taller?(cont.) But...the two heights come from different distributions.
  • 18.
    Who is taller?(cont.) But...the two heights come from different distributions. 0.15 0.15 Women: N(63.8,2.9) Men: N(68.7,3.7) Veronica: 67 inches Coach K: 71 inches 0.10 0.10 Density Density 0.05 0.05 0.00 0.00 55 60 65 70 75 80 85 55 60 65 70 75 80 85
  • 19.
    Standardizing We can compare data from different distributions using Z scores
  • 20.
    Standardizing We can compare data from different distributions using Z scores xobs −µ Standardize a value: z = σ
  • 21.
    Standardizing We can compare data from different distributions using Z scores xobs −µ Standardize a value: z = σ Gives the number of standard deviations above (or below) the mean an observation is.
  • 22.
    Standardizing We can compare data from different distributions using Z scores xobs −µ Standardize a value: z = σ Gives the number of standard deviations above (or below) the mean an observation is. Relates to standard normal distribution: N(0, 1)
  • 23.
    Standardizing (cont.) So, we can obtain our two z-scores:
  • 24.
    Standardizing (cont.) So, we can obtain our two z-scores: ZVeronica = 67−63.8 = 1.10 2.9
  • 25.
    Standardizing (cont.) So, we can obtain our two z-scores: ZVeronica = 67−63.8 = 1.10 2.9 ZCoachK = 71−68.7 = 0.89 3.7
  • 26.
    Standardizing (cont.) So, we can obtain our two z-scores: ZVeronica = 67−63.8 = 1.10 2.9 ZCoachK = 71−68.7 = 0.89 3.7 0.4 0.3 Coach K Veronica z=.89 z=1.1 Density 0.2 0.1 0.0 -3 -2 -1 0 1 2 3 Height (inches)