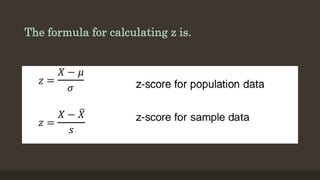
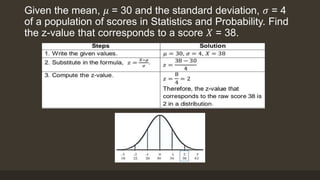
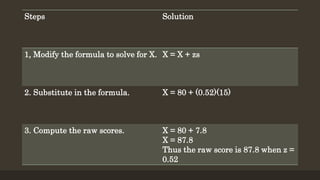
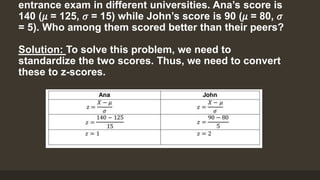
SlideShare a Scribd company logo
1 of 15
Converting a Normal Random Variable to a
Standard Normal Variable & Vice-Versa
QUARTER 3 – MELC 12
• The z-score is stated to be a measure of relative
standing. It describes a value's relationship to the
mean of a group of values.
• A Z-score can reveal if a value is typical for a
specified data set or if it is atypical. Z-scores also
make it possible for analysts to adapt scores from
various data sets to make scores that can be
compared to one another more accurately.
• Basically, a z-score gives you an idea how far a
data is from the mean.
• z-scores are a way to compare results to a “normal”
population. A lot of tests and surveys reveal thousands
of possible results and units; those results can often
seem meaningless.
• For example, knowing that someone’s height is 5 ft
might be good information, but if you want to compare it
to the “average” person’s height, looking at a vast table
of data can be overwhelming.
• A z-score can tell you where that person’s weight is
compared to the average population’s mean height.
•Most raw scores comprise large values, so
for convenience, these raw scores are
converted to a more manageable scores
known as z-scores. In this lesson, you will
learn to convert a normal random variable to
a standard normal random variable (z-
values) and vice versa.
The formula for calculating z is.
Example 1. Finding the z-value
Given the mean, 𝜇 = 30 and the standard deviation, 𝜎 = 4
of a population of scores in Statistics and Probability. Find
the z-value that corresponds to a score 𝑋 = 38.
Example 2. Finding the raw
score
Steps Solution
1, Modify the formula to solve for X. X = X + zs
2. Substitute in the formula. X = 80 + (0.52)(15)
3. Compute the raw scores. X = 80 + 7.8
X = 87.8
Thus the raw score is 87.8 when z =
0.52
Example 3. Problem Solving
entrance exam in different universities. Ana’s score is
140 (𝜇 = 125, 𝜎 = 15) while John’s score is 90 (𝜇 = 80, 𝜎
= 5). Who among them scored better than their peers?
Solution: To solve this problem, we need to
standardize the two scores. Thus, we need to convert
these to z-scores.
Activity Proper
Exercies 1. Complete the table by providing the
correct answers. Show your process on your paper.
1. Zeleo and Zoey are close buddies who took
the national achievement test. The mean score
and standard deviation are 120 and 10,
respectively. If Zeleo obtained a z-score of 1.5
and Zoey got -0.95 z-score. What were their
scores in the examination? Who scored
higher?
2. If the scores in a Statistics and Probability
test are normally distributed with a mean of 35
and standard deviation of 4.5. What is the z-
score for a score of 30?
The End

More Related Content

Similar to Converting-a-Normal-Random-Variable-to-a-Standard.pptx

Week 7 a statistics
Week 7 a statisticsWeek 7 a statistics
Week 7 a statisticswawaaa789
 
O Z Scores 68 O The Normal Curve 73 O Sample and Popul.docx
O Z Scores 68 O The Normal Curve 73 O Sample and Popul.docxO Z Scores 68 O The Normal Curve 73 O Sample and Popul.docx
O Z Scores 68 O The Normal Curve 73 O Sample and Popul.docxhopeaustin33688
 
Describing quantitative data with numbers
Describing quantitative data with numbersDescribing quantitative data with numbers
Describing quantitative data with numbersUlster BOCES
 
PSUnit_II_Lesson_2_Understanding_the_z-scores.pptx
PSUnit_II_Lesson_2_Understanding_the_z-scores.pptxPSUnit_II_Lesson_2_Understanding_the_z-scores.pptx
PSUnit_II_Lesson_2_Understanding_the_z-scores.pptxErwin806347
 
Day 4 normal curve and standard scores
Day 4 normal curve and standard scoresDay 4 normal curve and standard scores
Day 4 normal curve and standard scoresElih Sutisna Yanto
 
Answer the questions in one paragraph 4-5 sentences. · Why did t.docx
Answer the questions in one paragraph 4-5 sentences. · Why did t.docxAnswer the questions in one paragraph 4-5 sentences. · Why did t.docx
Answer the questions in one paragraph 4-5 sentences. · Why did t.docxboyfieldhouse
 
Statistics trinity college
Statistics trinity collegeStatistics trinity college
Statistics trinity collegeStacy Carter
 
Statistics trinity college
Statistics trinity collegeStatistics trinity college
Statistics trinity collegeStacy Carter
 
Basics of Stats (2).pptx
Basics of Stats (2).pptxBasics of Stats (2).pptx
Basics of Stats (2).pptxmadihamaqbool6
 
continuous probability distributions.ppt
continuous probability distributions.pptcontinuous probability distributions.ppt
continuous probability distributions.pptLLOYDARENAS1
 
Standard deviation
Standard deviationStandard deviation
Standard deviationM K
 

Similar to Converting-a-Normal-Random-Variable-to-a-Standard.pptx (20)

Chapter 5
Chapter 5Chapter 5
Chapter 5
 
Chapters 2 4
Chapters 2  4Chapters 2  4
Chapters 2 4
 
Week 7 a statistics
Week 7 a statisticsWeek 7 a statistics
Week 7 a statistics
 
O Z Scores 68 O The Normal Curve 73 O Sample and Popul.docx
O Z Scores 68 O The Normal Curve 73 O Sample and Popul.docxO Z Scores 68 O The Normal Curve 73 O Sample and Popul.docx
O Z Scores 68 O The Normal Curve 73 O Sample and Popul.docx
 
Describing quantitative data with numbers
Describing quantitative data with numbersDescribing quantitative data with numbers
Describing quantitative data with numbers
 
PSUnit_II_Lesson_2_Understanding_the_z-scores.pptx
PSUnit_II_Lesson_2_Understanding_the_z-scores.pptxPSUnit_II_Lesson_2_Understanding_the_z-scores.pptx
PSUnit_II_Lesson_2_Understanding_the_z-scores.pptx
 
Day 4 normal curve and standard scores
Day 4 normal curve and standard scoresDay 4 normal curve and standard scores
Day 4 normal curve and standard scores
 
Aron chpt 8 ed
Aron chpt 8 edAron chpt 8 ed
Aron chpt 8 ed
 
Aron chpt 8 ed
Aron chpt 8 edAron chpt 8 ed
Aron chpt 8 ed
 
Answer the questions in one paragraph 4-5 sentences. · Why did t.docx
Answer the questions in one paragraph 4-5 sentences. · Why did t.docxAnswer the questions in one paragraph 4-5 sentences. · Why did t.docx
Answer the questions in one paragraph 4-5 sentences. · Why did t.docx
 
Statistics trinity college
Statistics trinity collegeStatistics trinity college
Statistics trinity college
 
Statistics trinity college
Statistics trinity collegeStatistics trinity college
Statistics trinity college
 
Statistics excellent
Statistics excellentStatistics excellent
Statistics excellent
 
Meta analysis with R
Meta analysis with RMeta analysis with R
Meta analysis with R
 
Data analysis
Data analysisData analysis
Data analysis
 
Basics of Stats (2).pptx
Basics of Stats (2).pptxBasics of Stats (2).pptx
Basics of Stats (2).pptx
 
Medical statistics
Medical statisticsMedical statistics
Medical statistics
 
lecture6.ppt
lecture6.pptlecture6.ppt
lecture6.ppt
 
continuous probability distributions.ppt
continuous probability distributions.pptcontinuous probability distributions.ppt
continuous probability distributions.ppt
 
Standard deviation
Standard deviationStandard deviation
Standard deviation
 

Recently uploaded

Hierarchy of management that covers different levels of management
Hierarchy of management that covers different levels of managementHierarchy of management that covers different levels of management
Hierarchy of management that covers different levels of managementmkooblal
 
Employee wellbeing at the workplace.pptx
Employee wellbeing at the workplace.pptxEmployee wellbeing at the workplace.pptx
Employee wellbeing at the workplace.pptxNirmalaLoungPoorunde1
 
Organic Name Reactions for the students and aspirants of Chemistry12th.pptx
Organic Name Reactions  for the students and aspirants of Chemistry12th.pptxOrganic Name Reactions  for the students and aspirants of Chemistry12th.pptx
Organic Name Reactions for the students and aspirants of Chemistry12th.pptxVS Mahajan Coaching Centre
 
ECONOMIC CONTEXT - PAPER 1 Q3: NEWSPAPERS.pptx
ECONOMIC CONTEXT - PAPER 1 Q3: NEWSPAPERS.pptxECONOMIC CONTEXT - PAPER 1 Q3: NEWSPAPERS.pptx
ECONOMIC CONTEXT - PAPER 1 Q3: NEWSPAPERS.pptxiammrhaywood
 
Roles & Responsibilities in Pharmacovigilance
Roles & Responsibilities in PharmacovigilanceRoles & Responsibilities in Pharmacovigilance
Roles & Responsibilities in PharmacovigilanceSamikshaHamane
 
Crayon Activity Handout For the Crayon A
Crayon Activity Handout For the Crayon ACrayon Activity Handout For the Crayon A
Crayon Activity Handout For the Crayon AUnboundStockton
 
Final demo Grade 9 for demo Plan dessert.pptx
Final demo Grade 9 for demo Plan dessert.pptxFinal demo Grade 9 for demo Plan dessert.pptx
Final demo Grade 9 for demo Plan dessert.pptxAvyJaneVismanos
 
Capitol Tech U Doctoral Presentation - April 2024.pptx
Capitol Tech U Doctoral Presentation - April 2024.pptxCapitol Tech U Doctoral Presentation - April 2024.pptx
Capitol Tech U Doctoral Presentation - April 2024.pptxCapitolTechU
 
18-04-UA_REPORT_MEDIALITERAСY_INDEX-DM_23-1-final-eng.pdf
18-04-UA_REPORT_MEDIALITERAСY_INDEX-DM_23-1-final-eng.pdf18-04-UA_REPORT_MEDIALITERAСY_INDEX-DM_23-1-final-eng.pdf
18-04-UA_REPORT_MEDIALITERAСY_INDEX-DM_23-1-final-eng.pdfssuser54595a
 
Pharmacognosy Flower 3. Compositae 2023.pdf
Pharmacognosy Flower 3. Compositae 2023.pdfPharmacognosy Flower 3. Compositae 2023.pdf
Pharmacognosy Flower 3. Compositae 2023.pdfMahmoud M. Sallam
 
Framing an Appropriate Research Question 6b9b26d93da94caf993c038d9efcdedb.pdf
Framing an Appropriate Research Question 6b9b26d93da94caf993c038d9efcdedb.pdfFraming an Appropriate Research Question 6b9b26d93da94caf993c038d9efcdedb.pdf
Framing an Appropriate Research Question 6b9b26d93da94caf993c038d9efcdedb.pdfUjwalaBharambe
 
Enzyme, Pharmaceutical Aids, Miscellaneous Last Part of Chapter no 5th.pdf
Enzyme, Pharmaceutical Aids, Miscellaneous Last Part of Chapter no 5th.pdfEnzyme, Pharmaceutical Aids, Miscellaneous Last Part of Chapter no 5th.pdf
Enzyme, Pharmaceutical Aids, Miscellaneous Last Part of Chapter no 5th.pdfSumit Tiwari
 
Solving Puzzles Benefits Everyone (English).pptx
Solving Puzzles Benefits Everyone (English).pptxSolving Puzzles Benefits Everyone (English).pptx
Solving Puzzles Benefits Everyone (English).pptxOH TEIK BIN
 
EPANDING THE CONTENT OF AN OUTLINE using notes.pptx
EPANDING THE CONTENT OF AN OUTLINE using notes.pptxEPANDING THE CONTENT OF AN OUTLINE using notes.pptx
EPANDING THE CONTENT OF AN OUTLINE using notes.pptxRaymartEstabillo3
 
How to Configure Email Server in Odoo 17
How to Configure Email Server in Odoo 17How to Configure Email Server in Odoo 17
How to Configure Email Server in Odoo 17Celine George
 
“Oh GOSH! Reflecting on Hackteria's Collaborative Practices in a Global Do-It...
“Oh GOSH! Reflecting on Hackteria's Collaborative Practices in a Global Do-It...“Oh GOSH! Reflecting on Hackteria's Collaborative Practices in a Global Do-It...
“Oh GOSH! Reflecting on Hackteria's Collaborative Practices in a Global Do-It...Marc Dusseiller Dusjagr
 
ECONOMIC CONTEXT - LONG FORM TV DRAMA - PPT
ECONOMIC CONTEXT - LONG FORM TV DRAMA - PPTECONOMIC CONTEXT - LONG FORM TV DRAMA - PPT
ECONOMIC CONTEXT - LONG FORM TV DRAMA - PPTiammrhaywood
 

Recently uploaded (20)

Hierarchy of management that covers different levels of management
Hierarchy of management that covers different levels of managementHierarchy of management that covers different levels of management
Hierarchy of management that covers different levels of management
 
Employee wellbeing at the workplace.pptx
Employee wellbeing at the workplace.pptxEmployee wellbeing at the workplace.pptx
Employee wellbeing at the workplace.pptx
 
Organic Name Reactions for the students and aspirants of Chemistry12th.pptx
Organic Name Reactions  for the students and aspirants of Chemistry12th.pptxOrganic Name Reactions  for the students and aspirants of Chemistry12th.pptx
Organic Name Reactions for the students and aspirants of Chemistry12th.pptx
 
ECONOMIC CONTEXT - PAPER 1 Q3: NEWSPAPERS.pptx
ECONOMIC CONTEXT - PAPER 1 Q3: NEWSPAPERS.pptxECONOMIC CONTEXT - PAPER 1 Q3: NEWSPAPERS.pptx
ECONOMIC CONTEXT - PAPER 1 Q3: NEWSPAPERS.pptx
 
Roles & Responsibilities in Pharmacovigilance
Roles & Responsibilities in PharmacovigilanceRoles & Responsibilities in Pharmacovigilance
Roles & Responsibilities in Pharmacovigilance
 
Crayon Activity Handout For the Crayon A
Crayon Activity Handout For the Crayon ACrayon Activity Handout For the Crayon A
Crayon Activity Handout For the Crayon A
 
Final demo Grade 9 for demo Plan dessert.pptx
Final demo Grade 9 for demo Plan dessert.pptxFinal demo Grade 9 for demo Plan dessert.pptx
Final demo Grade 9 for demo Plan dessert.pptx
 
9953330565 Low Rate Call Girls In Rohini Delhi NCR
9953330565 Low Rate Call Girls In Rohini  Delhi NCR9953330565 Low Rate Call Girls In Rohini  Delhi NCR
9953330565 Low Rate Call Girls In Rohini Delhi NCR
 
Capitol Tech U Doctoral Presentation - April 2024.pptx
Capitol Tech U Doctoral Presentation - April 2024.pptxCapitol Tech U Doctoral Presentation - April 2024.pptx
Capitol Tech U Doctoral Presentation - April 2024.pptx
 
Model Call Girl in Bikash Puri Delhi reach out to us at 🔝9953056974🔝
Model Call Girl in Bikash Puri  Delhi reach out to us at 🔝9953056974🔝Model Call Girl in Bikash Puri  Delhi reach out to us at 🔝9953056974🔝
Model Call Girl in Bikash Puri Delhi reach out to us at 🔝9953056974🔝
 
18-04-UA_REPORT_MEDIALITERAСY_INDEX-DM_23-1-final-eng.pdf
18-04-UA_REPORT_MEDIALITERAСY_INDEX-DM_23-1-final-eng.pdf18-04-UA_REPORT_MEDIALITERAСY_INDEX-DM_23-1-final-eng.pdf
18-04-UA_REPORT_MEDIALITERAСY_INDEX-DM_23-1-final-eng.pdf
 
Pharmacognosy Flower 3. Compositae 2023.pdf
Pharmacognosy Flower 3. Compositae 2023.pdfPharmacognosy Flower 3. Compositae 2023.pdf
Pharmacognosy Flower 3. Compositae 2023.pdf
 
Model Call Girl in Tilak Nagar Delhi reach out to us at 🔝9953056974🔝
Model Call Girl in Tilak Nagar Delhi reach out to us at 🔝9953056974🔝Model Call Girl in Tilak Nagar Delhi reach out to us at 🔝9953056974🔝
Model Call Girl in Tilak Nagar Delhi reach out to us at 🔝9953056974🔝
 
Framing an Appropriate Research Question 6b9b26d93da94caf993c038d9efcdedb.pdf
Framing an Appropriate Research Question 6b9b26d93da94caf993c038d9efcdedb.pdfFraming an Appropriate Research Question 6b9b26d93da94caf993c038d9efcdedb.pdf
Framing an Appropriate Research Question 6b9b26d93da94caf993c038d9efcdedb.pdf
 
Enzyme, Pharmaceutical Aids, Miscellaneous Last Part of Chapter no 5th.pdf
Enzyme, Pharmaceutical Aids, Miscellaneous Last Part of Chapter no 5th.pdfEnzyme, Pharmaceutical Aids, Miscellaneous Last Part of Chapter no 5th.pdf
Enzyme, Pharmaceutical Aids, Miscellaneous Last Part of Chapter no 5th.pdf
 
Solving Puzzles Benefits Everyone (English).pptx
Solving Puzzles Benefits Everyone (English).pptxSolving Puzzles Benefits Everyone (English).pptx
Solving Puzzles Benefits Everyone (English).pptx
 
EPANDING THE CONTENT OF AN OUTLINE using notes.pptx
EPANDING THE CONTENT OF AN OUTLINE using notes.pptxEPANDING THE CONTENT OF AN OUTLINE using notes.pptx
EPANDING THE CONTENT OF AN OUTLINE using notes.pptx
 
How to Configure Email Server in Odoo 17
How to Configure Email Server in Odoo 17How to Configure Email Server in Odoo 17
How to Configure Email Server in Odoo 17
 
“Oh GOSH! Reflecting on Hackteria's Collaborative Practices in a Global Do-It...
“Oh GOSH! Reflecting on Hackteria's Collaborative Practices in a Global Do-It...“Oh GOSH! Reflecting on Hackteria's Collaborative Practices in a Global Do-It...
“Oh GOSH! Reflecting on Hackteria's Collaborative Practices in a Global Do-It...
 
ECONOMIC CONTEXT - LONG FORM TV DRAMA - PPT
ECONOMIC CONTEXT - LONG FORM TV DRAMA - PPTECONOMIC CONTEXT - LONG FORM TV DRAMA - PPT
ECONOMIC CONTEXT - LONG FORM TV DRAMA - PPT
 

Converting-a-Normal-Random-Variable-to-a-Standard.pptx

  • 1. Converting a Normal Random Variable to a Standard Normal Variable & Vice-Versa QUARTER 3 – MELC 12
  • 2. • The z-score is stated to be a measure of relative standing. It describes a value's relationship to the mean of a group of values. • A Z-score can reveal if a value is typical for a specified data set or if it is atypical. Z-scores also make it possible for analysts to adapt scores from various data sets to make scores that can be compared to one another more accurately. • Basically, a z-score gives you an idea how far a data is from the mean.
  • 3. • z-scores are a way to compare results to a “normal” population. A lot of tests and surveys reveal thousands of possible results and units; those results can often seem meaningless. • For example, knowing that someone’s height is 5 ft might be good information, but if you want to compare it to the “average” person’s height, looking at a vast table of data can be overwhelming. • A z-score can tell you where that person’s weight is compared to the average population’s mean height.
  • 4. •Most raw scores comprise large values, so for convenience, these raw scores are converted to a more manageable scores known as z-scores. In this lesson, you will learn to convert a normal random variable to a standard normal random variable (z- values) and vice versa.
  • 5. The formula for calculating z is.
  • 6. Example 1. Finding the z-value
  • 7. Given the mean, 𝜇 = 30 and the standard deviation, 𝜎 = 4 of a population of scores in Statistics and Probability. Find the z-value that corresponds to a score 𝑋 = 38.
  • 8. Example 2. Finding the raw score
  • 9. Steps Solution 1, Modify the formula to solve for X. X = X + zs 2. Substitute in the formula. X = 80 + (0.52)(15) 3. Compute the raw scores. X = 80 + 7.8 X = 87.8 Thus the raw score is 87.8 when z = 0.52
  • 11. entrance exam in different universities. Ana’s score is 140 (𝜇 = 125, 𝜎 = 15) while John’s score is 90 (𝜇 = 80, 𝜎 = 5). Who among them scored better than their peers? Solution: To solve this problem, we need to standardize the two scores. Thus, we need to convert these to z-scores.
  • 13. Exercies 1. Complete the table by providing the correct answers. Show your process on your paper.
  • 14. 1. Zeleo and Zoey are close buddies who took the national achievement test. The mean score and standard deviation are 120 and 10, respectively. If Zeleo obtained a z-score of 1.5 and Zoey got -0.95 z-score. What were their scores in the examination? Who scored higher? 2. If the scores in a Statistics and Probability test are normally distributed with a mean of 35 and standard deviation of 4.5. What is the z- score for a score of 30?