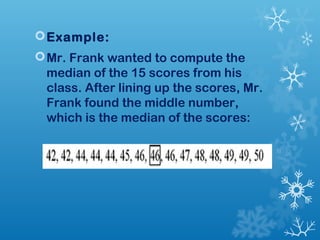
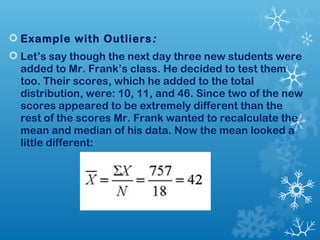
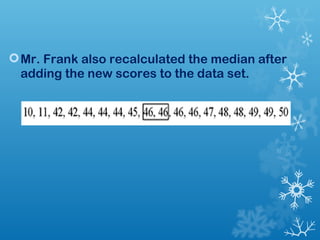
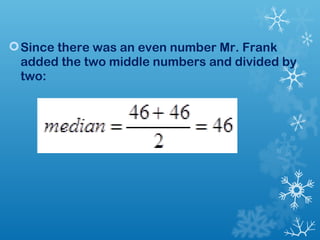
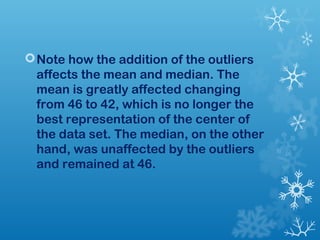
MEDIAN
median, is the middle score in the 
distribution when the numbers have 
been arranged into numerical order, 
from either highest to lowest or lowest 
to highest. Like the mean, the median 
is a numerical representation of the 
center of the data set, and can be 
used with interval or ratio data. The 
median can also be used for ordinal 
data
 To find the median, one lines up the scores 
from highest to lowest (or lowest to highest) 
and simply finds the middle score. If there is 
an odd number of scores, the median is the 
middle number of the lined up data set. If 
there is an even number of scores, the 
median is found by averaging the two middle 
numbers (adding them up and dividing by 
two) and that average is the median for the 
data.
 Unlike the mean, extreme scores in the data 
set, called outliers, have less of an effect on 
the median. When outliers are present, the 
mean is “pulled” in the direction of the 
outlier, meaning an extremely high score 
would result in a higher mean than if the 
outlier was not present. The median on the 
other hand, would be less affected by the 
outlier, often resulting in little or no change 
in the median.
The effect of outliers will be more 
apparent when examining data 
graphs in the distribution shape 
(skew) section.
Example: 
Mr. Frank wanted to compute the 
median of the 15 scores from his 
class. After lining up the scores, Mr. 
Frank found the middle number, 
which is the median of the scores:
 Example with Outliers: 
 Let’s say though the next day three new students were 
added to Mr. Frank’s class. He decided to test them 
too. Their scores, which he added to the total 
distribution, were: 10, 11, and 46. Since two of the new 
scores appeared to be extremely different than the 
rest of the scores Mr. Frank wanted to recalculate the 
mean and median of his data. Now the mean looked a 
little different:
Mr. Frank also recalculated the median after 
adding the new scores to the data set.
Since there was an even number Mr. Frank 
added the two middle numbers and divided by 
two:
Note how the addition of the outliers 
affects the mean and median. The 
mean is greatly affected changing 
from 46 to 42, which is no longer the 
best representation of the center of 
the data set. The median, on the other 
hand, was unaffected by the outliers 
and remained at 46.

Median

  • 1.
  • 2.
    median, is themiddle score in the distribution when the numbers have been arranged into numerical order, from either highest to lowest or lowest to highest. Like the mean, the median is a numerical representation of the center of the data set, and can be used with interval or ratio data. The median can also be used for ordinal data
  • 3.
     To findthe median, one lines up the scores from highest to lowest (or lowest to highest) and simply finds the middle score. If there is an odd number of scores, the median is the middle number of the lined up data set. If there is an even number of scores, the median is found by averaging the two middle numbers (adding them up and dividing by two) and that average is the median for the data.
  • 4.
     Unlike themean, extreme scores in the data set, called outliers, have less of an effect on the median. When outliers are present, the mean is “pulled” in the direction of the outlier, meaning an extremely high score would result in a higher mean than if the outlier was not present. The median on the other hand, would be less affected by the outlier, often resulting in little or no change in the median.
  • 5.
    The effect ofoutliers will be more apparent when examining data graphs in the distribution shape (skew) section.
  • 6.
    Example: Mr. Frankwanted to compute the median of the 15 scores from his class. After lining up the scores, Mr. Frank found the middle number, which is the median of the scores:
  • 7.
     Example withOutliers:  Let’s say though the next day three new students were added to Mr. Frank’s class. He decided to test them too. Their scores, which he added to the total distribution, were: 10, 11, and 46. Since two of the new scores appeared to be extremely different than the rest of the scores Mr. Frank wanted to recalculate the mean and median of his data. Now the mean looked a little different:
  • 8.
    Mr. Frank alsorecalculated the median after adding the new scores to the data set.
  • 9.
    Since there wasan even number Mr. Frank added the two middle numbers and divided by two:
  • 10.
    Note how theaddition of the outliers affects the mean and median. The mean is greatly affected changing from 46 to 42, which is no longer the best representation of the center of the data set. The median, on the other hand, was unaffected by the outliers and remained at 46.