WELL LOG : Types of Logs, The Bore Hole Image, Interpreting Geophysical Well Logs, applications, Production logs, Well Log Classification and Cataloging
Introduction
Petrophysic of the rocks
It is the study of the physical and chemical properties of the rocks related to the pores and fluid distribution
Porosity, is ratio between volume of void to the total voids of the rock.
Permeability, is ability of a porous material to allow fluids to pass through it.
Electric, most of the sedimentary rocks don’t have conductivity.
Radiation, clay rocks have 40K, radiate alpha ray.
Hardness, it depends on the cementing material and thickness of the sediments.
WELL LOGGING
The systematic recording of rock properties and it’s fluid contents in wells being drilled or produced to obtain various petrophysical parameters and characteristics of down hole sequences (G.E Archie 1950).
The measurement versus depth or time, or both, of one or more physical properties in a well.
These methods are particularly good when surface outcrops are not available, but a direct sample of the rock is needed to be sure of the lithology.
A wide range of physical parameters can be measured.
In some cases, the measurements are not direct, it require interpretation by analogy or by correlating values between two or more logs run in the same hole.
Provide information on lithology, boundaries of formations and stratigraphic correlation.
Determine Porosity, Permeability, water, oil and gas saturation.
Reservoir modeling and Structural studies… etc.
Types of Well Logging
Logs can be classified into several types under different category
Permeability and lithology Logs
Gamma Ray log
Self Potential [SP] log
Caliber log
Porosity Logs
Density log
Sonic log
Neutron log
Electrical Logs
Resistivity Log
For contact : omerupto3@gmail.com
Well logs can be states as “a recording against depth of any of the characteristics of the rock formations traversed by a measuring apparatus in the well-bore.”
Types of sonic logging tools are explained briefly with help of animation and what are the application of these tools in determining the formation properties.
A small presentation about wireline logs, showing their function or the technology that they use.
Ruhr-Universität Bochum, Petroleum Geology II, Winter Semester 2013/2014.
This document provides a basic overview of the fundamental rock properties. It delivers a detailed analysis of the basic reservoir rock properties like porosity, permeability, Fluid saturation , wettability, etc.
image logs were introduced by schlumberger in 1980.
these logs are advanced and most widely use in industry.
Image logs can provide detailed picture of the wellbore that represent the geological and petro physical properties of the section being logged.
Slide1:
Seismic Sources
HOW TO GENERATE SEISMIC WAVES?
Exploration seismology – mostly artificial sources
à active technique
Natural sources can also be used (e.g. earthquakes) – usually
for tectonic studies (passive seismic exploration)
!
What is a good source?
- economical, efficient, convenient
- safe and environmentally acceptable
- sufficient energy over the suitable frequency range
- repeatable
Slide 2:
Land seismic sources
Explosives: - usually detonated in boreholes or buried
PROS
- sharp, impulsive, high amplitude (mostly P-wave)
- reasonably cheap
CONS
- The signal is not repeatable
- slow (borehole drilling)
- can be destructive
A coordinate system is a reference system used to represent the locations of geographic features, imagery, and observations, within a common geographic framework.
Coordinate systems enable geographic datasets to use common locations for integration.
The Global Positioning System (GPS), originally Navstar GPS,[1][2] is a space-based radionavigation system owned by the United States government and operated by the United States Air Force. It is a global navigation satellite system that provides geolocation and time information to a GPS receiver anywhere on or near the Earth where there is an unobstructed line of sight to four or more GPS satellites
What is remote sensing?
Observing or measuring things from a distance
How is remote sensing useful?
It enables us to study nature in ways that would otherwise be beyond human capability, across great distances and at wavelengths of light invisible to human eyes.
How is remote sensing done?
By employing special detectors to record light as it’s emitted or
reflected by the objects of interest to us; and
By studying and manipulating the recorded images we get, so that we can answer our questions about nature.
A map projection is a systematic transformation of the latitudes and longitudes of locations from the surface of a sphere or an ellipsoid into locations on a plane. Maps cannot be created without map projections.
NO1 Uk best vashikaran specialist in delhi vashikaran baba near me online vas...Amil Baba Dawood bangali
Contact with Dawood Bhai Just call on +92322-6382012 and we'll help you. We'll solve all your problems within 12 to 24 hours and with 101% guarantee and with astrology systematic. If you want to take any personal or professional advice then also you can call us on +92322-6382012 , ONLINE LOVE PROBLEM & Other all types of Daily Life Problem's.Then CALL or WHATSAPP us on +92322-6382012 and Get all these problems solutions here by Amil Baba DAWOOD BANGALI
#vashikaranspecialist #astrologer #palmistry #amliyaat #taweez #manpasandshadi #horoscope #spiritual #lovelife #lovespell #marriagespell#aamilbabainpakistan #amilbabainkarachi #powerfullblackmagicspell #kalajadumantarspecialist #realamilbaba #AmilbabainPakistan #astrologerincanada #astrologerindubai #lovespellsmaster #kalajaduspecialist #lovespellsthatwork #aamilbabainlahore#blackmagicformarriage #aamilbaba #kalajadu #kalailam #taweez #wazifaexpert #jadumantar #vashikaranspecialist #astrologer #palmistry #amliyaat #taweez #manpasandshadi #horoscope #spiritual #lovelife #lovespell #marriagespell#aamilbabainpakistan #amilbabainkarachi #powerfullblackmagicspell #kalajadumantarspecialist #realamilbaba #AmilbabainPakistan #astrologerincanada #astrologerindubai #lovespellsmaster #kalajaduspecialist #lovespellsthatwork #aamilbabainlahore #blackmagicforlove #blackmagicformarriage #aamilbaba #kalajadu #kalailam #taweez #wazifaexpert #jadumantar #vashikaranspecialist #astrologer #palmistry #amliyaat #taweez #manpasandshadi #horoscope #spiritual #lovelife #lovespell #marriagespell#aamilbabainpakistan #amilbabainkarachi #powerfullblackmagicspell #kalajadumantarspecialist #realamilbaba #AmilbabainPakistan #astrologerincanada #astrologerindubai #lovespellsmaster #kalajaduspecialist #lovespellsthatwork #aamilbabainlahore #Amilbabainuk #amilbabainspain #amilbabaindubai #Amilbabainnorway #amilbabainkrachi #amilbabainlahore #amilbabaingujranwalan #amilbabainislamabad
Quality defects in TMT Bars, Possible causes and Potential Solutions.PrashantGoswami42
Maintaining high-quality standards in the production of TMT bars is crucial for ensuring structural integrity in construction. Addressing common defects through careful monitoring, standardized processes, and advanced technology can significantly improve the quality of TMT bars. Continuous training and adherence to quality control measures will also play a pivotal role in minimizing these defects.
Vaccine management system project report documentation..pdfKamal Acharya
The Division of Vaccine and Immunization is facing increasing difficulty monitoring vaccines and other commodities distribution once they have been distributed from the national stores. With the introduction of new vaccines, more challenges have been anticipated with this additions posing serious threat to the already over strained vaccine supply chain system in Kenya.
Final project report on grocery store management system..pdfKamal Acharya
In today’s fast-changing business environment, it’s extremely important to be able to respond to client needs in the most effective and timely manner. If your customers wish to see your business online and have instant access to your products or services.
Online Grocery Store is an e-commerce website, which retails various grocery products. This project allows viewing various products available enables registered users to purchase desired products instantly using Paytm, UPI payment processor (Instant Pay) and also can place order by using Cash on Delivery (Pay Later) option. This project provides an easy access to Administrators and Managers to view orders placed using Pay Later and Instant Pay options.
In order to develop an e-commerce website, a number of Technologies must be studied and understood. These include multi-tiered architecture, server and client-side scripting techniques, implementation technologies, programming language (such as PHP, HTML, CSS, JavaScript) and MySQL relational databases. This is a project with the objective to develop a basic website where a consumer is provided with a shopping cart website and also to know about the technologies used to develop such a website.
This document will discuss each of the underlying technologies to create and implement an e- commerce website.
Welcome to WIPAC Monthly the magazine brought to you by the LinkedIn Group Water Industry Process Automation & Control.
In this month's edition, along with this month's industry news to celebrate the 13 years since the group was created we have articles including
A case study of the used of Advanced Process Control at the Wastewater Treatment works at Lleida in Spain
A look back on an article on smart wastewater networks in order to see how the industry has measured up in the interim around the adoption of Digital Transformation in the Water Industry.
About
Indigenized remote control interface card suitable for MAFI system CCR equipment. Compatible for IDM8000 CCR. Backplane mounted serial and TCP/Ethernet communication module for CCR remote access. IDM 8000 CCR remote control on serial and TCP protocol.
• Remote control: Parallel or serial interface.
• Compatible with MAFI CCR system.
• Compatible with IDM8000 CCR.
• Compatible with Backplane mount serial communication.
• Compatible with commercial and Defence aviation CCR system.
• Remote control system for accessing CCR and allied system over serial or TCP.
• Indigenized local Support/presence in India.
• Easy in configuration using DIP switches.
Technical Specifications
Indigenized remote control interface card suitable for MAFI system CCR equipment. Compatible for IDM8000 CCR. Backplane mounted serial and TCP/Ethernet communication module for CCR remote access. IDM 8000 CCR remote control on serial and TCP protocol.
Key Features
Indigenized remote control interface card suitable for MAFI system CCR equipment. Compatible for IDM8000 CCR. Backplane mounted serial and TCP/Ethernet communication module for CCR remote access. IDM 8000 CCR remote control on serial and TCP protocol.
• Remote control: Parallel or serial interface
• Compatible with MAFI CCR system
• Copatiable with IDM8000 CCR
• Compatible with Backplane mount serial communication.
• Compatible with commercial and Defence aviation CCR system.
• Remote control system for accessing CCR and allied system over serial or TCP.
• Indigenized local Support/presence in India.
Application
• Remote control: Parallel or serial interface.
• Compatible with MAFI CCR system.
• Compatible with IDM8000 CCR.
• Compatible with Backplane mount serial communication.
• Compatible with commercial and Defence aviation CCR system.
• Remote control system for accessing CCR and allied system over serial or TCP.
• Indigenized local Support/presence in India.
• Easy in configuration using DIP switches.
CFD Simulation of By-pass Flow in a HRSG module by R&R Consult.pptxR&R Consult
CFD analysis is incredibly effective at solving mysteries and improving the performance of complex systems!
Here's a great example: At a large natural gas-fired power plant, where they use waste heat to generate steam and energy, they were puzzled that their boiler wasn't producing as much steam as expected.
R&R and Tetra Engineering Group Inc. were asked to solve the issue with reduced steam production.
An inspection had shown that a significant amount of hot flue gas was bypassing the boiler tubes, where the heat was supposed to be transferred.
R&R Consult conducted a CFD analysis, which revealed that 6.3% of the flue gas was bypassing the boiler tubes without transferring heat. The analysis also showed that the flue gas was instead being directed along the sides of the boiler and between the modules that were supposed to capture the heat. This was the cause of the reduced performance.
Based on our results, Tetra Engineering installed covering plates to reduce the bypass flow. This improved the boiler's performance and increased electricity production.
It is always satisfying when we can help solve complex challenges like this. Do your systems also need a check-up or optimization? Give us a call!
Work done in cooperation with James Malloy and David Moelling from Tetra Engineering.
More examples of our work https://www.r-r-consult.dk/en/cases-en/
COLLEGE BUS MANAGEMENT SYSTEM PROJECT REPORT.pdfKamal Acharya
The College Bus Management system is completely developed by Visual Basic .NET Version. The application is connect with most secured database language MS SQL Server. The application is develop by using best combination of front-end and back-end languages. The application is totally design like flat user interface. This flat user interface is more attractive user interface in 2017. The application is gives more important to the system functionality. The application is to manage the student’s details, driver’s details, bus details, bus route details, bus fees details and more. The application has only one unit for admin. The admin can manage the entire application. The admin can login into the application by using username and password of the admin. The application is develop for big and small colleges. It is more user friendly for non-computer person. Even they can easily learn how to manage the application within hours. The application is more secure by the admin. The system will give an effective output for the VB.Net and SQL Server given as input to the system. The compiled java program given as input to the system, after scanning the program will generate different reports. The application generates the report for users. The admin can view and download the report of the data. The application deliver the excel format reports. Because, excel formatted reports is very easy to understand the income and expense of the college bus. This application is mainly develop for windows operating system users. In 2017, 73% of people enterprises are using windows operating system. So the application will easily install for all the windows operating system users. The application-developed size is very low. The application consumes very low space in disk. Therefore, the user can allocate very minimum local disk space for this application.
Forklift Classes Overview by Intella PartsIntella Parts
Discover the different forklift classes and their specific applications. Learn how to choose the right forklift for your needs to ensure safety, efficiency, and compliance in your operations.
For more technical information, visit our website https://intellaparts.com
Immunizing Image Classifiers Against Localized Adversary Attacksgerogepatton
This paper addresses the vulnerability of deep learning models, particularly convolutional neural networks
(CNN)s, to adversarial attacks and presents a proactive training technique designed to counter them. We
introduce a novel volumization algorithm, which transforms 2D images into 3D volumetric representations.
When combined with 3D convolution and deep curriculum learning optimization (CLO), itsignificantly improves
the immunity of models against localized universal attacks by up to 40%. We evaluate our proposed approach
using contemporary CNN architectures and the modified Canadian Institute for Advanced Research (CIFAR-10
and CIFAR-100) and ImageNet Large Scale Visual Recognition Challenge (ILSVRC12) datasets, showcasing
accuracy improvements over previous techniques. The results indicate that the combination of the volumetric
input and curriculum learning holds significant promise for mitigating adversarial attacks without necessitating
adversary training.
Sachpazis:Terzaghi Bearing Capacity Estimation in simple terms with Calculati...Dr.Costas Sachpazis
Terzaghi's soil bearing capacity theory, developed by Karl Terzaghi, is a fundamental principle in geotechnical engineering used to determine the bearing capacity of shallow foundations. This theory provides a method to calculate the ultimate bearing capacity of soil, which is the maximum load per unit area that the soil can support without undergoing shear failure. The Calculation HTML Code included.
Sachpazis:Terzaghi Bearing Capacity Estimation in simple terms with Calculati...
Well log (The Bore Hole Image)
1. WELL LOG (The Bore Hole Image)
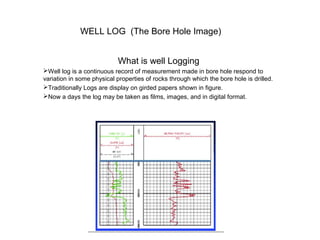
What is well Logging
Well log is a continuous record of measurement made in bore hole respond to
variation in some physical properties of rocks through which the bore hole is drilled.
Traditionally Logs are display on girded papers shown in figure.
Now a days the log may be taken as films, images, and in digital format.
2. HISTORY
1912 Conrad Schlumberger give the idea of using electrical measurements to map subsurface
rock bodies.
in 1919 Conrad Schlumberger and his brother Marcel begin work on well logs.
The first electrical resistivity well log was taken in France, in 1927.
The instrument which was use for this purpose is called SONDE, the sond was stopped at
periodic intervals in bore hole and the and resistivity was plotted on graph paper.
In 1929 the electrical resistivity logs are introduce on commercial scale in Venezuela, USA and
Russia
For correlation and identification of Hydrocarbon bearing strata.
The photographic – film recorder was developed in 1936 the curves were SN,LN AND LAT
The dip meter log were developed in 1930
The Gamma Ray and Neutron Log were begin in 1941
3. LOGGING UNITS
• Logging service companies utilize a variety of
logging units, depending on the location
(onshore or offshore) and requirements of the
logging run. Each unit will contain the
following components:
• logging cable
• winch to raise and lower the cable in the well
• self-contained 120-volt AC generator
• set of surface control panels
• set of downhole tools (sondes and cartridges)
• digital recording system
8. LOG INTERPRETATION OBJECTIVES
• The objective of log interpretation depends very much on the user. Quantitative analysis of well
logs provides the analyst with values for a variety of primary parameters, such as:
• porosity
• water saturation, fluid type (oil/gas/water)
• lithology
• permeability
• From these, many corollary parameters can be derived by integration (and other means) to arrive
at values for:
• hydrocarbons-in-place
• reserves (the recoverable fraction of hydrocarbons in-place)
• mapping reservoir parameters
• But not all users of wireline logs have quantitative analysis as their objective. Many of them are
more concerned with the geological and geophysical aspects. These users are interested in
interpretation for:
• well-to-well correlation
• facies analysis
• regional structural and sedimentary history
• In quantitative log analysis, the objective is to define
• the type of reservoir (lithology)
• its storage capacity (porosity)
• its hydrocarbon type and content (saturation)
• its producibility (permeability)
9. GAMMA RAY LOGGAMMA RAY LOG
• Gamma Rays are high-energy electromagnetic waves which are emitted by atomic nuclei as a form
of radiation
• Gamma ray log is measurement of natural radioactivity in formation verses depth.
• It measures the radiation emitting from naturally occurring U, Th, and K.
• It is also known as shale log.
• GR log reflects shale or clay content.
• Clean formations have low radioactivity level.
• Correlation between wells,
• Determination of bed boundaries,
• Evaluation of shale content within a formation,
• Mineral analysis,
• Depth control for log tie-ins, side-wall coring, or perforating.
• Particularly useful for defining shale beds when the sp is featureless
• GR log can be run in both open and cased hole
10. Spontaneous Potential Log (SP)Spontaneous Potential Log (SP)
• The spontaneous potential (SP) curve records
the naturally occurring electrical potential
(voltage) produced by the interaction of
formation connate water, conductive drilling
fluid, and shale
• The SP curve reflects a difference in the
electrical potential between a movable
electrode in the borehole and a fixed reference
electrode at the surface
• Though the SP is used primarily as a lithology
indicator and as a correlation tool, it has other
uses as well:
– permeability indicator,
– shale volume indicator
– porosity indicator, and
– measurement of Rw (hence formation
water salinity).
11. Neutron LoggingNeutron Logging
• The Neutron Log is primarily used to evaluate
formation porosity, but the fact that it is really
just a hydrogen detector should always be kept
in mind
• It is used to detect gas in certain situations,
exploiting the lower hydrogen density, or
hydrogen index
• The Neutron Log can be summarized as the
continuous measurement of the induced
radiation produced by the bombardment of that
formation with a neutron source contained in
the logging tool which sources emit fast
neutrons that are eventually slowed by collisions
with hydrogen atoms until they are captured
(think of a billiard ball metaphor where the
similar size of the particles is a factor). The
capture results in the emission of a secondary
gamma ray; some tools, especially older ones,
detect the capture gamma ray (neutron-gamma
log). Other tools detect intermediate
(epithermal) neutrons or slow (thermal)
neutrons (both referred to as neutron-neutron
logs). Modern neutron tools most commonly
count thermal neutrons with an He-3 type
detector.
12. The Density LogThe Density Log
• The formation density log is a porosity log that measures electron
density of a formation
• Dense formations absorb many gamma rays, while low-density formations
absorb fewer. Thus, high-count rates at the detectors indicate low-density
formations, whereas low count rates at the detectors indicate high-density
formations.
• Therefore, scattered gamma rays reaching the detector is an indication of
formation Density.
Scale and units:
The most frequently used scales are a range of 2.0 to 3.0 gm/cc or 1.95
to 2.95 gm/cc across two tracks.
A density derived porosity curve is sometimes present in tracks #2 and
#3 along with the bulk density (rb) and correction (Dr) curves. Track #1
contains a gamma ray log and caliper.
13. Resistivity LogResistivity Log
• Basics about the Resistivity:
• Resistivity measures the electric properties of the formation,
• Resistivity is measured as, R in W per m,
• Resistivity is the inverse of conductivity,
• The ability to conduct electric current depends upon:
• The Volume of water,
• The Temperature of the formation,
• The Salinity of the formation
The Resistivity Log:
Resistivity logs measure the ability of rocks to
conduct electrical current and are scaled in units of ohm-
meters.
The Usage:
Resistivity logs are electric logs which are used
to:
Determine Hydrocarbon versus Water-bearing zones,
Indicate Permeable zones,
Determine Resisitivity Porosity.
14. Shayan Ahmad Yar(Pakistan)
• Acoustic tools measure the speed of sound waves in
subsurface formations. While the acoustic log can be
used to determine porosity in consolidated formations, it
is also valuable in other applications, such as:
• Indicating lithology (using the ratio of compressional
velocity over shear velocity),
• Determining integrated travel time (an important tool for
seismic/wellbore correlation),
• Correlation with other wells
• Detecting fractures and evaluating secondary porosity,
• Evaluating cement bonds between casing, and formation,
• Detecting over-pressure,
• Determining mechanical properties (in combination with
the density log), and
• Determining acoustic impedance (in combination with the
density log).
Acoustic LogAcoustic Log