Downloaded 361 times

![Spontaneous Potential [SP]
• It measures natural electrical potential found within the earth.
• S.P. in a hole is due to electrochemical and elctrokinetic or
streaming potentials.
• Electrochemical potentials are due to differences in conc. of
activities of the formation water and mud filtrate called liquid
junction potential.
• Membrane potential is due to presence of shale layers.
• The streaming potential is due to electro-filtration of the mud
through the mud cake.
• Chemical activity is proportional/related to the salt content and
hence to the resistivity.](https://image.slidesharecdn.com/subsurfacegeophysicalmethods-160823084143/85/Subsurface-geophysical-methods-11-320.jpg)
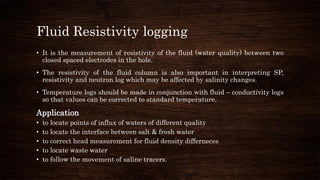
![Spontaneous Potential [SP]
• If the permeable formation is not shaly, SP is
𝑆𝑃 = −𝐾𝑙𝑜𝑔
𝑅 𝑚𝑓
𝑅 𝑤
where, K = coeff. proportional to absolute temp. of formation
𝑅 𝑚𝑓 = resistivity of mud fluid
𝑅 𝑤 = resistivity of formation water
• SP log is obtained by recording potential differences against depth, b/w a fixed surface
electrode and a moveable electrode in the borehole.
• Potentials associated with shales and clays are normally the least negative, the SP
curve is a straight line called the shale baseline.
• Opposite the permeable formations, the SP curve shifts either to the left (-ve) or to the
right (+ve) depending on the relative salinities of the formation water and the mud
filtrate.](https://image.slidesharecdn.com/subsurfacegeophysicalmethods-160823084143/85/Subsurface-geophysical-methods-12-320.jpg)
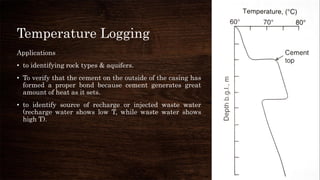
![Spontaneous Potential [SP]
Applications
• To calculate formation water resistivity
• To locate bed boundaries.
• To distinguish b/w shales and sandstone or limestone
in comination with other logs.
• For stratigraphic correlation
Factors affected SP log
• Hole diameter
• Bed thickness
• Water or mud resistivity
• Density
• Chemical compostion
• Cake thickness
• Mud filtrate invasion well temperature](https://image.slidesharecdn.com/subsurfacegeophysicalmethods-160823084143/85/Subsurface-geophysical-methods-13-320.jpg)
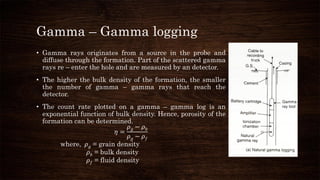
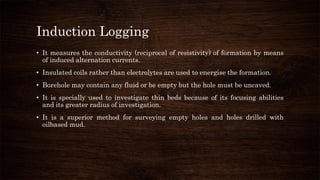
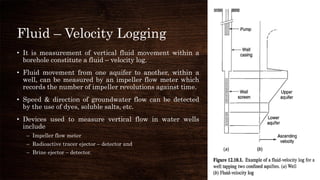
![Radioactivity Logging
• Also known as nuclear or radiation logging.
• It involves the measurement of fundamental particles emitted from unstable
radioactive isotope.
• Radioactive logs can be used in cased as well as in open holes. [Advantage]
• Radioactive logs are of two general types
– those which measure the natural radioactivity of formations (gamma ray log) and
– those which detect radiation reflected from or induced in the formation from an artificial
from an artificial source (neutron logs)
• Since, Gamma ray log are recorded in two ways
– Natural Gamma log
– Gamma – Gamma log](https://image.slidesharecdn.com/subsurfacegeophysicalmethods-160823084143/85/Subsurface-geophysical-methods-14-320.jpg)
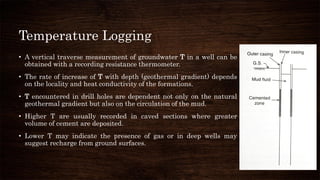
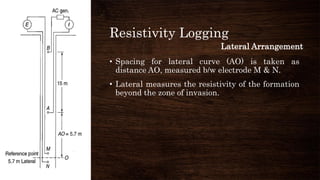
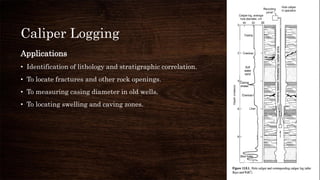
![Caliper Logging
• A caliper log provides a record of the average diameter of a
borehole.
• Caliper tools are designed either with arms hinged at the
upper end and pressed against the hole wall by springs or
with bow springs fastened at both ends.
• The hole diameter will be equal to the size of drilling bit,
when a hard sandstone or limestone is traversed.
• Well bore becomes enlarged in shale beds because the shale
becomes wet with the mud fluid, slough off and cave into
the hole.
• It can determine enlarged hole up to the maximum spread
of the caliper arm [Limit]](https://image.slidesharecdn.com/subsurfacegeophysicalmethods-160823084143/85/Subsurface-geophysical-methods-25-320.jpg)


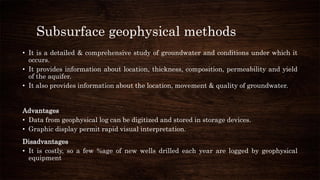
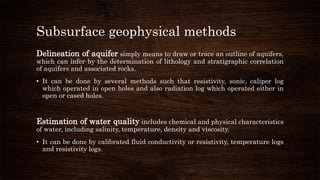
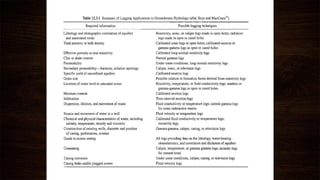
This document discusses various geophysical well logging methods used to delineate aquifers and estimate water quality, including resistivity, spontaneous potential, radioactivity, neutron, temperature, and fluid resistivity logging. Resistivity logging measures the resistivity of formations and can help determine lithology, porosity, and fluid salinity. Spontaneous potential logging indicates bed boundaries and distinguishes shale from permeable rocks. Radioactivity logging uses natural gamma rays or gamma-gamma techniques to identify lithology and determine porosity. Neutron logging measures hydrogen content to estimate porosity and moisture levels. Temperature and fluid resistivity logging provide additional information about groundwater. These geophysical logs provide critical subsurface data for groundwater exploration and management.