Downloaded 139 times


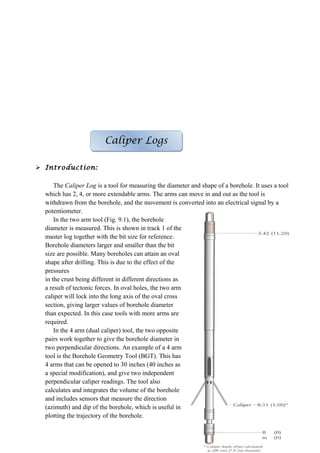


Well logging involves lowering instrumentation into oil and gas wells to collect data about the surrounding rock formations. A well log records measurements from these instruments and provides information to geologists, geophysicists, drilling engineers, and reservoir engineers. Common logs measure properties like electron density, acoustic travel times, resistivity, and neutron absorption to characterize formations and identify potential reservoirs. Well logs are presented as tracks on a plot against depth to interpret features like formation tops, pore fluid content, and stress orientations deduced from borehole breakouts.