Downloaded 362 times


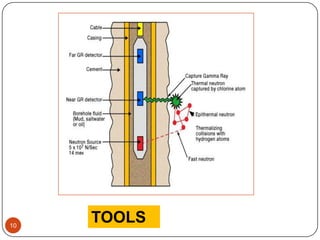
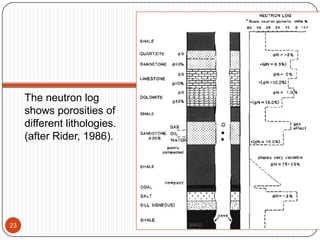
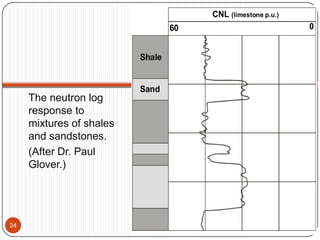
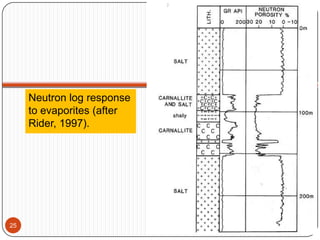
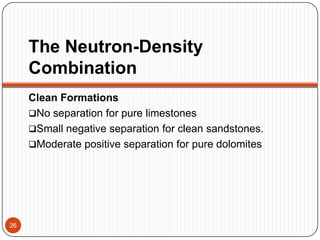
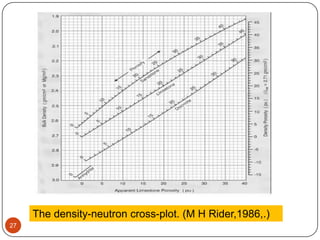
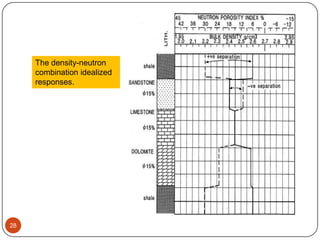
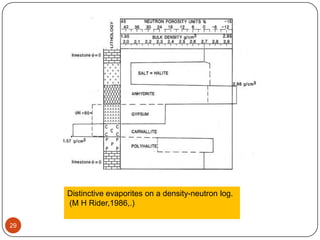
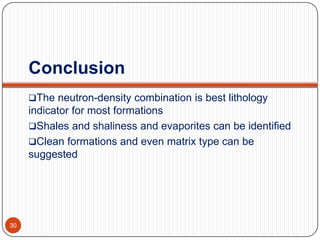

This presentation discusses neutron logs and their use in well log interpretation. Neutron logs measure the hydrogen index of formations using detectors that count slowed neutrons deflected back from hydrogen nuclei after being emitted from a radioactive source. They can be used both qualitatively to identify lithologies and quantitatively to calculate porosity. When combined with density logs on a cross-plot, the neutron-density combination is an effective tool for lithology indication and identifying clean formations, shales, and evaporites. Calibration is required using blocks of known porosity. Applications include porosity evaluation, identifying hydrocarbon gas effects, and accounting for shale effects.