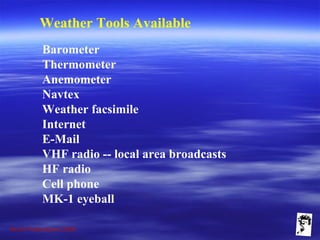
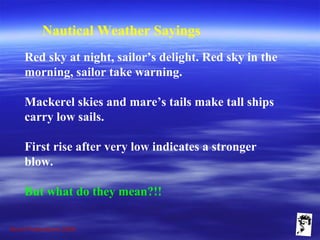
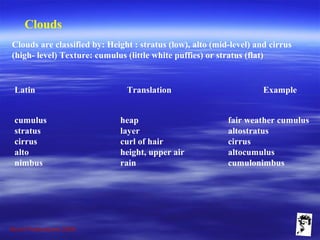
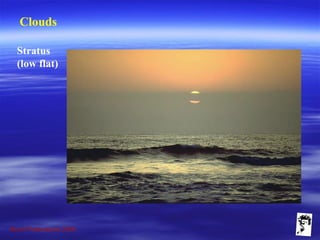
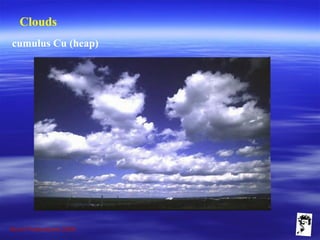
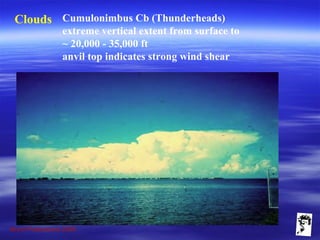
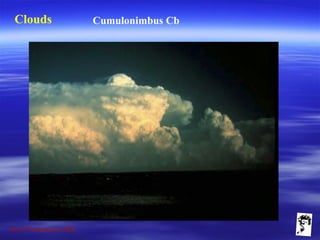
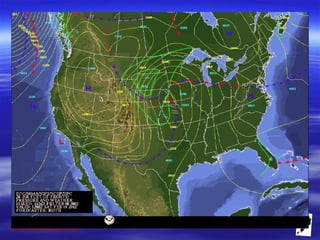
Grunt Productions 2009
Weather for the Mariner
A Brief By Lance GrindleyA Brief By Lance Grindley
Grunt Productions 2009
Weather Tools Available
Barometer
Thermometer
Anemometer
Navtex
Weather facsimile
Internet
E-Mail
VHF radio -- local area broadcasts
HF radio
Cell phone
MK-1 eyeball
Grunt Productions 2009
Nautical Weather Sayings
Red sky at night, sailor’s delight. Red sky in the
morning, sailor take warning.
Mackerel skies and mare’s tails make tall ships
carry low sails.
First rise after very low indicates a stronger
blow.
But what do they mean?!!
Grunt Productions 2009
Mariner’s Rules of Thumb
In the mid latitudes weather systems (pressure centers)
move from west to the east.
• Pressure Centers generally move in sequence with high
pressure replaced by low pressure and low pressure
replaced by high pressure
• Be aware that your boat is moving relative to moving weather
systems.
• Pay attention to changes in cloud formation and the direction
from which clouds approach.
• Clouds are the mariner’s best visual indicator of changing
weather.
• Pay attention to the direction of the true wind.
Grunt Productions 2009
Mariner’s Rules of Thumb
Observe the sea surface condition in relation to weather
conditions. Gradually increasing ripples on the water are
first indication of increasing wind.
– Long parallel streaks in the water where foam and
flotsam/jetsam line up (called Langmuir Circulation) runs
parallel with the wind and is a good indicator of true wind
direction.
– Generally, warm, moist air fuels low pressure. So warm
currents such as the Gulf Stream can cause dying low
pressure systems to redevelop and deepen.
– Low Pressure systems are associated with storms and
high pressure systems serve to block these storms.
Grunt Productions 2009
Mariner’s Rules of Thumb
Changes in air pressure, wind direction, humidity
and temperature are excellent indicators of
changing weather.
If thermometers indicate that temperature and dew
point differ by 5 degrees expect fog. If temperature
and dew point differ by 3 degrees or less expect
rain.
Use Buys Ballot’s law to locate general location of
high and low pressure centers
Grunt Productions 2009
Air Masses
Air masses are vast bodies of air with uniform
temperature and moisture
Air is modified based upon it’s source region or in
other words, where the air is modified
􀁺 Modified to be:
􀁺 Cold or warm
􀁺 Continental (dry air) or Maritime (moist air)
Grunt Productions 2009
Air Masses
The types of air masses are:
– Maritime polar cool and moist
– Arctic very cold and dry
– Continental polar cold and dry
– Continental tropical Hot and dry
– Equatorial/Maritime tropical
(always warm and moist)
Air Masses
Grunt Productions 2009
Air Pressure and Pressure
Trends
Barometers are instruments that measure
air pressure.
Barometric pressure is one of the best indicators
of impending weather
Barometric pressure should be logged every 4
hours along track
Grunt Productions 2009
Pressure is measured in
millibars mb (read from
inside dial used on weather
charts)
Inner scale on dial
reads millibars
Grunt Productions 2009
Air Pressure and Pressure
Trends
􀁺 Watching barometric pressure trends is one
of the best indicators of impending weather
􀁺 It is important to keep track of pressure
trends– use a 3 hour trend with a barometer
􀁺 Rapid pressure changes
Over 6 mb fall (or rise) in 3 hours
􀁺 Moderate pressure changes
3-6 mb fall (or rise) in 3 hours
􀁺 Slow pressure changes
3 mb fall (or rise) in 3 hours
Grunt Productions 2009
Pressure
Two types of air pressure:
􀁺 High pressure
Think of high pressure as a mound or hill of air
􀁺 Low pressure
Think of low pressure as a depression of air
Grunt Productions 2009
Low Pressure
Air rises at the centre of low pressure
Air circulates around low pressure centres counter clockwise and pulls the
surrounding air inward like a vacuum
Low pressure centres are the anchoring points for fronts.
950 mb is a very deep low pressure system (results in an intense storm)
988 mb is a moderately deep low pressure system
Associate low pressure with storms or deteriorating weather
Grunt Productions 2009
High Pressure
Air sinks at the centre of high pressure
Air circulates around high pressure centres clockwise and deflects
the air outward.
High pressure tends to block or deflect approaching bad weather
High pressure indicates fair and dry weather
1035 mb is a very strong high pressure centre
1012 is a moderately strong high pressure centre
Grunt Productions 2009
Wind and Pressure
Wind is the result of high and low pressure differences
and the atmosphere’s attempt to equalize the pressure
differences.
air will flow from high pressure (mound of air) in toward the low
pressure (depression of air)
Grunt Productions 2009
Wind and Pressure
The greater the pressure difference between high and low
pressure, the greater the wind speed
Wind direction is always indicated from the direction the
wind is blowing
􀁺 For example, NE wind blows from the NE
􀁺 A southerly wind blows from the south
Grunt Productions 2009
Wind and Pressure
Isobars on a weather chart are contours of pressure
around a high or low pressure centre
Isobars are indicated in millibars (mb)
barometric Pressure is lowest at the centre of a low
barometric Pressure is highest at the centre of a high
Tightly packed isobars on a weather chart
indicate a strong gradient or wind.
Grunt Productions 2009
Buys Ballot Law
Its important to know where the low pressure centre is
located.
This is thumb rule to use to locate the low pressure system
relative to your location.
􀁺 Stand with the wind at your back
􀁺 Turn 15 deg to your right
􀁺 Low pressure will be to your left and high pressure will be to your right
Grunt Productions 2009
Air Masses and Frontal Systems
When two different air masses collide, the boundary of
the collision
is called a front.
Four Types of fronts:
– Cold front
– Warm front
– Occluded front
– Stationary front
Grunt Productions 2009
Cold Front
Cold Air pushes underneath warm air and causes the air
to rise violently and rapidly
Cold fronts move fast 20- 35 kts
Generally move E-SE
Weather deteriorates rapidly
Approaching clouds seen 50 - 150 miles ahead of cold front
Grunt Productions 2009
Cold Front Weather
Heavy rain
Thunder and lightning
Tornados (not normally seen in UK)
Hail
Grunt Productions 2009
Cold Front Weather Sequence
Winds steady from SW
􀁺 Altocumulus (Ac) clouds (mid-
level puffy clouds) on W or NW
horizon
􀁺 Barometer pressure falls
􀁺 Clouds progressively lower and
thicken
􀁺 Cumulonimbus (Cb) clouds or
Thunderheads form
􀁺 Symbol to mark the boundary of
the front is a line with blue triangles
(cold air is behind the line)
Cold front symbol
Grunt Productions 2009
Cold Front Weather Sequence
Squalls: precede front by 5-6 hours
– Intense black clouds
– Violent gusty winds
– Cold blast of wind several miles ahead of front
Grunt Productions 2009
Cold Front Weather Sequence
As front passes, weather is as follows:
– Wind veers (moves clockwise) from SW to W-NW
– Barometer pressure at lowest
– Rain or squall
– Thunder and lightning
– Rapid clearing of sky
– Strong gusty winds from W-NW
– Air temperatures become colder
Grunt Productions 2009
Warm Front
Warm air slides over cold air
􀁺 Moves slowly 10-15kts
􀁺 Weather deteriorates
gradually
􀁺 Approaching clouds seen from
1000+ miles
􀁺 Symbol marking the front is a
line with red half circles (warm
air is behind the line)
Warm front symbol
Grunt Productions 2009
Warm Front Weather
Cirrus clouds (Ci) (high clouds) thicken to Cirrostratus
(Cs) then Altostratus (mid-level) clouds, then Ns (low
dark rain clouds)
Steady light rain
Persistent fog
Barometer pressure falls
Grunt Productions 2009
Warm Front Weather
Sequence
Front passes gradually, less intense than cold front
Wind veers (rotates clockwise) from S-SE to SW
Drizzle and fog may persist
Rain and thick clouds diminish
Air temperatures become warmer
Grunt Productions 2009
Occluded Front
Occurs when cold front
overtakes the warm front
􀁺 Weather is a combination of
cold steady, misty rain and
drizzle
􀁺 Notice the symbol to mark
the occluded front is a purple
combination of a cold and
warm front symbol
Occluded
Front
symbol
Grunt Productions 2009
Stationary Front
Occurs when the frontal
boundary either moves very
slowly or does not move
􀁺 Notice that the symbol
marking the stationary front is
alternating red half circle on the
warm air side and blue triangles
on the cold air side
Stationary front symbol
Grunt Productions 2009
Cape Hatteras
Conditions for the “Perfect Storm”?
Warm moist air from ocean currents will add fuel to
low pressure systems moving offshore.
Therefore, the warm sector of the Gulf Stream can
cause a dying low pressure system moving off coast
to redevelop.
Grunt Productions 2009
Nautical Weather Sayings (Again)
Red sky at night, sailor’s delight. Red sky in the morning,
sailor take warning.
Mackerel skies and mare’s tails make tall
ships carry low sails.
First rise after very low indicates a stronger
blow
Grunt Productions 2009
Clouds
To understand some of these nautical weather rhymes we
need to talk about clouds
Clouds are a mariner’s best visual indicator
of changing weather.
Grunt Productions 2009
Clouds
Clouds are classified by: Height : stratus (low), alto (mid-level) and cirrus
(high- level) Texture: cumulus (little white puffies) or stratus (flat)
Latin Translation Example
cumulus
stratus
cirrus
alto
nimbus
heap
layer
curl of hair
height, upper air
rain
fair weather cumulus
altostratus
cirrus
altocumulus
cumulonimbus
Grunt Productions 2009
Forecasting weather using clouds
If clouds appear high and then thicken
(cumuloform clouds) and lower, a cold front
is approaching.
If clouds appear high and then flatten out
and lower (strataform clouds), a warm front
is approaching
Grunt Productions 2009
Clouds
Cirrus Ci
(High - Mare’s Tails)
Grunt Productions 2009
Clouds
Altocumulus Ac
(mackerel skies)
Grunt Productions 2009
Clouds
Stratus
(low flat)
Grunt Productions 2009
Clouds
cumulus Cu (heap)
Grunt Productions 2009
Clouds Cumulonimbus Cb (Thunderheads)
extreme vertical extent from surface to
~ 20,000 - 35,000 ft
anvil top indicates strong wind shear
Grunt Productions 2009
Clouds Cumulonimbus Cb
Grunt Productions 2009
Clouds Fog
Fog is a stratus cloud 50 ft or less
from the ground
Grunt Productions 2009
Red Sky at Night Sailor’s Delight
As the sun sets and moves lower in the sky,
the colours observed are those in
the longer wavelengths
of the spectrum (orange and red). At night
the sun is in the western sky.
A red sky indicates clear weather in
west. Since weather generally moves
from west to east, a red sky indicates that the
west is clear and there are no approaching
weather making systems
Grunt Productions 2009
Red Sky in the Morning…Sailor Take Warning
In the morning, the sun rises
above the eastern horizon,
And the red colours observed
are those in the longer
wavelengths of the spectrum.
A red sky in the morning
therefore indicates clear weather
in the east. However, since
weather generally moves from
west to east, a red sky indicates
that the east is clear and
therefore deteriorating
weather is approaching from the
west
Grunt Productions 2009
Mackerel Skies and Mare’s Tails
Make Tall Ships Carry Low Sails
Mackerel Skies (Altocumulus or cirrocumulus Clouds) and
Mare’s Tails (Cirrus Clouds) indicate an approaching cold
front as warm air is rapidly pushed up in advance of the front.
Mare’s tails (Cirrus)
Mackerel Skies (altocumulus
or cirrocumulus)
Grunt Productions 2009
“First rise after a very low
indicates a stronger blow.”
• Refers to the rise in barometric pressure following a
period of low pressure.
• Wind is caused by the difference between high and
low pressure and the atmosphere’s attempt to equalize
the two.
• The greater the pressure differences, the stronger
the wind.
Grunt Productions 2009
Other Weather resources
Internet: weather charts obtained from
􀁺 internet prior to sailing
– www.metoffice.gov.uk
􀁺 Weather observations passed from other
boats
Grunt Productions 2009
VHF Radio
Local area broadcasts are messages provided by MCA
and provide
1. Current weather
2. Conditions and forecasts for specific areas.
Grunt Productions 2009
HF Radio
Voice Broadcasts are also located on HF frequencies (Check
ALRS for specific HF frequencies and times of broadcast)
Caution: Weather information is perishable
Information and local area broadcasts are good only for a
SPECIFIC area at a SPECIFIC time.
Grunt Productions 2009
Weather Charts via HF Facsimile
Weather Charts can be accessed via HF facsimile
• Various weather charts are disseminated on a set
schedule.
•ALRS provides the schedule and HF frequencies
via which these charts can be accessed.
• One can pre-program the Furuno Weather
Facsimile machine to automatically access the HF
signal at the time that these charts are broadcast.
Grunt Productions 2009
Weather Charts
Weather charts are 2 dimensional depictions
of the atmosphere which is 3 dimensional.
They are also snapshots in time.
At sea, weather charts are obtained by weather
facsimile.
Grunt Productions 2009
Weather Charts
Weather Charts can be divided into two types:
􀁺 Analysis Charts (charts that tell you what the
weather did)
􀁺 Prognostic (Forecasting) Charts (charts that
try to predict what the weather will do)
􀁺 When reading a weather chart it is important to first
check:
– Is it an analysis or prognostic chart?
– If it is an analysis chart, how old is the analysis?
– If it is a prognostic chart, when is the forecast valid?
Grunt Productions 2009
Weather Charts
When reading a weather chart it is also important to
determine if that analysis or prognostic chart gives you the
surface weather information or if it gives you the upper level
weather information
􀁺 For the mariner the surface analysis or the surface
prognostic chart provides the most useful
information
􀁺 For aviators, the upper level charts provide
additional useful information
Grunt Productions 2009
Weather Charts and Symbols
Surface weather charts will show cold, warm, occluded
and stationary frontal boundaries
Wind barbs, which indicate wind direction
and speed are also shown and look like
Wind barbs are located on surface analysis charts and give the
wind and weather conditions that occurred at various weather
stations
Grunt Productions 2009
Deciphering Wind Barbs
Wind barbs give information regarding
– Cloud cover
– Wind direction
– Wind speed
– Barometric pressure
– Air temperature
– Dew point
Grunt Productions 2009
Deciphering Wind Barbs
Wind direction and speed (each long barb 10 kts; short barb
5kts)
Wind is from NE in this example
Air temp Barometric pressure
Cloud Cover
Dew point
Cloud type
For Barometric Pressure:
0153 means 1015.3 mb
803 means 980.3 mb
(if 1st digit is 0 put a 1
before it)
(if 1st digit is 5,6,7, 8 or
9, put a 9 before it)
Grunt Productions 2009
Weather charts and wind
Some weather charts may not show wind barbs.
􀁺 Wind can also be determined by looking at
the isobars (the lines of constant pressure)
surrounding the low or high pressure
􀁺 The tighter the spacing between isobars, the stronger
the wind
􀁺 Around a low pressure centre, wind blows parallel, but slightly
crosses the isobars in toward low pressure
􀁺 Slightly inward and counter clockwise around a low
􀁺 Around a high pressure centre, wind blows parallel, but slightly
crosses the isobars outward from high pressure clockwise
􀁺 Slightly outward and clockwise around a high
Grunt Productions 2009
Wind Warnings
Gale Warnings: 34 - 47 kts
􀁺 A Gale Warning is issued to alert all mariners whenever
sustained winds of 34 to 47 knots, associated with a
nontropical system, are either ongoing or forecasted to
develop within the next 12 hours.
Grunt Productions 2009
Wind Warnings
Storm Warnings: 48 + kts.
• Sustained winds above 48 knots of nontropical (extratropical)
origin. Does not have closed cyclonic rotation.
Grunt Productions 2009
Hurricane Warnings
Definite Closed Cyclonic (CCW) Rotation
Winds in this range associated with a system developing from a
tropical depression would be covered under a Tropical Storm
Warning (34 to 63 knots). Differs from a midlatitudes or
extratropical storm in that it has a closed cyclonic (CCW)
rotation
Tropical Depression >34 kts
Tropical Storm Warning 34-63 kts
Hurricane Warnings: 64 + kts
Atlantic Hurricane season lasts from June- Nov
Grunt Productions 2009
Questions???

Weather for the mariner lrg

  • 1.
    Grunt Productions 2009 Weatherfor the Mariner A Brief By Lance GrindleyA Brief By Lance Grindley
  • 2.
    Grunt Productions 2009 WeatherTools Available Barometer Thermometer Anemometer Navtex Weather facsimile Internet E-Mail VHF radio -- local area broadcasts HF radio Cell phone MK-1 eyeball
  • 3.
    Grunt Productions 2009 NauticalWeather Sayings Red sky at night, sailor’s delight. Red sky in the morning, sailor take warning. Mackerel skies and mare’s tails make tall ships carry low sails. First rise after very low indicates a stronger blow. But what do they mean?!!
  • 4.
    Grunt Productions 2009 Mariner’sRules of Thumb In the mid latitudes weather systems (pressure centers) move from west to the east. • Pressure Centers generally move in sequence with high pressure replaced by low pressure and low pressure replaced by high pressure • Be aware that your boat is moving relative to moving weather systems. • Pay attention to changes in cloud formation and the direction from which clouds approach. • Clouds are the mariner’s best visual indicator of changing weather. • Pay attention to the direction of the true wind.
  • 5.
    Grunt Productions 2009 Mariner’sRules of Thumb Observe the sea surface condition in relation to weather conditions. Gradually increasing ripples on the water are first indication of increasing wind. – Long parallel streaks in the water where foam and flotsam/jetsam line up (called Langmuir Circulation) runs parallel with the wind and is a good indicator of true wind direction. – Generally, warm, moist air fuels low pressure. So warm currents such as the Gulf Stream can cause dying low pressure systems to redevelop and deepen. – Low Pressure systems are associated with storms and high pressure systems serve to block these storms.
  • 6.
    Grunt Productions 2009 Mariner’sRules of Thumb Changes in air pressure, wind direction, humidity and temperature are excellent indicators of changing weather. If thermometers indicate that temperature and dew point differ by 5 degrees expect fog. If temperature and dew point differ by 3 degrees or less expect rain. Use Buys Ballot’s law to locate general location of high and low pressure centers
  • 7.
    Grunt Productions 2009 AirMasses Air masses are vast bodies of air with uniform temperature and moisture Air is modified based upon it’s source region or in other words, where the air is modified 􀁺 Modified to be: 􀁺 Cold or warm 􀁺 Continental (dry air) or Maritime (moist air)
  • 8.
    Grunt Productions 2009 AirMasses The types of air masses are: – Maritime polar cool and moist – Arctic very cold and dry – Continental polar cold and dry – Continental tropical Hot and dry – Equatorial/Maritime tropical (always warm and moist) Air Masses
  • 9.
    Grunt Productions 2009 AirPressure and Pressure Trends Barometers are instruments that measure air pressure. Barometric pressure is one of the best indicators of impending weather Barometric pressure should be logged every 4 hours along track
  • 10.
    Grunt Productions 2009 Pressureis measured in millibars mb (read from inside dial used on weather charts) Inner scale on dial reads millibars
  • 11.
    Grunt Productions 2009 AirPressure and Pressure Trends 􀁺 Watching barometric pressure trends is one of the best indicators of impending weather 􀁺 It is important to keep track of pressure trends– use a 3 hour trend with a barometer 􀁺 Rapid pressure changes Over 6 mb fall (or rise) in 3 hours 􀁺 Moderate pressure changes 3-6 mb fall (or rise) in 3 hours 􀁺 Slow pressure changes 3 mb fall (or rise) in 3 hours
  • 12.
    Grunt Productions 2009 Pressure Twotypes of air pressure: 􀁺 High pressure Think of high pressure as a mound or hill of air 􀁺 Low pressure Think of low pressure as a depression of air
  • 13.
    Grunt Productions 2009 LowPressure Air rises at the centre of low pressure Air circulates around low pressure centres counter clockwise and pulls the surrounding air inward like a vacuum Low pressure centres are the anchoring points for fronts. 950 mb is a very deep low pressure system (results in an intense storm) 988 mb is a moderately deep low pressure system Associate low pressure with storms or deteriorating weather
  • 14.
    Grunt Productions 2009 HighPressure Air sinks at the centre of high pressure Air circulates around high pressure centres clockwise and deflects the air outward. High pressure tends to block or deflect approaching bad weather High pressure indicates fair and dry weather 1035 mb is a very strong high pressure centre 1012 is a moderately strong high pressure centre
  • 15.
    Grunt Productions 2009 Windand Pressure Wind is the result of high and low pressure differences and the atmosphere’s attempt to equalize the pressure differences. air will flow from high pressure (mound of air) in toward the low pressure (depression of air)
  • 16.
    Grunt Productions 2009 Windand Pressure The greater the pressure difference between high and low pressure, the greater the wind speed Wind direction is always indicated from the direction the wind is blowing 􀁺 For example, NE wind blows from the NE 􀁺 A southerly wind blows from the south
  • 17.
    Grunt Productions 2009 Windand Pressure Isobars on a weather chart are contours of pressure around a high or low pressure centre Isobars are indicated in millibars (mb) barometric Pressure is lowest at the centre of a low barometric Pressure is highest at the centre of a high Tightly packed isobars on a weather chart indicate a strong gradient or wind.
  • 18.
    Grunt Productions 2009 BuysBallot Law Its important to know where the low pressure centre is located. This is thumb rule to use to locate the low pressure system relative to your location. 􀁺 Stand with the wind at your back 􀁺 Turn 15 deg to your right 􀁺 Low pressure will be to your left and high pressure will be to your right
  • 19.
    Grunt Productions 2009 AirMasses and Frontal Systems When two different air masses collide, the boundary of the collision is called a front. Four Types of fronts: – Cold front – Warm front – Occluded front – Stationary front
  • 20.
    Grunt Productions 2009 ColdFront Cold Air pushes underneath warm air and causes the air to rise violently and rapidly Cold fronts move fast 20- 35 kts Generally move E-SE Weather deteriorates rapidly Approaching clouds seen 50 - 150 miles ahead of cold front
  • 21.
    Grunt Productions 2009 ColdFront Weather Heavy rain Thunder and lightning Tornados (not normally seen in UK) Hail
  • 22.
    Grunt Productions 2009 ColdFront Weather Sequence Winds steady from SW 􀁺 Altocumulus (Ac) clouds (mid- level puffy clouds) on W or NW horizon 􀁺 Barometer pressure falls 􀁺 Clouds progressively lower and thicken 􀁺 Cumulonimbus (Cb) clouds or Thunderheads form 􀁺 Symbol to mark the boundary of the front is a line with blue triangles (cold air is behind the line) Cold front symbol
  • 23.
  • 24.
    Grunt Productions 2009 ColdFront Weather Sequence Squalls: precede front by 5-6 hours – Intense black clouds – Violent gusty winds – Cold blast of wind several miles ahead of front
  • 25.
    Grunt Productions 2009 ColdFront Weather Sequence As front passes, weather is as follows: – Wind veers (moves clockwise) from SW to W-NW – Barometer pressure at lowest – Rain or squall – Thunder and lightning – Rapid clearing of sky – Strong gusty winds from W-NW – Air temperatures become colder
  • 26.
    Grunt Productions 2009 WarmFront Warm air slides over cold air 􀁺 Moves slowly 10-15kts 􀁺 Weather deteriorates gradually 􀁺 Approaching clouds seen from 1000+ miles 􀁺 Symbol marking the front is a line with red half circles (warm air is behind the line) Warm front symbol
  • 27.
    Grunt Productions 2009 WarmFront Weather Cirrus clouds (Ci) (high clouds) thicken to Cirrostratus (Cs) then Altostratus (mid-level) clouds, then Ns (low dark rain clouds) Steady light rain Persistent fog Barometer pressure falls
  • 28.
    Grunt Productions 2009 WarmFront Weather Sequence Front passes gradually, less intense than cold front Wind veers (rotates clockwise) from S-SE to SW Drizzle and fog may persist Rain and thick clouds diminish Air temperatures become warmer
  • 29.
  • 30.
    Grunt Productions 2009 OccludedFront Occurs when cold front overtakes the warm front 􀁺 Weather is a combination of cold steady, misty rain and drizzle 􀁺 Notice the symbol to mark the occluded front is a purple combination of a cold and warm front symbol Occluded Front symbol
  • 31.
    Grunt Productions 2009 StationaryFront Occurs when the frontal boundary either moves very slowly or does not move 􀁺 Notice that the symbol marking the stationary front is alternating red half circle on the warm air side and blue triangles on the cold air side Stationary front symbol
  • 32.
  • 33.
    Grunt Productions 2009 CapeHatteras Conditions for the “Perfect Storm”? Warm moist air from ocean currents will add fuel to low pressure systems moving offshore. Therefore, the warm sector of the Gulf Stream can cause a dying low pressure system moving off coast to redevelop.
  • 34.
    Grunt Productions 2009 NauticalWeather Sayings (Again) Red sky at night, sailor’s delight. Red sky in the morning, sailor take warning. Mackerel skies and mare’s tails make tall ships carry low sails. First rise after very low indicates a stronger blow
  • 35.
    Grunt Productions 2009 Clouds Tounderstand some of these nautical weather rhymes we need to talk about clouds Clouds are a mariner’s best visual indicator of changing weather.
  • 36.
    Grunt Productions 2009 Clouds Cloudsare classified by: Height : stratus (low), alto (mid-level) and cirrus (high- level) Texture: cumulus (little white puffies) or stratus (flat) Latin Translation Example cumulus stratus cirrus alto nimbus heap layer curl of hair height, upper air rain fair weather cumulus altostratus cirrus altocumulus cumulonimbus
  • 37.
    Grunt Productions 2009 Forecastingweather using clouds If clouds appear high and then thicken (cumuloform clouds) and lower, a cold front is approaching. If clouds appear high and then flatten out and lower (strataform clouds), a warm front is approaching
  • 38.
    Grunt Productions 2009 Clouds CirrusCi (High - Mare’s Tails)
  • 39.
  • 40.
  • 41.
  • 42.
    Grunt Productions 2009 CloudsCumulonimbus Cb (Thunderheads) extreme vertical extent from surface to ~ 20,000 - 35,000 ft anvil top indicates strong wind shear
  • 43.
  • 44.
    Grunt Productions 2009 CloudsFog Fog is a stratus cloud 50 ft or less from the ground
  • 45.
    Grunt Productions 2009 RedSky at Night Sailor’s Delight As the sun sets and moves lower in the sky, the colours observed are those in the longer wavelengths of the spectrum (orange and red). At night the sun is in the western sky. A red sky indicates clear weather in west. Since weather generally moves from west to east, a red sky indicates that the west is clear and there are no approaching weather making systems
  • 46.
    Grunt Productions 2009 RedSky in the Morning…Sailor Take Warning In the morning, the sun rises above the eastern horizon, And the red colours observed are those in the longer wavelengths of the spectrum. A red sky in the morning therefore indicates clear weather in the east. However, since weather generally moves from west to east, a red sky indicates that the east is clear and therefore deteriorating weather is approaching from the west
  • 47.
    Grunt Productions 2009 MackerelSkies and Mare’s Tails Make Tall Ships Carry Low Sails Mackerel Skies (Altocumulus or cirrocumulus Clouds) and Mare’s Tails (Cirrus Clouds) indicate an approaching cold front as warm air is rapidly pushed up in advance of the front. Mare’s tails (Cirrus) Mackerel Skies (altocumulus or cirrocumulus)
  • 48.
    Grunt Productions 2009 “Firstrise after a very low indicates a stronger blow.” • Refers to the rise in barometric pressure following a period of low pressure. • Wind is caused by the difference between high and low pressure and the atmosphere’s attempt to equalize the two. • The greater the pressure differences, the stronger the wind.
  • 49.
    Grunt Productions 2009 OtherWeather resources Internet: weather charts obtained from 􀁺 internet prior to sailing – www.metoffice.gov.uk 􀁺 Weather observations passed from other boats
  • 50.
    Grunt Productions 2009 VHFRadio Local area broadcasts are messages provided by MCA and provide 1. Current weather 2. Conditions and forecasts for specific areas.
  • 51.
    Grunt Productions 2009 HFRadio Voice Broadcasts are also located on HF frequencies (Check ALRS for specific HF frequencies and times of broadcast) Caution: Weather information is perishable Information and local area broadcasts are good only for a SPECIFIC area at a SPECIFIC time.
  • 52.
    Grunt Productions 2009 WeatherCharts via HF Facsimile Weather Charts can be accessed via HF facsimile • Various weather charts are disseminated on a set schedule. •ALRS provides the schedule and HF frequencies via which these charts can be accessed. • One can pre-program the Furuno Weather Facsimile machine to automatically access the HF signal at the time that these charts are broadcast.
  • 53.
    Grunt Productions 2009 WeatherCharts Weather charts are 2 dimensional depictions of the atmosphere which is 3 dimensional. They are also snapshots in time. At sea, weather charts are obtained by weather facsimile.
  • 54.
    Grunt Productions 2009 WeatherCharts Weather Charts can be divided into two types: 􀁺 Analysis Charts (charts that tell you what the weather did) 􀁺 Prognostic (Forecasting) Charts (charts that try to predict what the weather will do) 􀁺 When reading a weather chart it is important to first check: – Is it an analysis or prognostic chart? – If it is an analysis chart, how old is the analysis? – If it is a prognostic chart, when is the forecast valid?
  • 55.
  • 56.
  • 57.
    Grunt Productions 2009 WeatherCharts When reading a weather chart it is also important to determine if that analysis or prognostic chart gives you the surface weather information or if it gives you the upper level weather information 􀁺 For the mariner the surface analysis or the surface prognostic chart provides the most useful information 􀁺 For aviators, the upper level charts provide additional useful information
  • 58.
    Grunt Productions 2009 WeatherCharts and Symbols Surface weather charts will show cold, warm, occluded and stationary frontal boundaries Wind barbs, which indicate wind direction and speed are also shown and look like Wind barbs are located on surface analysis charts and give the wind and weather conditions that occurred at various weather stations
  • 59.
    Grunt Productions 2009 DecipheringWind Barbs Wind barbs give information regarding – Cloud cover – Wind direction – Wind speed – Barometric pressure – Air temperature – Dew point
  • 60.
    Grunt Productions 2009 DecipheringWind Barbs Wind direction and speed (each long barb 10 kts; short barb 5kts) Wind is from NE in this example Air temp Barometric pressure Cloud Cover Dew point Cloud type For Barometric Pressure: 0153 means 1015.3 mb 803 means 980.3 mb (if 1st digit is 0 put a 1 before it) (if 1st digit is 5,6,7, 8 or 9, put a 9 before it)
  • 61.
    Grunt Productions 2009 Weathercharts and wind Some weather charts may not show wind barbs. 􀁺 Wind can also be determined by looking at the isobars (the lines of constant pressure) surrounding the low or high pressure 􀁺 The tighter the spacing between isobars, the stronger the wind 􀁺 Around a low pressure centre, wind blows parallel, but slightly crosses the isobars in toward low pressure 􀁺 Slightly inward and counter clockwise around a low 􀁺 Around a high pressure centre, wind blows parallel, but slightly crosses the isobars outward from high pressure clockwise 􀁺 Slightly outward and clockwise around a high
  • 62.
    Grunt Productions 2009 WindWarnings Gale Warnings: 34 - 47 kts 􀁺 A Gale Warning is issued to alert all mariners whenever sustained winds of 34 to 47 knots, associated with a nontropical system, are either ongoing or forecasted to develop within the next 12 hours.
  • 63.
    Grunt Productions 2009 WindWarnings Storm Warnings: 48 + kts. • Sustained winds above 48 knots of nontropical (extratropical) origin. Does not have closed cyclonic rotation.
  • 64.
    Grunt Productions 2009 HurricaneWarnings Definite Closed Cyclonic (CCW) Rotation Winds in this range associated with a system developing from a tropical depression would be covered under a Tropical Storm Warning (34 to 63 knots). Differs from a midlatitudes or extratropical storm in that it has a closed cyclonic (CCW) rotation Tropical Depression >34 kts Tropical Storm Warning 34-63 kts Hurricane Warnings: 64 + kts Atlantic Hurricane season lasts from June- Nov
  • 65.