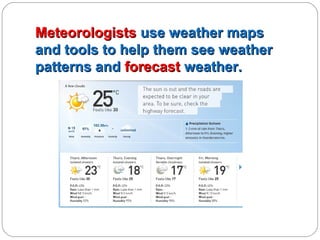
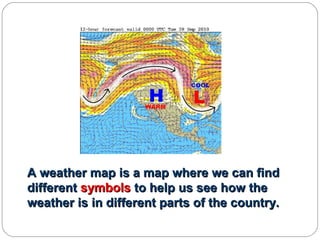
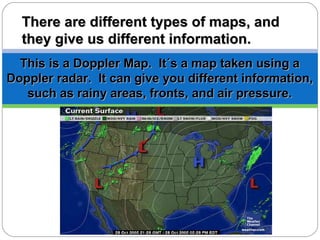
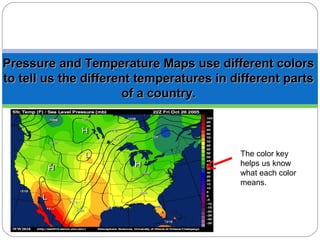
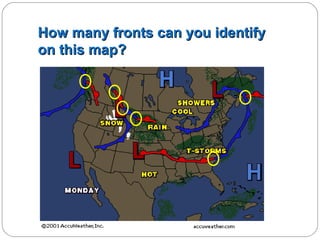
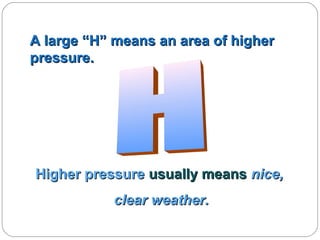
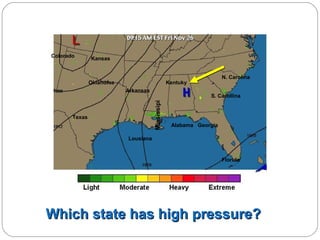
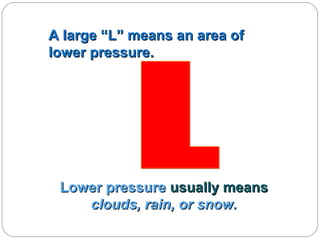
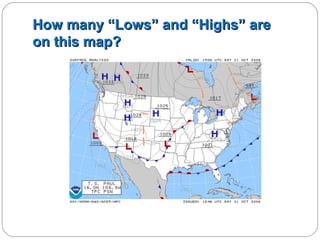
Weather Maps and
Symbols
Meteorologists use weather maps
and tools to help them see weather
patterns and forecast weather.
A weather map is a map where we can find
different symbols to help us see how the
weather is in different parts of the country.
There are different types of maps, and
they give us different information.
This is a Doppler Map. It´s a map taken using a
Doppler radar. It can give you different information,
such as rainy areas, fronts, and air pressure.
Pressure and Temperature Maps use different colors
to tell us the different temperatures in different parts
of a country.

The color key
helps us know
what each color
means.
A Cold Front symbol shows the edge
of a mass of cool air.
A Warm Front symbol shows the
edge of a warmer air mass.
A Stationary Front means neither the
warm air or the cool air are moving
very much.
How many fronts can you identify
on this map?
A large “H” means an area of higher
pressure.

Higher pressure usually means nice,
clear weather.
Colorado

Kansas

Oklahoma

N. Carolina

Kentuky
Arkansas

Mississipi

S. Carollina

Texas

Alabama Georgia

Lousiana

Florida

Which state has high pressure?
A large “L” means an area of
lower pressure.

Lower pressure usually means
clouds, rain, or snow.
How many “Lows” and “Highs” are
on this map?

Weather Maps and Symbols