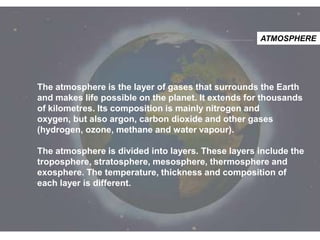
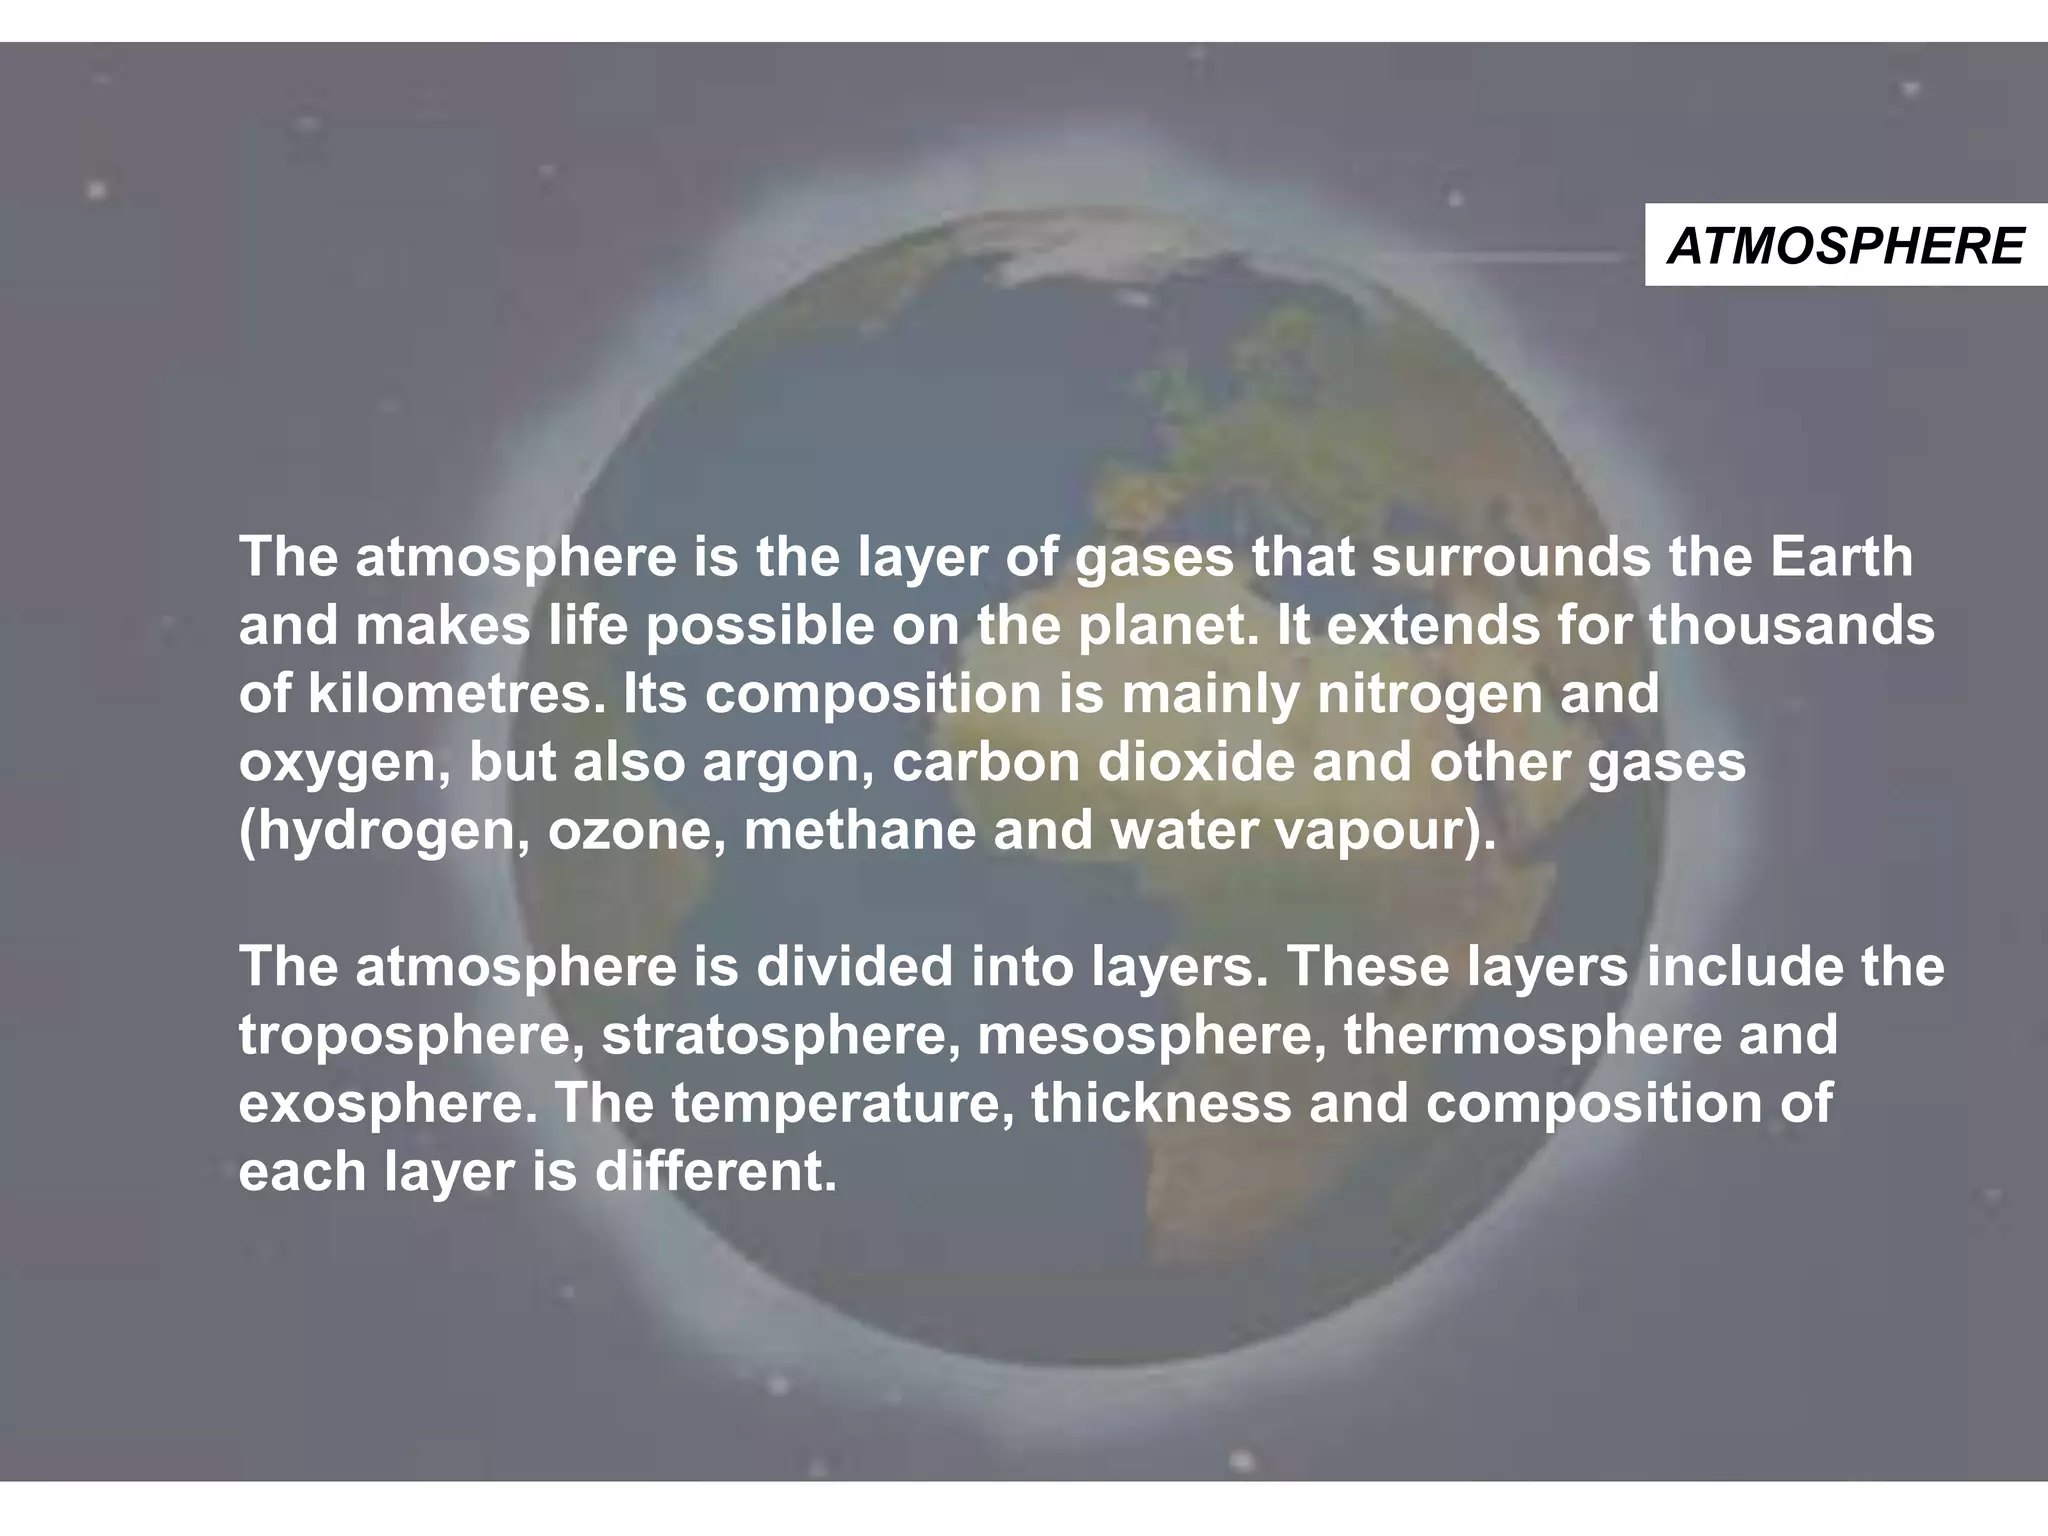
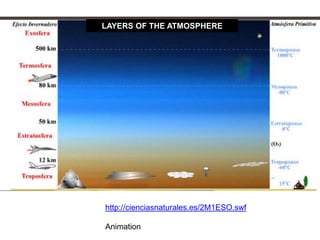
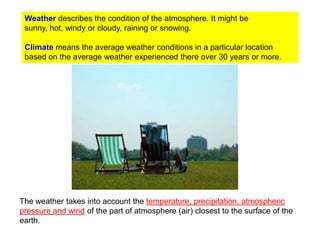
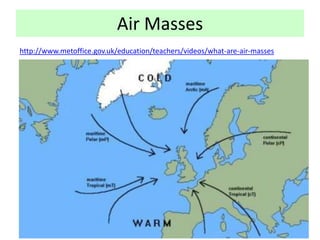
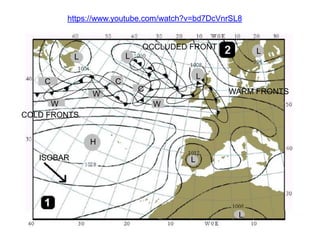
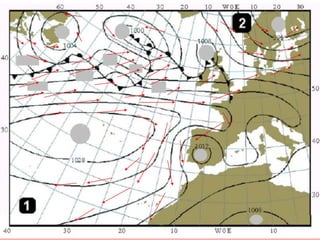
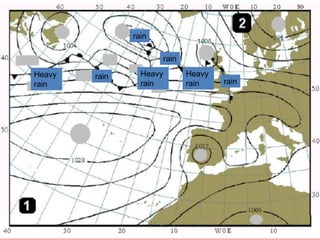
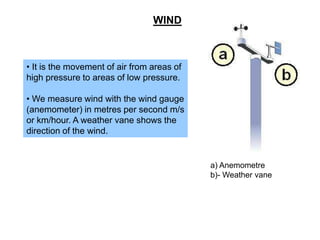
The atmosphere can be summarized as follows:
1) The atmosphere is the layer of gases surrounding the Earth that makes life possible. It is mainly composed of nitrogen and oxygen and extends thousands of kilometers above the Earth's surface.
2) The atmosphere is divided into layers with different temperatures, thicknesses, and compositions including the troposphere, stratosphere, mesosphere, thermosphere, and exosphere.
3) Key components of the atmosphere include temperature, air pressure, precipitation, and wind, which are all influenced by global and local geographic factors and help determine the weather and climate of different regions.
CAMBRIDGE AS GEOGRAPHY REVISION: ATMOSPHERE AND WEATHER - 2.3 WEATHER PROCESS...George Dumitrache
A comprehensive presentation of subchapter 2.3 Weather Processes and Phenomena, from the second chapter of Physical Geography, AS Cambridge, Atmosphere and Weather.
A presentation on Weather and Climate made by Deepak Rajput. It was presented as a seminar requirement at the University of Tennessee Space Institute in Spring 2008.
This document looks at the factors that affect weather and climate. The weather systems that also affect the Caribbean is also examined. These include ITCZ, Hurricanes, Cold Fronts, Easterly waves, Anticyclones
Slack (or Teams) Automation for Bonterra Impact Management (fka Social Soluti...Jeffrey Haguewood
Sidekick Solutions uses Bonterra Impact Management (fka Social Solutions Apricot) and automation solutions to integrate data for business workflows.
We believe integration and automation are essential to user experience and the promise of efficient work through technology. Automation is the critical ingredient to realizing that full vision. We develop integration products and services for Bonterra Case Management software to support the deployment of automations for a variety of use cases.
This video focuses on the notifications, alerts, and approval requests using Slack for Bonterra Impact Management. The solutions covered in this webinar can also be deployed for Microsoft Teams.
Interested in deploying notification automations for Bonterra Impact Management? Contact us at sales@sidekicksolutionsllc.com to discuss next steps.
LF Energy Webinar: Electrical Grid Modelling and Simulation Through PowSyBl -...DanBrown980551
Do you want to learn how to model and simulate an electrical network from scratch in under an hour?
Then welcome to this PowSyBl workshop, hosted by Rte, the French Transmission System Operator (TSO)!
During the webinar, you will discover the PowSyBl ecosystem as well as handle and study an electrical network through an interactive Python notebook.
PowSyBl is an open source project hosted by LF Energy, which offers a comprehensive set of features for electrical grid modelling and simulation. Among other advanced features, PowSyBl provides:
- A fully editable and extendable library for grid component modelling;
- Visualization tools to display your network;
- Grid simulation tools, such as power flows, security analyses (with or without remedial actions) and sensitivity analyses;
The framework is mostly written in Java, with a Python binding so that Python developers can access PowSyBl functionalities as well.
What you will learn during the webinar:
- For beginners: discover PowSyBl's functionalities through a quick general presentation and the notebook, without needing any expert coding skills;
- For advanced developers: master the skills to efficiently apply PowSyBl functionalities to your real-world scenarios.
State of ICS and IoT Cyber Threat Landscape Report 2024 previewPrayukth K V
The IoT and OT threat landscape report has been prepared by the Threat Research Team at Sectrio using data from Sectrio, cyber threat intelligence farming facilities spread across over 85 cities around the world. In addition, Sectrio also runs AI-based advanced threat and payload engagement facilities that serve as sinks to attract and engage sophisticated threat actors, and newer malware including new variants and latent threats that are at an earlier stage of development.
The latest edition of the OT/ICS and IoT security Threat Landscape Report 2024 also covers:
State of global ICS asset and network exposure
Sectoral targets and attacks as well as the cost of ransom
Global APT activity, AI usage, actor and tactic profiles, and implications
Rise in volumes of AI-powered cyberattacks
Major cyber events in 2024
Malware and malicious payload trends
Cyberattack types and targets
Vulnerability exploit attempts on CVEs
Attacks on counties – USA
Expansion of bot farms – how, where, and why
In-depth analysis of the cyber threat landscape across North America, South America, Europe, APAC, and the Middle East
Why are attacks on smart factories rising?
Cyber risk predictions
Axis of attacks – Europe
Systemic attacks in the Middle East
Download the full report from here:
https://sectrio.com/resources/ot-threat-landscape-reports/sectrio-releases-ot-ics-and-iot-security-threat-landscape-report-2024/
GDG Cloud Southlake #33: Boule & Rebala: Effective AppSec in SDLC using Deplo...James Anderson
Effective Application Security in Software Delivery lifecycle using Deployment Firewall and DBOM
The modern software delivery process (or the CI/CD process) includes many tools, distributed teams, open-source code, and cloud platforms. Constant focus on speed to release software to market, along with the traditional slow and manual security checks has caused gaps in continuous security as an important piece in the software supply chain. Today organizations feel more susceptible to external and internal cyber threats due to the vast attack surface in their applications supply chain and the lack of end-to-end governance and risk management.
The software team must secure its software delivery process to avoid vulnerability and security breaches. This needs to be achieved with existing tool chains and without extensive rework of the delivery processes. This talk will present strategies and techniques for providing visibility into the true risk of the existing vulnerabilities, preventing the introduction of security issues in the software, resolving vulnerabilities in production environments quickly, and capturing the deployment bill of materials (DBOM).
Speakers:
Bob Boule
Robert Boule is a technology enthusiast with PASSION for technology and making things work along with a knack for helping others understand how things work. He comes with around 20 years of solution engineering experience in application security, software continuous delivery, and SaaS platforms. He is known for his dynamic presentations in CI/CD and application security integrated in software delivery lifecycle.
Gopinath Rebala
Gopinath Rebala is the CTO of OpsMx, where he has overall responsibility for the machine learning and data processing architectures for Secure Software Delivery. Gopi also has a strong connection with our customers, leading design and architecture for strategic implementations. Gopi is a frequent speaker and well-known leader in continuous delivery and integrating security into software delivery.
Search and Society: Reimagining Information Access for Radical FuturesBhaskar Mitra
The field of Information retrieval (IR) is currently undergoing a transformative shift, at least partly due to the emerging applications of generative AI to information access. In this talk, we will deliberate on the sociotechnical implications of generative AI for information access. We will argue that there is both a critical necessity and an exciting opportunity for the IR community to re-center our research agendas on societal needs while dismantling the artificial separation between the work on fairness, accountability, transparency, and ethics in IR and the rest of IR research. Instead of adopting a reactionary strategy of trying to mitigate potential social harms from emerging technologies, the community should aim to proactively set the research agenda for the kinds of systems we should build inspired by diverse explicitly stated sociotechnical imaginaries. The sociotechnical imaginaries that underpin the design and development of information access technologies needs to be explicitly articulated, and we need to develop theories of change in context of these diverse perspectives. Our guiding future imaginaries must be informed by other academic fields, such as democratic theory and critical theory, and should be co-developed with social science scholars, legal scholars, civil rights and social justice activists, and artists, among others.
Connector Corner: Automate dynamic content and events by pushing a buttonDianaGray10
Here is something new! In our next Connector Corner webinar, we will demonstrate how you can use a single workflow to:
Create a campaign using Mailchimp with merge tags/fields
Send an interactive Slack channel message (using buttons)
Have the message received by managers and peers along with a test email for review
But there’s more:
In a second workflow supporting the same use case, you’ll see:
Your campaign sent to target colleagues for approval
If the “Approve” button is clicked, a Jira/Zendesk ticket is created for the marketing design team
But—if the “Reject” button is pushed, colleagues will be alerted via Slack message
Join us to learn more about this new, human-in-the-loop capability, brought to you by Integration Service connectors.
And...
Speakers:
Akshay Agnihotri, Product Manager
Charlie Greenberg, Host
JMeter webinar - integration with InfluxDB and GrafanaRTTS
Watch this recorded webinar about real-time monitoring of application performance. See how to integrate Apache JMeter, the open-source leader in performance testing, with InfluxDB, the open-source time-series database, and Grafana, the open-source analytics and visualization application.
In this webinar, we will review the benefits of leveraging InfluxDB and Grafana when executing load tests and demonstrate how these tools are used to visualize performance metrics.
Length: 30 minutes
Session Overview
-------------------------------------------
During this webinar, we will cover the following topics while demonstrating the integrations of JMeter, InfluxDB and Grafana:
- What out-of-the-box solutions are available for real-time monitoring JMeter tests?
- What are the benefits of integrating InfluxDB and Grafana into the load testing stack?
- Which features are provided by Grafana?
- Demonstration of InfluxDB and Grafana using a practice web application
To view the webinar recording, go to:
https://www.rttsweb.com/jmeter-integration-webinar
Software Delivery At the Speed of AI: Inflectra Invests In AI-Powered QualityInflectra
In this insightful webinar, Inflectra explores how artificial intelligence (AI) is transforming software development and testing. Discover how AI-powered tools are revolutionizing every stage of the software development lifecycle (SDLC), from design and prototyping to testing, deployment, and monitoring.
Learn about:
• The Future of Testing: How AI is shifting testing towards verification, analysis, and higher-level skills, while reducing repetitive tasks.
• Test Automation: How AI-powered test case generation, optimization, and self-healing tests are making testing more efficient and effective.
• Visual Testing: Explore the emerging capabilities of AI in visual testing and how it's set to revolutionize UI verification.
• Inflectra's AI Solutions: See demonstrations of Inflectra's cutting-edge AI tools like the ChatGPT plugin and Azure Open AI platform, designed to streamline your testing process.
Whether you're a developer, tester, or QA professional, this webinar will give you valuable insights into how AI is shaping the future of software delivery.
DevOps and Testing slides at DASA ConnectKari Kakkonen
My and Rik Marselis slides at 30.5.2024 DASA Connect conference. We discuss about what is testing, then what is agile testing and finally what is Testing in DevOps. Finally we had lovely workshop with the participants trying to find out different ways to think about quality and testing in different parts of the DevOps infinity loop.
"Impact of front-end architecture on development cost", Viktor TurskyiFwdays
I have heard many times that architecture is not important for the front-end. Also, many times I have seen how developers implement features on the front-end just following the standard rules for a framework and think that this is enough to successfully launch the project, and then the project fails. How to prevent this and what approach to choose? I have launched dozens of complex projects and during the talk we will analyze which approaches have worked for me and which have not.
PHP Frameworks: I want to break free (IPC Berlin 2024)Ralf Eggert
In this presentation, we examine the challenges and limitations of relying too heavily on PHP frameworks in web development. We discuss the history of PHP and its frameworks to understand how this dependence has evolved. The focus will be on providing concrete tips and strategies to reduce reliance on these frameworks, based on real-world examples and practical considerations. The goal is to equip developers with the skills and knowledge to create more flexible and future-proof web applications. We'll explore the importance of maintaining autonomy in a rapidly changing tech landscape and how to make informed decisions in PHP development.
This talk is aimed at encouraging a more independent approach to using PHP frameworks, moving towards a more flexible and future-proof approach to PHP development.
Essentials of Automations: Optimizing FME Workflows with ParametersSafe Software
Are you looking to streamline your workflows and boost your projects’ efficiency? Do you find yourself searching for ways to add flexibility and control over your FME workflows? If so, you’re in the right place.
Join us for an insightful dive into the world of FME parameters, a critical element in optimizing workflow efficiency. This webinar marks the beginning of our three-part “Essentials of Automation” series. This first webinar is designed to equip you with the knowledge and skills to utilize parameters effectively: enhancing the flexibility, maintainability, and user control of your FME projects.
Here’s what you’ll gain:
- Essentials of FME Parameters: Understand the pivotal role of parameters, including Reader/Writer, Transformer, User, and FME Flow categories. Discover how they are the key to unlocking automation and optimization within your workflows.
- Practical Applications in FME Form: Delve into key user parameter types including choice, connections, and file URLs. Allow users to control how a workflow runs, making your workflows more reusable. Learn to import values and deliver the best user experience for your workflows while enhancing accuracy.
- Optimization Strategies in FME Flow: Explore the creation and strategic deployment of parameters in FME Flow, including the use of deployment and geometry parameters, to maximize workflow efficiency.
- Pro Tips for Success: Gain insights on parameterizing connections and leveraging new features like Conditional Visibility for clarity and simplicity.
We’ll wrap up with a glimpse into future webinars, followed by a Q&A session to address your specific questions surrounding this topic.
Don’t miss this opportunity to elevate your FME expertise and drive your projects to new heights of efficiency.
Essentials of Automations: Optimizing FME Workflows with Parameters
Weather and climate
1. ATMOSPHERE
The atmosphere is the layer of gases that surrounds the Earth
and makes life possible on the planet. It extends for thousands
of kilometres. Its composition is mainly nitrogen and
oxygen, but also argon, carbon dioxide and other gases
(hydrogen, ozone, methane and water vapour).
The atmosphere is divided into layers. These layers include the
troposphere, stratosphere, mesosphere, thermosphere and
exosphere. The temperature, thickness and composition of
each layer is different.
2. LAYERS OF THE ATMOSPHERE
http://cienciasnaturales.es/2M1ESO.swf
Animation
3. Weather describes the condition of the atmosphere. It might be
sunny, hot, windy or cloudy, raining or snowing.
Climate means the average weather conditions in a particular location
based on the average weather experienced there over 30 years or more.
The weather takes into account the temperature, precipitation, atmospheric
pressure and wind of the part of atmosphere (air) closest to the surface of the
earth.
4. TEMPERATURE
• It is the amount of heat in the atmosphere
• We measure it with the thermometer.
• It is expressed in degrees centigrade.
THERMOMETER
Fuente: Banco de imágenes del
CNICE
5.
6. Factors affecting temperature are:
Latitude or distance from the equator
Latitude is the main factor affecting global
climate - the further you go from the
equator, the cooler it gets. This is because the
earth in curved which means that the sun's
energy is more concentrated at the equator.
This, and the thinner atmosphere at the
equator, means that the earth gets hotter
here.
Altitude or height above sea level
Temperatures decrease by 0,6 degrees
celsius for every 100 metres increase in
altitude. Mountainous areas are therefore
cooler.
7. Distance from the sea
Oceans heat up and cool down much more slowly
than land. This means that coastal locations tend
to be cooler in summer and warmer in winter than
places inland at the same latitude and altitude.
Glasgow, for example, is at a similar latitude to
Moscow, but is much milder in winter because it is
nearer to the coast than Moscow.
Prevailing winds and ocean currents
The prevailing wind is the most frequent
wind direction a location experiences.
Winds take on the characteristics of their
source region.
Ocean currents can be warm or cold, and
they affect the temperature of coastal
areas.
11. RAINFALL
• It is water from the atmosphere that
falls into the Earth s surface in the
form of rain, snow, sleet or hail.
• We use a rain gauge or pluviometer
to measure the precipitation
• The amount of precipitation is
expressed in mm.
pluviometer
12. The atmosphere contains water vapour. The amount
of water vapour in the air is called the humidity. Low
humidity means that the air is dry and high humidity
means that the air is moist.
When humid air rises, it cools and it produces
condensation, forming small droplets of water, which
form clouds. For precipitation to occur, the droplets
must become bigger and heavier. When this
happens, thet fall (precipitation) onto the Earth s
surface.
13. We get rain because of rising air.
Cloud (liquid water)
Condensation level
Water vapour
Altitude at which temperatures reach
dew point and therefore air starts to
condensate
Warm, moist air rises and it cools. As cool air can't hold as
much water vapour as warm air, the water vapour condenses
and turns into water droplets.
http://www.curriculumbits.com/prodimages/details/geography/types-of-rainfall.html
14. The amount of precipitation varies from one zone to
another, depending on factors as latitude, altitude, and
proximity to the sea.
15.
16. Relief Rainfall
With relief rainfall, it is the presence of hills or mountains that leads to the warm aid
rising.
The winds pick up moisture from the sea as they pass over it, and this makes the air
moist. As the air rises to pass over the higher land, it cools and the water vapour
condenses, forming clouds. The droplets then fall as rain, sleet, hail, or
snow, depending on the atmospheric conditions.
On the leeward side of the mountain (the side not facing the wind), it is much drier. This
area is said to be in the 'rainshadow'. There is little rain here as the air is descending
and warming up.
http://www.youtube.com/watch?v=BVykQf
RC_aI&feature=player_embedded
17.
18. Convectional Rainfall
This is very common in areas where ground is heated by the hot sun, such as the
Tropics.
The sun heats up the ground, which heats the air above it. This then rises and
cools, and the water vapour condenses into water droplets, forming clouds. The
droplets falls as rain under the influence of gravity.
http://www.youtube.com/watch?v=RkgThul2El8&feature=player_embedded
19.
20. Frontal Rainfall
Frontal rainfall is associated with depressions. It happens when two air masses (a warm
one and a cold one) meet. The warm air is pushed upwards over the cold air, and, as it
rises, it cools down. The water vapour condenses to form clouds, which give rain.
http://www.youtube.com/watch?v=D88dYNFyBq8&feature=
player_embedded
21.
22. AIR PRESSURE
•Air pressure is the force exerted by air particles. The air around us
pushes on us and every other thing (but our bodies and objects push
back with equal force so we don't notice it).
•We measure pressure with a barometer
•Pressure is expressed in milibars (mbar). Normal pressure at sea level
is 1013 mbar.
23. A low pressure
system, or "low," is an
area where the
atmospheric pressure is
lower than that of the area
surrounding it.
Cold front
represented
with blue
triangles
(cold sector)
Warm front
represented
with red
semicricles
(waarm sector)
A high pressure system, or
"high," is an area where the
atmospheric pressure is greater
than that of the surrounding
area.
24. L
H
Lows are usually associated with high
They are associated with dry, bright
winds, warm air, and air rising. Because
and settled weather.
of this, lows normally produce
clouds, precipitation, and other bad
weather such as tropical storms and
cyclones.
http://www.juicygeography.co.uk/downloads/flash/lowpressure.swf
http://www.juicygeography.co.uk/downloads/flash/highpressure.swf
25.
26. Areas of equal pressure are connected using isobars. They
never cross.
27. Isobars also show us the direction of the air.
Lows: inspiraling, upspiraling,counterclockwise in north, clockwise in south; stormy
weather
Highs:
outspiraling, downspiraling, clockwise in
north, counter-clockwise in south; fair
weather
28.
29. Air moves from a high pressure area toward a low pressure area.
L
H
H
33. How depressions form?
•Depression is a low-pressure system.
•A depression forms when cold polar air meets warm tropical air at a front. The
less dense warm air starts to rise over the colder air, and this starts to lower the air
pressure.
The boundary between the two masses is called a front. There are 2 fronts in a
typical depression:
1. the warm front - this passes first, and has the warm air behind it (i.e. it is
the front of the warm air). It is where the advancing warm air is forced to rise
over the cold air
2. the cold front - this follows, and has the cold air behind it (i.e. it is the front
of the cold air). This is where the advancing cold air undercuts the warm air in
front of it. http://www.phschool.com/atschool/phsciexp/active_art/weather_fronts/
36. On a weather map, the warm front is shown as red semi-circles and the cold
front as blue triangles.
37. How anticyclones form?
•Anticyclones are areas of high pressure caused by air sinking towards the ground.
• Once anticyclones develop, they tend to remain for several days, bringing
dry, bright and settled weather.
This image shows an anticyclone over Spain on 31st January 1999.
38. Summer Anticyclones
Summer anticyclones bring hot and sunny
weather due to clear skies (because of the
descending air). The days are long and the
sun high in the sky, which gives plenty of
opportunity for the land to be heated up.
These conditions could therefore lead to
convectional rainfall occurring.
Winter
Winter Anticyclones
Winter anticyclones bring clear days too. However
the sun is low in the sky and the days are
short, meaning you get cool days. Clear skies on a
winter’s night will allow frost to form. The land
quickly loses heat during the night, as there is no
cloud cover to act as insulation. The rapidly cooling
ground cools and condenses any moisture in the air
above it, forming droplets of ice when the
temperature falls below freezing. This is frost.
Fogs are also caused by clear winter nights. The
ground loses heat. This cools the air above it
causing moisture to condensate around dust
particles in the layer of air closest to the ground
surface. This is fog.
Summer
Pressure
High
High
Temperature
Very cold
Very warm
Clouds/Rainfall
No
No
Wind
Calm
Calm
Other weather
conditions
Frost/fog
Heat waves/drought
44. WIND
• It is the movement of air from areas of
high pressure to areas of low pressure.
• We measure wind with the wind gauge
(anemometer) in metres per second m/s
or km/hour. A weather vane shows the
direction of the wind.
a) Anemometre
b)- Weather vane
45. Most common types of winds
Prevailing winds always blow in the
same direction. For exmple, trade winds
always blow from the tropics toward the
equator.
PREVAILING WINDS
East winds
Westerlies
Trade winds
http://cienciasnaturales.es/CIRCULACIONATMOSFERICA.swf
46. PERIODIC WINDS, such as the monsoons in south and south-east Asia.
Monsoons change direction seasonally. In
summer, they blow from the Indian Ocean towards
the continent and bring abundant rain. In
winter, monsoons blow from the continent towards
the sea and bring dry stable weather.
47. SYNOPTIC WINDS, change daily, such as sea breezes
WARM
BREEZE
COOLER
Sea breezes blow from the sea
towards the land by day. At
noght, they blow from the land
towards the sea.
COOLER
BREEZE
WARM
48. How do weather and climate affect peoples' lives?
Weather and climate can have a major
effect on people's lives, for example:
Farming –
there is a direct link between the type of agriculture
and climate. For example, inland Spain has a drier
climate than coastal, with more contrasted
temperatures between winter and summer.
Northern Spain has a much wetter climate. Arable
crops tend to be rain-fed in centered areas, and
pastoral farming dominates in the north. Irrigated
crops grow in the east.
Sources of energy –
particularly windy areas have plenty of potential for
wind farms.
Water supply – for example, most of the UK s
population live in the south and east, which is
relatively dry. Water has to be transferred from
reservoirs in the wetter west.
Housing –
in particularly hot climates, buildings may be painted
white to reflect the heat. Houses in cold climates are
often built on stilts to insulate them from the freezing
ground.
Sport and leisure opportunities –
The Jamaican bobsled team of the film Cool
Runnings weren't too successful!
Why might this be?
http://www.youtube.com/watch?v=aaov7DNICPg&fe
ature=player_embedded
Snow and Ice - in areas where snow and ice are
rare, even a small snowfall can lead to chaos on the
roads. Schools may even be closed for the day!
49. How do weather and climate affect peoples' lives?
Tourism
Holidays in the Mediterranean
The graph shows the percentage of outbound
visitors to visit the top 10 destinations in 2003.
This graph shows the average temperatures in the UK and
Costa Blanca, and the average number of hours of sunshine.
To what extent do you think UK travel agents are justified in
using the slogan 'Come to Benidorm for your winter
break!'.
How does the Mediterranean climate differ from the UK
climate?
50.
51.
52. Where do we find temperatures?
Where do we find rainfall?
Unit of
measurement is
Celsius
Rainfall is
represented with
blue columns and
can be read in
this axis
Temperatures
are represented
with the red line
and can be read
in this axis
dryness
Example to read the
rainfall in August.
Precipitation in August is 5 mm. We
can say the climate in this place is
very dry.
Example to read the
temperatures in August.
Temperature in August is 27ºC. This month
is the hottests month of the year.
When the line of temperature is above the columns of rainfall, it
marks a period of dryness, as it is shown in this graph.
53. Climate Graphs
Climate graphs are a combination of a bar graph and a line graph. Temperature is shown on a line
graph, with the figures being shown on the right side of the graph. Rainfall is shown by a bar graph, with the
figures being shown down the left side of the graph.
The climate graph below shows average annual rainfall and temperature throughout the year for a particular
area.
Interpreting climate graphs
http://www4.uwsp.edu/geO/faculty/ritter/interactive_climat
e_map/climate_map.html
Temperature data
Is the temperature the same all year round? If it is different, how
many seasons does the location experience?
Which season is the warmest? Is it warm (10 to 20 C), hot (20 to
30 C) or very hot (above 30 C)?
Which season is the coolest? Is it mild (0 to 10 C), cold (-10 to 0 C)
or very cold (below -10 C)?
What is the range of temperature? (Subtract the minimum
temperature from the maximum temperature).
Rainfall data
Does the rainfall occur all year round?
What is the pattern of the rainfall? Check which season(s) is/are drier
or wetter than others.
What is the total annual rainfall? Add each month's total together to
get the annual total.
Then put the rainfall and temperature information together - what
does it tell you about this area?
Describe the patterns in temperature and rainfall, including how they relate
to each other. You now have a description of the climate.
54. TYPE
OF
CLIMATE
TEMPERATURES
PRECIPITATIONS
VEGETATION
Temperatures are high
throughout the year
(around 26 C in January
and 24 C in July)
Low temperature range
from 3 to 5 ºC
Abundant throughout
the year, + 1.500 mm
annually. There is no
dry season.
Rainforest. Dense forest
of evergreen trees
Average temperatures +
18ºC
Low temperature range
from 5 to 10 ºC
There are two seasons
humid/dry
(750-1.500 mm
annually)
Savannah. Very tall grass
in the rainy season,
which dries up in the dry
season.
Steppes (short thinly
scattered grass) in the
areas where the dry
season lasts longer.
Temperature range + 10
ºC
Temperatures very high
(+25ºC)
Precipitation is very
rare. (less than 250
mm annually)
Short, widely spaced
grass, thorny shrubs,
cactus. In the oases there
are palm trees.
EQUATORIAL
TROPICAL
DESSERT
55. TYPE OF
CLIMATE
TEMPERATURES
PRECIPITATIONS
VEGETATION
MARITIME
Moderate throughout the
year, mild in winter, cool in
summer.
Temparature range 10ºC
Abundant thoughout
the year.
(+
1.000
mm
annually)
Deciduous
forest
(beeches, oaks, lime
trees, etc) that lose their
leaves in autumn and
winter. Moors in nonforested
areas
and
grasslands.
CONTINENT
AL
Very
contrasting Between 300-1000
temperatures (cold winters, mm annually, mainly
and hot summers )
in summer
Temperature range + 20ºC
Coniferous forest (taiga)
with trees like pines and
firs,
grasslands
and
steppes.
MEDITERRA
NEAN
Temperatures are mild in Summers are very
winter and hot in summer. dry.
Precipitation
more abundant in
spring and fall
(300-1.000 mm)
Maditerranean
forest
(holm oaks and cork
oaks) and scrubland. Also
pines.
56. TYPE OF
CLIMATE
TEMPERATURES
PRECIPITATION
S
VEGETATION
POLAR
Very cold thorughout the Precipitation is very Tundra, moss, lichen and
year
rare (less than 250 dwarf shrubs
(not exceeding 0ºC)
mm a year)
ALPINE
Temperature falls with Precipitation
altitude. Winters cold, increases
summers cool
altitude
(+
1000
annually)
Varies with altitude
with
mm