Downloaded 151 times
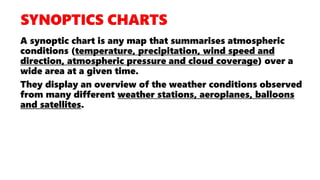
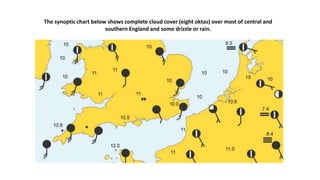
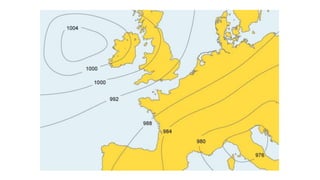
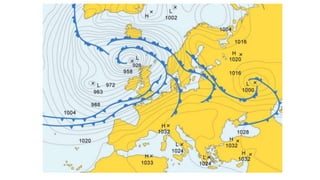
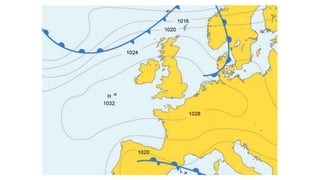

The document explains synoptic charts, which summarize atmospheric conditions like temperature and pressure over a wide area, allowing meteorologists to make accurate weather forecasts. It details different weather elements such as isobars, fronts, depressions, and anticyclones, highlighting how they influence weather patterns. The text emphasizes that low-pressure systems typically bring wet and windy weather, while high-pressure systems result in dry and settled conditions.


