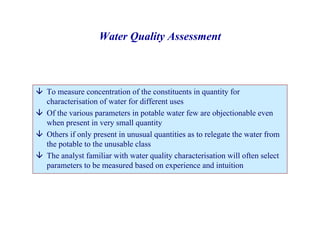
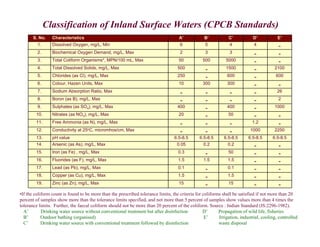
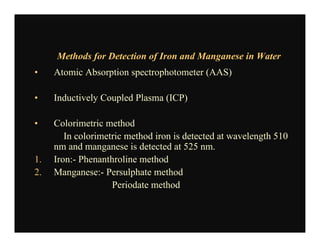
This document provides information on various methods for analyzing water quality parameters. It discusses the importance of measuring dissolved oxygen, biochemical oxygen demand, and bacteriological parameters like total coliform and fecal coliform. The principles, procedures, calculations, and sources of error for estimation of these parameters using standard methods are explained in detail. The document also discusses other water quality parameters like pH, conductivity, total dissolved solids, color and their significance in assessing water quality for different uses. Standards for classification of inland surface waters according to the Central Pollution Control Board are also presented.

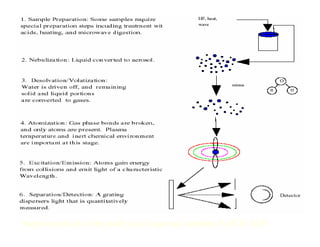
![• pH = - log10 [H+] = log10 1/[H+] OR [H+] = 10-pH
This method has advantage because all states of acidity and alkalinity of
solutions with respect to hydrogen and hyroxide ions can be expressed by
a series of positive numbers between 0 to 14
[ H+] (10o) 10-1 10-2 10-3 10-4 10-5 10-6 10-7 10-8 10-9 10-10 10-11 10-12 10-13 10-14
pH 0 1 2 3 4 5 6 7 8 9 10 11 12 13 14
pOH 14 13 12 11 10 9 8 7 6 5 4 3 2 1 0
[OH-]10-14 10-13 10-12 10-1110-10 10-9 10-8 10-7 10-6 10-5 10-4 10-3 10-2 10-1 10-0
• Chemical reactions depend on pH
• Water Supply and Waste Water Treatment
• Water Softening ,Precipitation., Coagulation, Disinfection, Corrosion
Control,Alkalinity and CO2 Measurement and fluoride activity
• Electrometric method - Using pH meter and electrodes
• e.m.f. produced in glass electrode system varies linearly with pH
• pH meter is calibrated potentiometrically with electrode system using standard
buffers having assigned values so that pH = - log10 [H+]
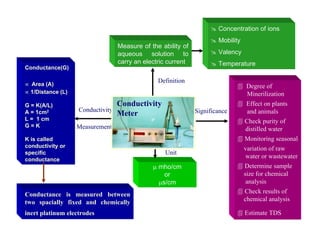
•
pH
Hydrogen Ion
Exponent
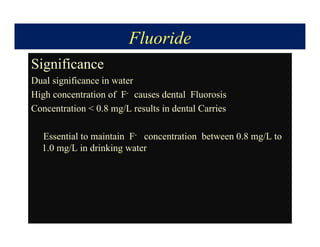
6.5 - 8.5
Definition
Significance
Measurement
pH Meter](https://image.slidesharecdn.com/lsd-neeri-waterqualityanalysis-230301185119-106430b7/85/LSD-NEERI-Water-Quality-Analysis-pdf-31-320.jpg)


![Type
• Carbonate hardness
• Non carbonate hardness
Methods of Analysis
Hardness by calculation
• Calcium can be estimated by AAS, ICP and EDTA titrimetric methods
• Magnesium can be estimated by AAS, ICP and Gravimatric method
Total Hardness by Calculation :
mg CaCO3 / L = 2.497 [Ca mg/L] + 4.118 [Mg mg/L]
Contd...](https://image.slidesharecdn.com/lsd-neeri-waterqualityanalysis-230301185119-106430b7/85/LSD-NEERI-Water-Quality-Analysis-pdf-68-320.jpg)


