1
Copyright
©
2017
The
Nielsen
Company.
Confidential
and
proprietary.
Copyright © 2017 The Nielsen Company. Confidential and proprietary.
WHAT’S NEXT?
TODAY’S CHANGE IS
TOMORROW’S OPPORTUNITY
2
Copyright
©
2017
The
Nielsen
Company.
Confidential
and
proprietary.
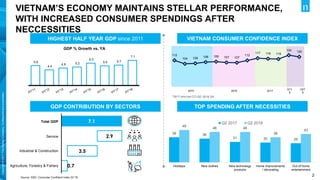
VIETNAM’S ECONOMY MAINTAINS STELLAR PERFORMANCE,
WITH INCREASED CONSUMER SPENDINGS AFTER
NECCESSITIES
5.6
4.4
4.9 5.2
6.3
5.5 5.7
7.1
GDP % Growth vs. YA
HIGHEST HALF YEAR GDP since 2011
7.1
0.7
3.5
2.9
0 1 2 3 4 5 6 7 8
Agriculture, Forestry & Fishery
Industry & Construction
Service
Total GDP
Total GDP
Service
Industrial & Construction
Agriculture, Forestry & Fishery
112
104 105 108 109 107 107
112
117 116 115
124 120
*2017 only has CCI Q2, Q3 & Q4
VIETNAM CONSUMER CONFIDENCE INDEX
TOP SPENDING AFTER NECESSITIES
38 36
31 30 29
49
46 46
38
43
Holidays New clothes New technology
products
Home improvements
/ decorating
Out of home
entertainment
Q2 2017 Q2 2018
GDP CONTRIBUTION BY SECTORS
Source: GSO. Consumer Confident Index Q1’18
2015 2016 2017
Q11
8
Q21
8
3
Copyright
©
2017
The
Nielsen
Company.
Confidential
and
proprietary.
Retail
8.2%
Finance & Banking
7.6%
Agriculture
4%
Source: *Nielsen Retail Audit Data FMCG Urban (YTD TY );
Desk Research http://www.vietnam-briefing.com/news/vietnams-economy-sees-strong-growth-in-the-first-half-of-2018.html/
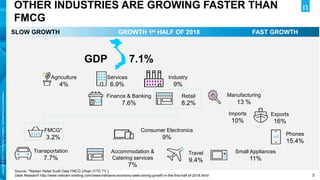
OTHER INDUSTRIES ARE GROWING FASTER THAN
FMCG
FAST GROWTH
SLOW GROWTH
GDP 7.1%
Services
6.9%
Industry
9%
Manufacturing
13 %
Exports
16%
Imports
10%
FMCG*
3.2%
GROWTH 1st HALF OF 2018
Phones
15.4%
Transportation
7.7%
Consumer Electronics
9%
Small Appliances
11%
Travel
9.4%
Accommodation &
Catering services
7%
4
Copyright
©
2017
The
Nielsen
Company.
Confidential
and
proprietary.
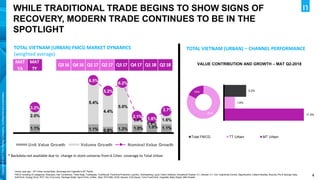
WHILE TRADITIONAL TRADE BEGINS TO SHOW SIGNS OF
RECOVERY, MODERN TRADE CONTINUES TO BE IN THE
SPOTLIGHT
Versus year ago – MT Urban except Beer, Beverage and Cigarette is MT Partial
FMCG including 33 categories: Shampoo, Hair Conditioner, Toilet Soap, Toothpaste, Toothbrush, Feminine Protection, Laundry, Dishwashing Liquid, Fabric Softener, Household Cleaner, H.I. Aerosol, H.I. Coil, Insecticide Control, Msg-Bouillon, Instant Noodles, Biscuits, Pie & Sponge Cake,
Soft Drink, Energy Drink, RTD Tea, Fruit Juice, Package Water, Sport Drink, Coffee , Beer, RTD Milk, SCM, Sauces, Chili Sauce, Tonic Food Drink, Cigarette, Baby Diaper, Milk Powder
TOTAL VIETNAM (URBAN) FMCG MARKET DYNAMICS
(weighted average)
1.1% 1.1% 0.8% 1.2% 1.0% 1.0% 1.1%
2.0%
5.4%
4.4%
5.0%
1.1%
0.8%
1.6%
3.2%
6.5%
5.2%
6.2%
2.1%
1.8%
2.7%
MAT
YA
MAT
TY Q3 16 Q4 16 Q1 17 Q2 17 Q3 17 Q4 17 Q1 18 Q2 18
Unit Value Growth Volume Growth Nominal Value Growth
MAT
YA
MAT
TY
Q316 Q416 Q117 Q217 Q317 Q417 Q118 Q218
* Backdata not available due to change in store universe from 6 Cities coverage to Total Urban
TOTAL VIETNAM (URBAN) – CHANNEL PERFORMANCE
VALUE CONTRIBUTION AND GROWTH – MAT Q2-2018
82%
18% 3.2%
1.6%
11.3%
Total FMCG TT Urban MT Urban
5
Copyright
©
2017
The
Nielsen
Company.
Confidential
and
proprietary.
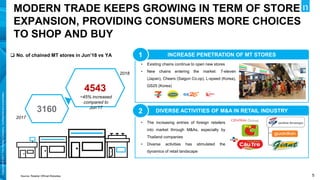
INCREASE PENETRATION OF MT STORES
1
DIVERSE ACTIVITIES OF M&A IN RETAIL INDUSTRY
2
• Existing chains continue to open new stores
• New chains entering the market: 7-eleven
(Japan), Cheers (Saigon Co.op), L-speed (Korea),
GS25 (Korea)
3160
4543
• The increasing entries of foreign retailers
into market through M&As, especially by
Thailand companies
• Diverse activities has stimulated the
dynamics of retail landscape
 No. of chained MT stores in Jun’18 vs YA
~45% increased
compared to
Jun’17
MODERN TRADE KEEPS GROWING IN TERM OF STORE
EXPANSION, PROVIDING CONSUMERS MORE CHOICES
TO SHOP AND BUY
Source: Retailer Official Websites
2017
2018
Copyright
©
2018
The
Nielsen
Company.
Confidential
and
proprietary.
6
7
Copyright
©
2017
The
Nielsen
Company.
Confidential
and
proprietary.
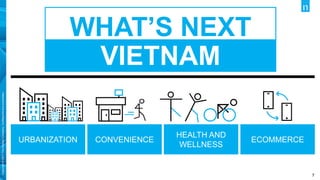
WHAT’S NEXT
VIETNAM
URBANIZATION CONVENIENCE
HEALTH AND
WELLNESS
ECOMMERCE
8
Copyright
©
2017
The
Nielsen
Company.
Confidential
and
proprietary.
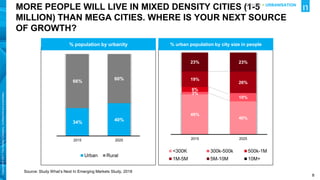
MORE PEOPLE WILL LIVE IN MIXED DENSITY CITIES (1-5
MILLION) THAN MEGA CITIES. WHERE IS YOUR NEXT SOURCE
OF GROWTH?
Source: Study What’s Next In Emerging Markets Study, 2018
34%
40%
66%
60%
2015 2025
Urban Rural
% urban population by city size in people
49%
40%
3%
10%
6%
19%
26%
23% 23%
2015 2025
<300K 300k-500k 500k-1M
1M-5M 5M-10M 10M+
% population by urbanity
DRIVER > URBANISATION
9
Copyright
©
2017
The
Nielsen
Company.
Confidential
and
proprietary.
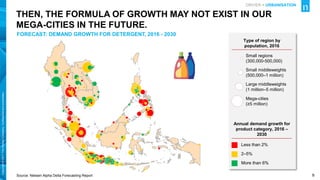
Source: Nielsen Alpha Delta Forecasting Report
THEN, THE FORMULA OF GROWTH MAY NOT EXIST IN OUR
MEGA-CITIES IN THE FUTURE.
Type of region by
population, 2016
Mega-cities
(≥5 million)
Large middleweights
(1 million–5 million)
Small middleweights
(500,000–1 million)
Small regions
(300,000-500,000)
Less than 2%
2–5%
More than 6%
Annual demand growth for
product category, 2016 –
2030
FORECAST: DEMAND GROWTH FOR DETERGENT, 2016 - 2030
DRIVER > URBANISATION
10
Copyright
©
2017
The
Nielsen
Company.
Confidential
and
proprietary.
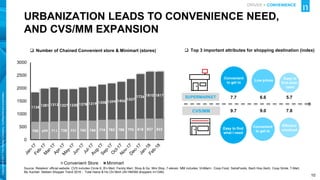
 Number of Chained Convenient store & Minimart (stores)
URBANIZATION LEADS TO CONVENIENCE NEED,
AND CVS/MM EXPANSION
Source: Retailers’ official website. CVS includes Circle K, B’s Mart, Family Mart, Shop & Go, Mini Stop, 7-eleven. MM includes: VinMart+, Coop Food, SatraFoods, Bach Hoa Xanh, Coop Smile, T-Mart,
My Auchan. Nielsen Shopper Trend 2016 - Total Hanoi & Ho Chi Minh (All HM/SM shoppers n=1346)
700 699 711 728 731 745 744 774 783 788 795 818 827 823
1134
1281 1313 1227 1230 1278 1319 1358 1399 1456 1557
1726 1810 1817
0
500
1000
1500
2000
2500
3000
Convenient Store Minimart
 Top 3 important attributes for shopping destination (index)
Easy to
find what I
need
Convenient
to get to
Low prices
SUPERMARKET
CVS/MM
Efficient
checkout
Easy to find
what I need
Convenient
to get to
7.7 6.6 5.7
9.7 9.0 7.8
DRIVER > CONVENIENCE
11
Copyright
©
2017
The
Nielsen
Company.
Confidential
and
proprietary.
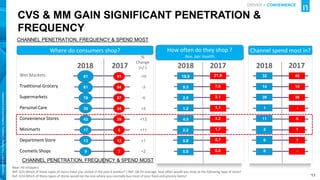
CVS & MM GAIN SIGNIFICANT PENETRATION &
FREQUENCY
Where do consumers shop?
Base: All shoppers
Ref: Q7a Which of these types of stores have you visited in the past 4 weekss? | Ref: Q8 On average, how often would you shop at the following type of store?
Ref: Q7d Which of these types of stores would be the one where you normally buy most of your food and grocery items?
2017
%
Change
(+/-)
How often do they shop ?
Ave. per month
2018 2017
Channel spend most in?
2018
2018 2017
Wet Markets
Traditional Grocery
Supermarkets
Personal Care
Convenience Stores
Minimarts
Department Store
Cosmetic Shops
-10
-3
-5
+5
+13
+11
+1
+2
21.9
7.6
2.1
1.1
3.2
1.7
0.7
0.8
0.5
18.9
9.5
2.5
1.2
4.5
2.2
0.8
0.8
0.6
32
14
39
1
11
2
0
0
0
46
10
36
-
6
1
1
-
-
91
84
87
34
29
6
12
7
1
81
81
78
39
42
17
13
9
0
CHANNEL PENETRATION, FREQUENCY & SPEND MOST
DRIVER > CONVENIENCE
CHANNEL PENETRATION, FREQUENCY & SPEND MOST
12
Copyright
©
2017
The
Nielsen
Company.
Confidential
and
proprietary.
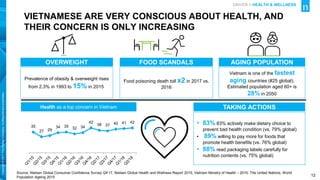
VIETNAMESE ARE VERY CONSCIOUS ABOUT HEALTH, AND
THEIR CONCERN IS ONLY INCREASING
Source: Nielsen Global Consumer Confidence Survey Q4’17, Nielsen Global Health and Wellness Report 2015; Vietnam Ministry of Health – 2015, The United Nations, World
Population Ageing 2015
Prevalence of obesity & overweight rises
from 2.3% in 1993 to 15% in 2015
Food poisoning death toll x2 in 2017 vs.
2016
Vietnam is one of the fastest
aging countries (#25 global).
Estimated population aged 60+ is
28% in 2050
OVERWEIGHT FOOD SCANDALS AGING POPULATION
DRIVER > HEALTH & WELLNESS
Health as a top concern in Vietnam
35
27 29
34 35 32 34
42
38 37 40 41 42 • 83% 83% actively make dietary choice to
prevent bad health condition (vs. 79% global)
• 89% willing to pay more for foods that
promote health benefits (vs. 76% global)
• 88% read packaging labels carefully for
nutrition contents (vs. 75% global)
TAKING ACTIONS
13
Copyright
©
2017
The
Nielsen
Company.
Confidential
and
proprietary.
57%
63% 58%
60%
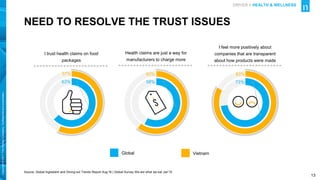
I trust health claims on food
packages
Health claims are just a way for
manufacturers to charge more
I feel more positively about
companies that are transparent
about how products were made
Global Vietnam
NEED TO RESOLVE THE TRUST ISSUES
Source; Global Ingredient and Dining-out Trends Report Aug’16 | Global Survey We are what we eat Jan’15
73%
83%
DRIVER > HEALTH & WELLNESS
14
Copyright
©
2017
The
Nielsen
Company.
Confidential
and
proprietary.
 E-commerce % Contribution to total FMCG Sales – 2016
• Source: Nielsen estimation based on Nielsen Retail Measurement Service, Nielsen Consumer Panel Service, Nielsen Online sales e-book and other leading industry sources
FMCG E-COMMERCE IS STILL AT EARLY STAGE IN
VIETNAM
DRIVER > ECOMMERCE
15
Copyright
©
2017
The
Nielsen
Company.
Confidential
and
proprietary.
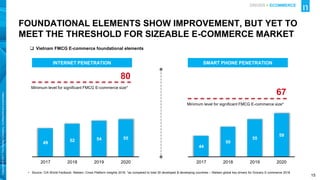
 Vietnam FMCG E-commerce foundational elements
• Source: CIA World Factbook; Nielsen: Cross Platform Insights 2016. *as compared to total 30 developed & developing countries – Nielsen global key drivers for Grocery E-commerce 2018
49
52 54 55
2017 2018 2019 2020
Minimum level for significant FMCG E-commerce size*
80
INTERNET PENETRATION
44
50
55
59
2017 2018 2019 2020
Minimum level for significant FMCG E-commerce size*
67
SMART PHONE PENETRATION
FOUNDATIONAL ELEMENTS SHOW IMPROVEMENT, BUT YET TO
MEET THE THRESHOLD FOR SIZEABLE E-COMMERCE MARKET
DRIVER > ECOMMERCE
16
Copyright
©
2017
The
Nielsen
Company.
Confidential
and
proprietary.
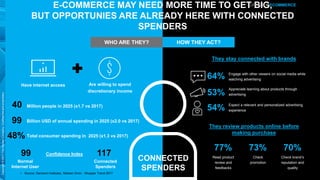
Have internet access Are willing to spend
discretionary income
WHO ARE THEY? HOW THEY ACT?
40 Million people in 2025 (x1.7 vs 2017)
99 Billion USD of annual spending in 2025 (x2.0 vs 2017)
48% Total consumer spending in 2025 (x1.3 vs 2017)
99
Normal
Internet User
117
Connected
Spenders
Confidence Index
They stay connected with brands
Engage with other viewers on social media while
watching advertising
Appreciate learning about products through
advertising
Expect a relevant and personalized advertising
experience
77%
53%
54%
They review products online before
making purchase
Read product
review and
feedbacks
73%
Check
promotion
70%
Check brand’s
reputation and
quality
• Source: Demand Institutes, Nielsen Omni - Shopper Trend 2017
64%
E-COMMERCE MAY NEED MORE TIME TO GET BIG,
BUT OPPORTUNIES ARE ALREADY HERE WITH CONNECTED
SPENDERS
CONNECTED
SPENDERS
DRIVER > ECOMMERCE
17
Copyright
©
2017
The
Nielsen
Company.
Confidential
and
proprietary.
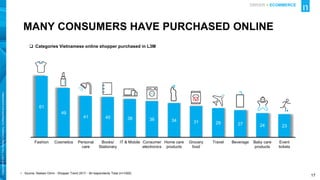
 Categories Vietnamese online shopper purchased in L3M
61
49
41 40 38 36 34 31 29 27 24 23
Fashion Cosmetics Personal
care
Books/
Stationary
IT & Mobile Consumer
electronics
Home care
products
Grocery
food
Travel Beverage Baby care
products
Event
tickets
• Source: Nielsen Omni - Shopper Trend 2017 - All respondents Total (n=1005)
MANY CONSUMERS HAVE PURCHASED ONLINE
DRIVER > ECOMMERCE
18
Copyright
©
2017
The
Nielsen
Company.
Confidential
and
proprietary.
ORGANISATION
SOCIETY
MARKET
GLOBAL/MACRO
BRANDS
INDUSTRY
TO IMPROVE IS TO CHANGE; TO BE
PERFECT IS TO CHANGE OFTEN”
Winston Churchill
19
Copyright
©
2017
The
Nielsen
Company.
Confidential
and
proprietary.
Copyright © 2017 The Nielsen Company. Confidential and proprietary.