RETAIL OVERVIEW ASIA
& VIETNAM
OCTOBER, 2016
Copyright©2016TheNielsenCompany.Confidentialandproprietary.
2
Copyright©2015TheNielsenCompany.Confidentialandproprietary.
AGENDA
Key Retail trends in Asia
Vietnam consumers and market landscape
It’s golden time to build your strategic partnership with
Retailer
4 trends shaping future of retail in Vietnam
Copyright©2015TheNielsenCompany.Confidentialandproprietary.
3
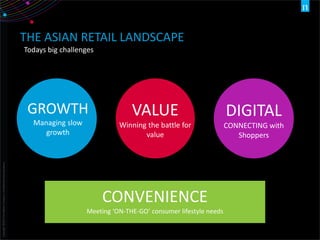
Todays big challenges
DIGITAL
CONNECTING with
Shoppers
VALUE
Winning the battle for
value
GROWTH
Managing slow
growth
THE ASIAN RETAIL LANDSCAPE
CONVENIENCE
Meeting ‘ON-THE-GO’ consumer lifestyle needs
Copyright©2012TheNielsenCompany.Confidentialandproprietary.
4
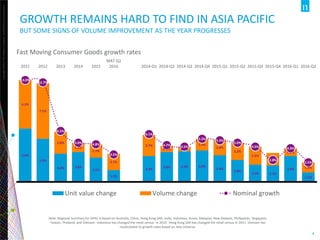
GROWTH REMAINS HARD TO FIND IN ASIA PACIFIC
BUT SOME SIGNS OF VOLUME IMPROVEMENT AS THE YEAR PROGRESSES
6.8%
5.5%
3.6% 3.8%
3.1%
1.5%
3.3%
3.8% 3.9% 4.0%
3.4%
2.8%
2.2% 2.1%
3.3%
1.2%
6.2%
7.1%
2.8%
1.2%
1.7%
2.1%
2.7%
0.8% 0.6%
1.5%
2.0%
2.2%
2.3%
1.6%
1.0%
1.3%
13.0%
12.7%
6.5%
5.0% 4.8%
3.5%
6.1%
4.7% 4.5%
5.5% 5.3%
5.0%
4.5%
2.8%
4.3%
2.5%
2011 2012 2013 2014 2015
MAT Q2
2016 2014-Q1 2014-Q2 2014-Q3 2014-Q4 2015-Q1 2015-Q2 2015-Q3 2015-Q4 2016-Q1 2016-Q2
Unit value change Volume change Nominal growth
Fast Moving Consumer Goods growth rates
Note: Regional Summary for APAC is based on Australia, China, Hong Kong SAR, India, Indonesia, Korea, Malaysia, New Zealand, Philippines, Singapore,
Taiwan, Thailand, and Vietnam. Indonesia has changed the retail census in 2010. Hong Kong SAR has changed the retail census in 2011. Vietnam has
recalculated its growth rates based on new universe.
Copyright©2012TheNielsenCompany.Confidentialandproprietary.
5
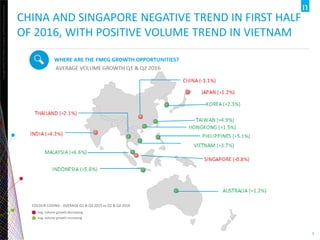
CHINA AND SINGAPORE NEGATIVE TREND IN FIRST HALF
OF 2016, WITH POSITIVE VOLUME TREND IN VIETNAM
COLOUR CODING - AVERAGE Q1 & Q2 2015 vs Q1 & Q2 2016
Avg. volume growth decreasing
Avg. volume growth increasing
Copyright©2012TheNielsenCompany.Confidentialandproprietary.
6
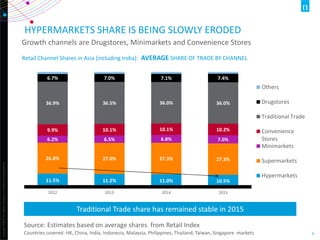
Retail Channel Shares in Asia (including India): AVERAGE SHARE OF TRADE BY CHANNEL
Traditional Trade share has remained stable in 2015
11.5% 11.2% 11.0% 10.5%
26.8% 27.0% 27.3% 27.3%
6.2% 6.5% 6.8% 7.0%
9.9% 10.1% 10.1% 10.2%
36.9% 36.5% 36.0% 36.0%
6.7% 7.0% 7.1% 7.4%
2012 2013 2014 2015
Others
Drugstores
Traditional Trade
Convenience
Stores
Minimarkets
Supermarkets
Hypermarkets
HYPERMARKETS SHARE IS BEING SLOWLY ERODED
Growth channels are Drugstores, Minimarkets and Convenience Stores
Source: Estimates based on average shares from Retail Index
Countries covered -HK, China, India, Indonesia, Malaysia, Philippines, Thailand, Taiwan, Singapore markets
Copyright©2015TheNielsenCompany.Confidentialandproprietary.
7
7.4
0.9
3.1
1
5
1.7
4.8
5.3
HYPER/SUPER PERSONAL CARE CVS ONLINE
2008 2013
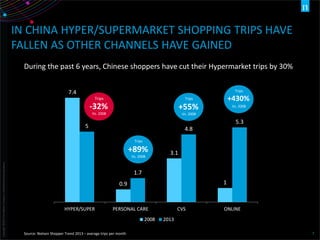
IN CHINA HYPER/SUPERMARKET SHOPPING TRIPS HAVE
FALLEN AS OTHER CHANNELS HAVE GAINED
During the past 6 years, Chinese shoppers have cut their Hypermarket trips by 30%
Source: Nielsen Shopper Trend 2013 – average trips per month
-32%
Vs. 2008
Trips
+89%
Vs. 2008
Trips
+55%
Vs. 2008
Trips +430%
Vs. 2008
Trips
Copyright©2015TheNielsenCompany.Confidentialandproprietary.
8
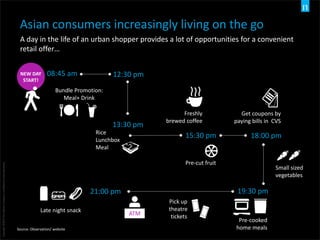
Asian consumers increasingly living on the go
A day in the life of an urban shopper provides a lot of opportunities for a convenient
retail offer…
Small sized
vegetables
Source: Observation/ website
Get coupons by
paying bills in CVS
NEW DAY
START!
08:45 am 12:30 pm
13:30 pm
18:00 pm
21:00 pm
Freshly
brewed coffee
15:30 pm
19:30 pm
Late night snack
Pre-cut fruit
Pre-cooked
home meals
Rice
Lunchbox
Meal
Bundle Promotion:
Meal+ Drink
ATM
Pick up
theatre
tickets
Copyright©2016TheNielsenCompany.Confidentialandproprietary.
9
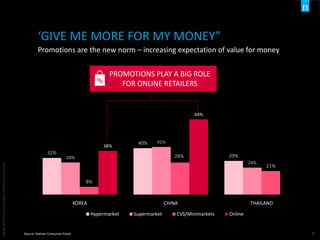
‘GIVE ME MORE FOR MY MONEY”
Promotions are the new norm – increasing expectation of value for money
Source: Nielsen Consumer Panel
32%
40%
29%28%
41%
24%
8%
28%
21%
38%
64%
KOREA CHINA THAILAND
Hypermarket Supermarket CVS/Minimarkets Online
PROMOTIONS PLAY A BIG ROLE
FOR ONLINE RETAILERS
Copyright©2015TheNielsenCompany.Confidentialandproprietary.
10
95.9 97.4
87.3
76.6
20's 30's 40's 50's~
2014
(Y2014)
90%
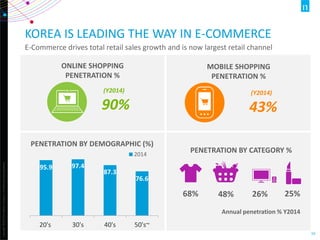
KOREA IS LEADING THE WAY IN E-COMMERCE
E-Commerce drives total retail sales growth and is now largest retail channel
68% 48% 26% 25%
Annual penetration % Y2014
(Y2014)
43%
MOBILE SHOPPING
PENETRATION %
ONLINE SHOPPING
PENETRATION %
PENETRATION BY DEMOGRAPHIC (%)
PENETRATION BY CATEGORY %
Copyright©2016TheNielsenCompany.Confidentialandproprietary.
11
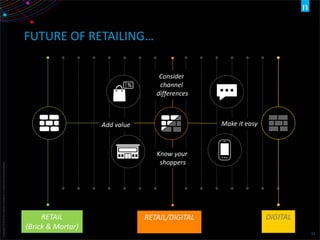
FUTURE OF RETAILING…
RETAIL
(Brick & Mortar)
Add value Make it easy
Consider
channel
differences
Know your
shoppers
RETAIL/DIGITAL DIGITAL
Copyright©2012TheNielsenCompany.Confidentialandproprietary.
12
VIETNAM
CONSUMERS AND
MARKET LANSDCAPE
Copyright©2012TheNielsenCompany.Confidentialandproprietary.
13
18.2
10.0
6.8
4.6
0.7 2.1
2011 2012 2013 2014 2015 9M
2016
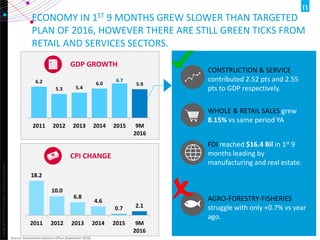
ECONOMY IN 1ST 9 MONTHS GREW SLOWER THAN TARGETED
PLAN OF 2016, HOWEVER THERE ARE STILL GREEN TICKS FROM
RETAIL AND SERVICES SECTORS.
Source: Government Statistics Office (September 2016)
6.2
5.3 5.4
6.0
6.7
5.9
2011 2012 2013 2014 2015 9M
2016
GDP GROWTH
CPI CHANGE
FDI reached $16.4 Bil in 1st 9
months leading by
manufacturing and real estate.
WHOLE & RETAIL SALES grew
8.15% vs same period YA
CONSTRUCTION & SERVICE
contributed 2.52 pts and 2.55
pts to GDP respectively.
AGRO-FORESTRY-FISHERIES
struggle with only +0.7% vs year
ago.
Copyright©2012TheNielsenCompany.Confidentialandproprietary.
14
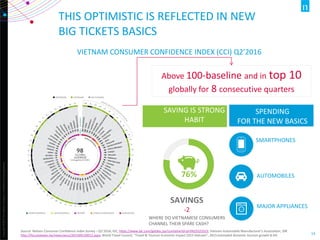
THIS OPTIMISTIC IS REFLECTED IN NEW
BIG TICKETS BASICS
Source: Nielsen Consumer Confidence Index Survey – Q1’2016; IDC, https://www.idc.com/getdoc.jsp?containerId=prVN25523315; Vietnam Automobile Manufacturer’s Association; GfK
http://focustaiwan.tw/news/aeco/201509130012.aspx; World Travel Council, “Travel & Tourism Economic Impact 2015 Vietnam”, 2015 estimated domestic tourism growth 8.4%
VIETNAM CONSUMER CONFIDENCE INDEX (CCI) Q2’2016
Above 100-baseline and in top 10
globally for 8 consecutive quarters
SPENDING
FOR THE NEW BASICS
SMARTPHONES
MAJOR APPLIANCES
AUTOMOBILES76%
SAVINGS
-2
WHERE DO VIETNAMESE CONSUMERS
CHANNEL THEIR SPARE CASH?
SAVING IS STRONG
HABIT
Copyright©2016TheNielsenCompany.Confidentialandproprietary.
15
4.0%
3.7%
4.7%
2.9%
1.7%
5.2%
2.9%
6.2%
6.4%
3.7%
4.2%
1.2%
5.0%
5.5% 5.5%
4.8%
3.5%
5.9%
3.3%
7.3%
7.8%
5.3%
6.1%
3.1%
0%
1%
2%
3%
4%
5%
6%
7%
8%
9%
Unit Value Growth Volume Change Nominal Growth
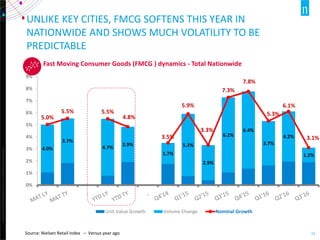
UNLIKE KEY CITIES, FMCG SOFTENS THIS YEAR IN
NATIONWIDE AND SHOWS MUCH VOLATILITY TO BE
PREDICTABLE
Source: Nielsen Retail Index – Versus year ago
Fast Moving Consumer Goods (FMCG ) dynamics - Total Nationwide
Copyright©2012TheNielsenCompany.Confidentialandproprietary.
16
7.4% 7.9% 8.2% 9.6%
3.9% 7.6% 8.6% 5.9% 10.1% 7.2%
3.0% 2.9%
-5.4% -3.2% -1.4%
8.3% 9.8%
3.5% 2.3% -0.4%
6.3% 6.3% 5.2%
8.2%
3.3%
6.8% 7.1% 6.8% 5.8%
3.1%
5.8% 3.4% 1.8%
4.7% 5.3% 6.7% 6.5% 3.9% 2.9%
-0.3%
6.5% 6.1%
3.7%
5.2%
2.2%
7.8% 9.0%
5.2%
7.6%
4.9%
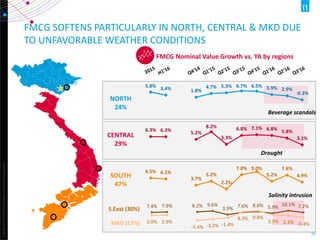
FMCG Nominal Value Growth vs. YA by regions
NORTH
24%
CENTRAL
29%
SOUTH
47%
FMCG SOFTENS PARTICULARLY IN NORTH, CENTRAL & MKD DUE
TO UNFAVORABLE WEATHER CONDITIONS
S.East (30%)
MKD (17%)
Salinity intrusion
Drought
Beverage scandals
Copyright©2016TheNielsenCompany.Confidentialandproprietary.
17
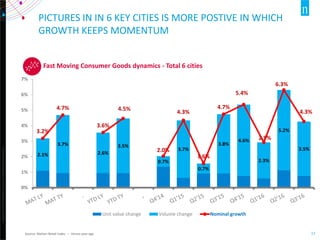
PICTURES IN IN 6 KEY CITIES IS MORE POSTIVE IN WHICH
GROWTH KEEPS MOMENTUM
Source: Nielsen Retail Index – Versus year ago
Fast Moving Consumer Goods dynamics - Total 6 cities
2.1%
3.7%
2.6%
3.5%
0.7%
3.7%
0.7%
3.8%
4.6%
2.3%
5.2%
3.5%
3.2%
4.7%
3.6%
4.5%
2.0%
4.3%
1.6%
4.7%
5.4%
2.9%
6.3%
4.3%
0%
1%
2%
3%
4%
5%
6%
7%
Unit value change Volume change Nominal growth
Copyright©2016TheNielsenCompany.Confidentialandproprietary.
19
Source: Nielsen Retail Index – Versus year ago (*): MT excludes Saigon Coopmart
Unite Value change Volume change Nominal growth
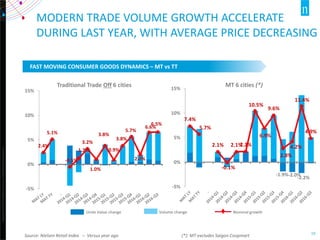
FAST MOVING CONSUMER GOODS DYNAMICS – MT vs TT
-1.9%-2.0%
-2.2%
7.4%
5.7%
2.1%
-0.1%
2.1%2.2%
10.5%
6.9%
9.6%
2.8%
4.2%
11.4%
4.9%
-5%
0%
5%
10%
15%
MT 6 cities (*)
2.4%
5.1%
-0.5%
1.2%
3.2%
1.0%
3.8%
0.9%
3.8%
5.7%
2.0%
6.5%
6.6%
-5%
0%
5%
10%
15%
Traditional Trade Off 6 cities
MODERN TRADE VOLUME GROWTH ACCELERATE
DURING LAST YEAR, WITH AVERAGE PRICE DECREASING
Copyright©2012TheNielsenCompany.Confidentialandproprietary.
20
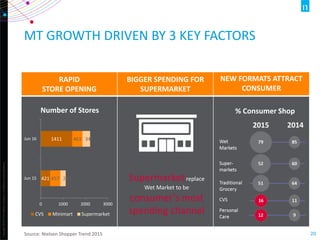
RAPID
STORE OPENING
BIGGER SPENDING FOR
SUPERMARKET
NEW FORMATS ATTRACT
CONSUMER
MT GROWTH DRIVEN BY 3 KEY FACTORS
421
1411
457
461
240
341
0 1000 2000 3000
Jun 15
Jun 16
CVS Minimart Supermarket
Supermarketreplace
Wet Market to be
consumer’s most
spending channel
Number of Stores % Consumer Shop
Source: Nielsen Shopper Trend 2015
Copyright©2012TheNielsenCompany.Confidentialandproprietary.
21
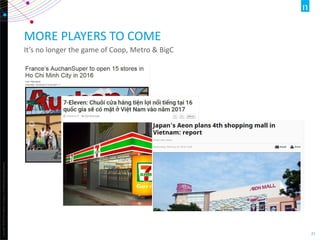
MORE PLAYERS TO COME
It’s no longer the game of Coop, Metro & BigC
22
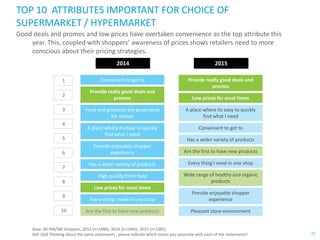
Base: All HM/SM shoppers, 2013 (n=1486), 2014 (n=1465), 2015 (n=1382)
Ref: Q18 Thinking about the same statements , please indicate which stores you associate with each of the statements?
TOP 10 ATTRIBUTES IMPORTANT FOR CHOICE OF
SUPERMARKET / HYPERMARKET
Good deals and promos and low prices have overtaken convenience as the top attribute this
year. This, coupled with shoppers’ awareness of prices shows retailers need to more
conscious about their pricing strategies.
2014 2015
1
2
3
4
5
6
7
8
9
10 Are the first to have new products Pleasant store environment
Every thing I need in one shop
Provide enjoyable shopper
experience
Low prices for most items
Wide range of healthy and organic
products
High quality fresh food
Every thing I need in one shop
Provide enjoyable shopper
experience
Has a wider variety of products
Food and groceries are good value
for money
A place where its easy to quickly
find what I need
Has a wider variety of products
Are the first to have new products
A place where its easy to quickly
find what I need
Convenient to get to
Provide really good deals and
promos Low prices for most items
Convenient to get to Provide really good deals and
promos
Copyright©2013TheNielsenCompany.Confidentialandproprietary.
23
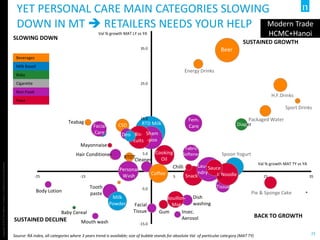
Val % growth MAT TY vs YA
Val % growth MAT LY vs YA
YET PERSONAL CARE MAIN CATEGORIES SLOWING
DOWN IN MT  RETAILERS NEEDS YOUR HELP
Source: RA index, all categories where 3 years trend is available; size of bubble stands for absolute Val of particular category (MAT TY)
SUSTAINED GROWTH
BACK TO GROWTH
SLOWING DOWN
SUSTAINED DECLINE
Beverages
Milk Based
Baby
Cigarette
Non-Food
Food
-15.0
-5.0
5.0
15.0
25.0
35.0
-25 -15 -5 5 15 25 35
Beer
H.F.Drinks
Energy Drinks
Packaged Water
Sport Drinks
Diaper
Fem.
Care
RTD Milk
Pie & Sponge Cake
Spoon Yogurt
I. Noodle
Tissue
SauceLau-
ndry
Snack
Fabric
Softener
Sham
-poo
Bis-
cuits
Bouillon-
Msg
Coffee
Cooking
Oil
Personal
Wash
Milk
Powder
Tooth
paste
Facial
Care
Hair Conditioner
Deo
Dish
washing
Body Lotion
Mouth wash
RTDT
Insec.
Aerosol
Facial
Tissue
Chilli
Cleaner
Mayonnaise
Teabag
CSD
GumBaby Cereal
Modern Trade
HCMC+Hanoi
Copyright©2013TheNielsenCompany.Confidentialandproprietary.
24
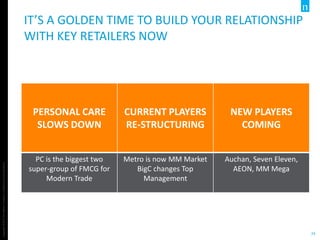
IT’S A GOLDEN TIME TO BUILD YOUR RELATIONSHIP
WITH KEY RETAILERS NOW
PERSONAL CARE
SLOWS DOWN
CURRENT PLAYERS
RE-STRUCTURING
NEW PLAYERS
COMING
PC is the biggest two
super-group of FMCG for
Modern Trade
Metro is now MM Market
BigC changes Top
Management
Auchan, Seven Eleven,
AEON, MM Mega
BUILDING STRATEGIC PARTNERSHIP WITH
RETAILER WITH CAT-MAN PRACTICE
Copyright©2013TheNielsenCompany.Confidentialandproprietary.
26
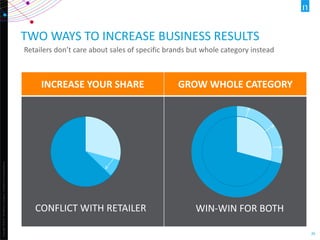
INCREASE YOUR SHARE GROW WHOLE CATEGORY
TWO WAYS TO INCREASE BUSINESS RESULTS
Retailers don’t care about sales of specific brands but whole category instead
CONFLICT WITH RETAILER WIN-WIN FOR BOTH
Copyright©2013TheNielsenCompany.Confidentialandproprietary.
27
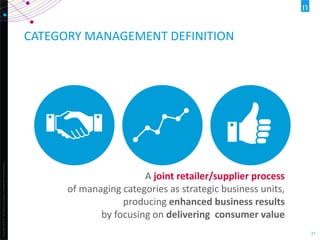
CATEGORY MANAGEMENT DEFINITION
A joint retailer/supplier process
of managing categories as strategic business units,
producing enhanced business results
by focusing on delivering consumer value
Copyright©2013TheNielsenCompany.Confidentialandproprietary.
28
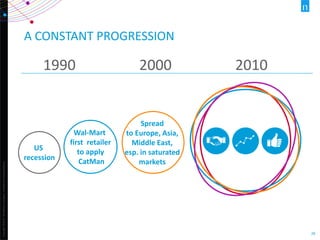
A CONSTANT PROGRESSION
US
recession
Wal-Mart
first retailer
to apply
CatMan
Spread
to Europe, Asia,
Middle East,
esp. in saturated
markets
1990 2000 2010
Copyright©2013TheNielsenCompany.Confidentialandproprietary.
29
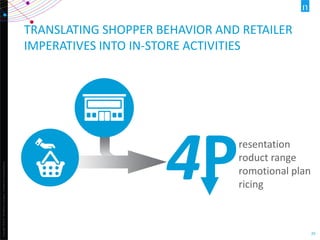
TRANSLATING SHOPPER BEHAVIOR AND RETAILER
IMPERATIVES INTO IN-STORE ACTIVITIES
4Presentation
roduct range
romotional plan
ricing
30
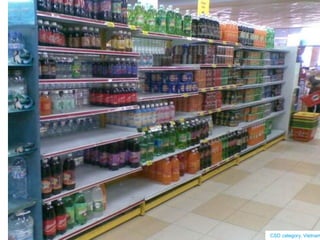
Workshop
CSD category, Vietnam
31
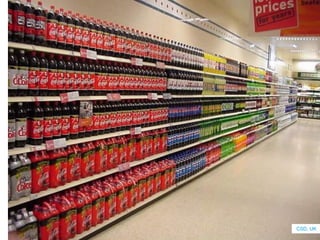
Workshop CSD, UK
32
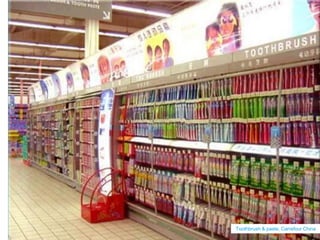
Workshop Toothbrush & paste, Carrefour China
Copyright©2013TheNielsenCompany.Confidentialandproprietary.
33
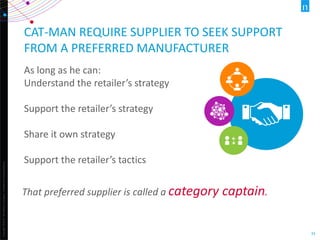
CAT-MAN REQUIRE SUPPLIER TO SEEK SUPPORT
FROM A PREFERRED MANUFACTURER
As long as he can:
Understand the retailer’s strategy
Support the retailer’s strategy
Share it own strategy
Support the retailer’s tactics
That preferred supplier is called a category captain.
WHAT CAT-MAN INCLUDES?
Copyright©2013TheNielsenCompany.Confidentialandproprietary.
35
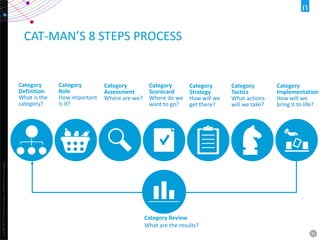
CAT-MAN’S 8 STEPS PROCESS
Category
Definition
What is the
category?
Category
Strategy
How will we
get there?
Category
Tactics
What actions
will we take?
Category
Role
How important
is it?
Category
Scorecard
Where do we
want to go?
Category
Assessment
Where are we?
Category Review
What are the results?
Category
Implementation
How will we
bring it to life?
Copyright©2013TheNielsenCompany.Confidentialandproprietary.
36
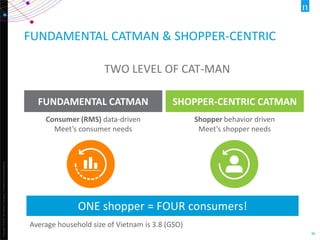
SHOPPER-CENTRIC CATMAN
Shopper behavior driven
Meet’s shopper needs
FUNDAMENTAL CATMAN & SHOPPER-CENTRIC
TWO LEVEL OF CAT-MAN
FUNDAMENTAL CATMAN
Consumer (RMS) data-driven
Meet’s consumer needs
ONE shopper = FOUR consumers!
Average household size of Vietnam is 3.8 (GSO)
Copyright©2013TheNielsenCompany.Confidentialandproprietary.
37
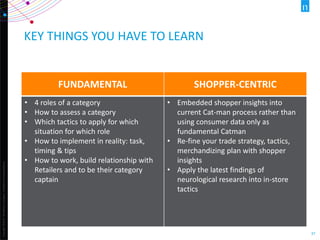
KEY THINGS YOU HAVE TO LEARN
FUNDAMENTAL SHOPPER-CENTRIC
• 4 roles of a category
• How to assess a category
• Which tactics to apply for which
situation for which role
• How to implement in reality: task,
timing & tips
• How to work, build relationship with
Retailers and to be their category
captain
• Embedded shopper insights into
current Cat-man process rather than
using consumer data only as
fundamental Catman
• Re-fine your trade strategy, tactics,
merchandizing plan with shopper
insights
• Apply the latest findings of
neurological research into in-store
tactics
Copyright©2013TheNielsenCompany.Confidentialandproprietary.
38
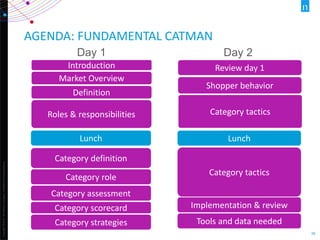
AGENDA: FUNDAMENTAL CATMAN
Definition
Market Overview
Introduction
Roles & responsibilities
Category definition
Category role
Category assessment
Category scorecard
Category strategies
Lunch
Category tactics
Shopper behavior
Review day 1
Category tactics
Implementation & review
Tools and data needed
Lunch
Day 1 Day 2
Copyright©2013TheNielsenCompany.Confidentialandproprietary.
39
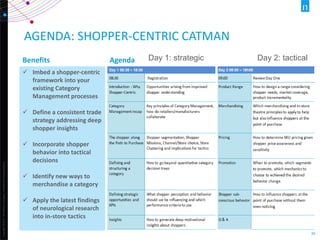
 Imbed a shopper-centric
framework into your
existing Category
Management processes
 Define a consistent trade
strategy addressing deep
shopper insights
 Incorporate shopper
behavior into tactical
decisions
 Identify new ways to
merchandise a category
 Apply the latest findings
of neurological research
into in-store tactics
Benefits Agenda Day 1: strategic Day 2: tactical
AGENDA: SHOPPER-CENTRIC CATMAN
Copyright©2015TheNielsenCompany.Confidentialandproprietary.
40
4 TRENDS SHAPING THE
FUTURE
OF RETAIL IN VIETNAM
pyright©2016TheNielsenCompany.Confidentialandproprietary.
41
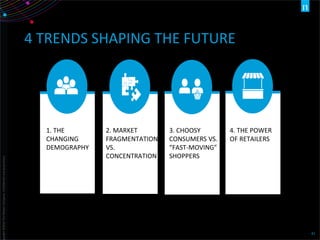
4 TRENDS SHAPING THE FUTURE
1. THE
CHANGING
DEMOGRAPHY
2. MARKET
FRAGMENTATION
VS.
CONCENTRATION
3. CHOOSY
CONSUMERS VS.
“FAST-MOVING”
SHOPPERS
4. THE POWER
OF RETAILERS
42
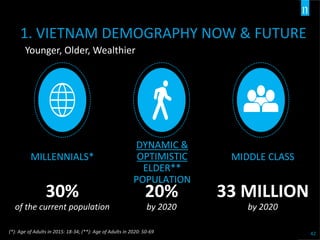
Younger, Older, Wealthier
MIDDLE CLASS
33 MILLION
by 2020
DYNAMIC &
OPTIMISTIC
ELDER**
POPULATION
20%
by 2020
MILLENNIALS*
30%
of the current population
(*): Age of Adults in 2015: 18-34; (**): Age of Adults in 2020: 50-69
1. VIETNAM DEMOGRAPHY NOW & FUTURE
Copyright©2012TheNielsenCompany.Confidentialandproprietary.
43Source: Nielsen Traditional Trade Thought Leadership Q4, 2015; : Nielsen Retail Index
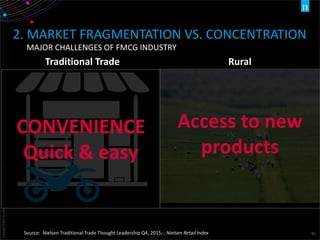
Traditional Trade Rural
2. MARKET FRAGMENTATION VS. CONCENTRATION
MAJOR CHALLENGES OF FMCG INDUSTRY
Copyright©2012TheNielsenCompany.Confidentialandproprietary.
44Source: Nielsen Traditional Trade Thought Leadership Q4, 2015; : Nielsen Retail Index
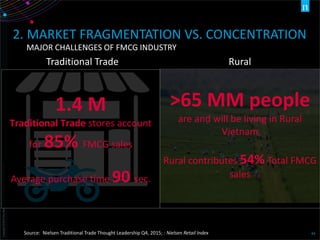
>65 MM people
are and will be living in Rural
Vietnam
Rural contributes 54% Total FMCG
sales
1.4 M
Traditional Trade stores account
for 85% FMCG sales
Average purchase time 90 sec.
Traditional Trade Rural
2. MARKET FRAGMENTATION VS. CONCENTRATION
MAJOR CHALLENGES OF FMCG INDUSTRY
Copyright©2012TheNielsenCompany.Confidentialandproprietary.
45Source: Nielsen Traditional Trade Thought Leadership Q4, 2015; : Nielsen Retail Index
Traditional Trade Rural
Access to new
products
CONVENIENCE
Quick & easy
2. MARKET FRAGMENTATION VS. CONCENTRATION
MAJOR CHALLENGES OF FMCG INDUSTRY
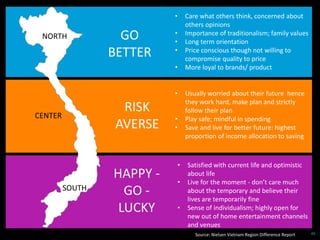
46Source: Nielsen Vietnam Region Difference Report
• Care what others think, concerned about
others opinions
• Importance of traditionalism; family values
• Long term orientation
• Price conscious though not willing to
compromise quality to price
• More loyal to brands/ product
GO
BETTER
RISK
AVERSE
HAPPY -
GO -
LUCKY
• Usually worried about their future hence
they work hard, make plan and strictly
follow their plan
• Play safe; mindful in spending
• Save and live for better future: highest
proportion of income allocation to saving
• Satisfied with current life and optimistic
about life
• Live for the moment - don’t care much
about the temporary and believe their
lives are temporarily fine
• Sense of individualism; highly open for
new out of home entertainment channels
and venues
NORTH
CENTER
SOUTH
47
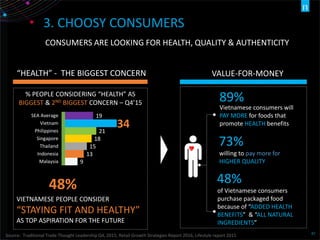
CONSUMERS ARE LOOKING FOR HEALTH, QUALITY & AUTHENTICITY
“HEALTH” - THE BIGGEST CONCERN
Source: Traditional Trade Thought Leadership Q4, 2015; Retail Growth Strategies Report 2016, Lifestyle report 2015
48%
VIETNAMESE PEOPLE CONSIDER
“STAYING FIT AND HEALTHY”
AS TOP ASPIRATION FOR THE FUTURE
9
13
15
18
21
34
19
Malaysia
Indonesia
Thailand
Singapore
Philippines
Vietnam
SEA Average
% PEOPLE CONSIDERING “HEALTH” AS
BIGGEST & 2ND BIGGEST CONCERN – Q4’15
VALUE-FOR-MONEY
89%
Vietnamese consumers will
PAY MORE for foods that
promote HEALTH benefits
73%
willing to pay more for
HIGHER QUALITY
48%
of Vietnamese consumers
purchase packaged food
because of “ADDED HEALTH
BENEFITS” & “ALL NATURAL
INGREDIENTS”
3. CHOOSY CONSUMERS
48
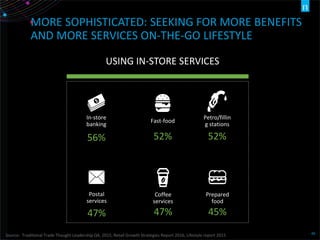
MORE SOPHISTICATED: SEEKING FOR MORE BENEFITS
AND MORE SERVICES ON-THE-GO LIFESTYLE
USING IN-STORE SERVICES
Petro/fillin
g stations
52%
Fast-food
52%
In-store
banking
56%
Prepared
food
45%
Coffee
services
47%
Postal
services
47%
Source: Traditional Trade Thought Leadership Q4, 2015; Retail Growth Strategies Report 2016, Lifestyle report 2015
Copyright©2012TheNielsenCompany.Confidentialandproprietary.
49
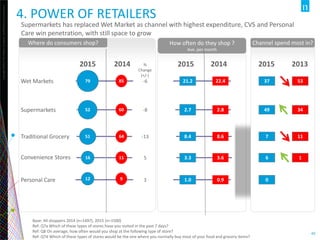
Where do consumers shop?
Base: All shoppers 2014 (n=1497), 2015 (n=1500)
Ref: Q7a Which of these types of stores have you visited in the past 7 days?
Ref: Q8 On average, how often would you shop at the following type of store?
Ref: Q7d Which of these types of stores would be the one where you normally buy most of your food and grocery items?
Supermarkets
Wet Markets
Traditional Grocery
52
2014
60
79 85
51 64
%
Change
(+/-)
-6
-8
-13
How often do they shop ?
Ave. per month
2015 2014
21.2 22.4
2.7 2.8
8.4 8.6
3.3 3.6
Channel spend most in?
2015
37
49
7
616 11 5
2015
Convenience Stores
4. POWER OF RETAILERS
Personal Care 12 9 3 1.0 0.9 0
Supermarkets has replaced Wet Market as channel with highest expenditure, CVS and Personal
Care win penetration, with still space to grow
2013
53
34
11
1
Copyright©2012TheNielsenCompany.Confidentialandproprietary.
50
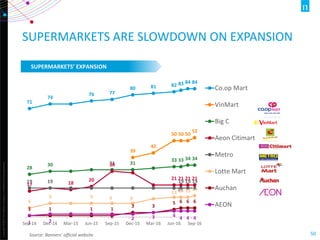
SUPERMARKETS ARE SLOWDOWN ON EXPANSION
Source: Banners’ official website
SUPERMARKETS’ EXPANSION
71
74
76 77
80 81 82 83 84 84
39
42
50 50 50
52
28
30 31 31
33 33 34 34
17
19 18
20
30
21 21 21 21
19 19
19
19 19 19
6
9 9 9 9
13 13 13 14
1 1 1 1
3 3
5 6 6 6
1 2
2 2 3 4
4 4 4
Sep-14 Dec-14 Mar-15 Jun-15 Sep-15 Dec-15 Mar-16 Jun-16 Sep-16
Co.op Mart
VinMart
Big C
Aeon Citimart
Metro
Lotte Mart
Auchan
AEON
Copyright©2012TheNielsenCompany.Confidentialandproprietary.
51Source: Banners’ official website
Number of Store
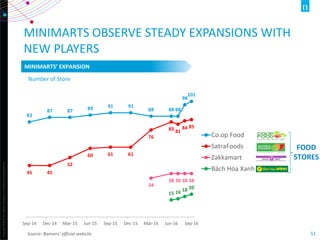
MINIMARTS OBSERVE STEADY EXPANSIONS WITH
NEW PLAYERS
FOOD
STORES
MINIMARTS’ EXPANSION
83
87 87 89 91 91
88 88 88
98
101
45 45
52
60 61 61
76
83 81
84 85
34
38 38 38 38
15 16 18 20
Sep-14 Dec-14 Mar-15 Jun-15 Sep-15 Dec-15 Mar-16 Jun-16 Sep-16
Co.op Food
SatraFoods
Zakkamart
Bách Hóa Xanh
Copyright©2012TheNielsenCompany.Confidentialandproprietary.
52Source: Banners’ official website
Number of Store
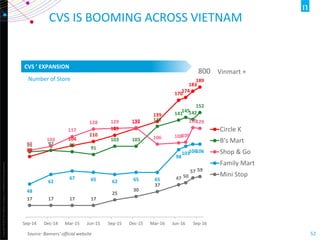
CVS IS BOOMING ACROSS VIETNAM
CVS ’ EXPANSION
88
97
104
110
119
129
139
170
174
183
189
95 97 95
91
103 103
132
141
145142
152
97
103
117
128 129 130
106 108109
130129
48
62
67 65 62 65 65
98
103106106
17 17 17 17
25
30
37
47 50
57 59
Sep-14 Dec-14 Mar-15 Jun-15 Sep-15 Dec-15 Mar-16 Jun-16 Sep-16
Circle K
B's Mart
Shop & Go
Family Mart
Mini Stop
Vinmart +800
Copyright©2012TheNielsenCompany.Confidentialandproprietary.
53Source: Banners’ official website
Number of Store
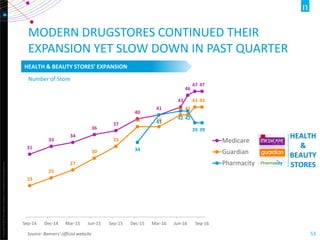
MODERN DRUGSTORES CONTINUED THEIR
EXPANSION YET SLOW DOWN IN PAST QUARTER
HEALTH
&
BEAUTY
STORES
HEALTH & BEAUTY STORES’ EXPANSION
31
33
34
36
37
40
41
43
46
47 47
23
25
27
30
33
38 38
41 41
43 43
34
41
42 42
39 39
Sep-14 Dec-14 Mar-15 Jun-15 Sep-15 Dec-15 Mar-16 Jun-16 Sep-16
Medicare
Guardian
Pharmacity
Copyright©2012TheNielsenCompany.Confidentialandproprietary.
54
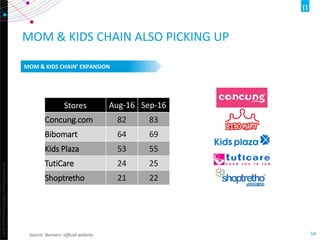
MOM & KIDS CHAIN ALSO PICKING UP
Source: Banners’ official website
MOM & KIDS CHAIN’ EXPANSION
Stores Aug-16 Sep-16
Concung.com 82 83
Bibomart 64 69
Kids Plaza 53 55
TutiCare 24 25
Shoptretho 21 22
Copyright©2012TheNielsenCompany.Confidentialandproprietary.
55
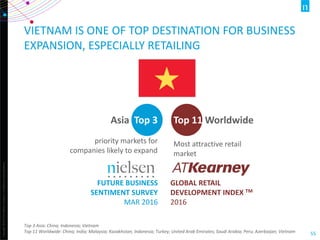
VIETNAM IS ONE OF TOP DESTINATION FOR BUSINESS
EXPANSION, ESPECIALLY RETAILING
Asia Top 3
priority markets for
companies likely to expand
Top 11 Worldwide
Most attractive retail
market
FUTURE BUSINESS
SENTIMENT SURVEY
MAR 2016
GLOBAL RETAIL
DEVELOPMENT INDEX TM
2016
Top 3 Asia: China; Indonesia; Vietnam
Top 11 Worldwide: China; India; Malaysia; Kazakhstan; Indonesia; Turkey; United Arab Emirates; Saudi Arabia; Peru; Azerbaijan; Vietnam
Nielsen - Vietnam retail landscape