SlideShare a Scribd company logo
1 of 128
Where E= Energy of
radiation
h=Planck’s
constant
µ=Frequency of
radiation
The energy of an EMR can be
given by the following equation:
E=hµ
1
Frequency(µ)=
c/
λ
Where c=velocity of light in
vacuum λ= wavelength
2
:-Hence, E=hµ
E=hc/λ
Therefore,energy of a radiation depends upon
frequency and wavelength of radiation.
The arrangement obtained by arranging various
types of electromagnetic waves or radiations in
order of their increasing wavelegth or
decreasing frequencies is called
electromagnetic spectrum.
The electromagnetic spectrum is divided into a
number of regions; these are artificial divisions in
the sense that they have been defined solely as
a result of differences in the instrumentation
required for producing and detecting radiation
of a given frequency range. 3
Electromagnetic Radiation
 Electromagnetic radiation consist of discrete packages
 of energy which are called as photons.
 Frequency (ν):
◦ It is defined as the number of times electrical field
radiation oscillates in one second.
◦ The unit for frequency is Hertz (Hz).
1 Hz = 1 cycle per second
 Wavelength (λ):
◦ It is the distance between two nearest parts of the
wave in the same phase i.e. distance between two
nearest crest or troughs.
The relationship between wavelength & frequency can
be written as:
c = ν λ
As photon is subjected to energy, so
E = h ν = h c / λ
6
 Gamma Ray Region:0.02-1 A
 X- rays:1 -10A
 UV-Visible: Vaccum-1-180
uv-180-400
Visible 400-800nm
IR: IR Near: 0.7-2.5 Micron
IR :2.5 -15 Micron
far IR-15-200 Micron
Microwave:0.1mm-1 cm
Radio waves:10m-1cm
Types of energies
 Translational
 Rotational
 Vibrational
 Electronic
E₁-Eₒ= h𝜗
Etotal = Eelectronic + Evibrational +
Erotational
The energies decreases in the following order:
Electronic ⪢ Vibrational ⪢ Rotational
spectroscopy
10
Spectroscopy is the measurement
and interpretation of electromagnetic
radiation absorbed or emitted when
the molecules or atoms or ions of a
sample moves from one energy state
to another energy state
SPECTROSCOPY
11
1)Atomic spectroscopy :Here,the changes in energy
takes place at atomic level.
Eg: Atomic absorption spectroscopy,
Flame photometry
2)Molecular spectroscopy:Here,the changes in
energy takes place at molecular level.
Eg: UVspectroscopy,colorimetry,infra red
spectroscopy
12
Absorption spectrophotometry can be
defined as the measurement of absorption of
radiant energy by various substances.
It involves the measurement of
absorptive capacity for radiant energy in the
visible,UV and IR regions of the spectrum.
13
o λ- 400-800nm
o Coloured substance absorbs light of different λ
in different manner and hence get an
absorption curve
o The λ at which maximum absorption takes
place is called as λmax
o λmax is characteristic for every coloured
substance
14
 On plotting a graph of concentration v/s
absorbance,we get a calibration curve that is
useful in determining the concentration or
amount of a drug substance in the given sample
solution.
16
UV spectroscopy is concerned with the study of
absorption
17
of uv radiation which ranges from 200-400nm.
Valence electrons absorb the energy thereby
molecules undergoes transition from ground
state to excited state.
This absorption is characteristic and depends
on the nature of electrons present.
:
18
UV Spectroscopy
Observed electronic transitions
From the molecular orbital diagram, there are several possible electronic
transitions that can occur, each of a different relative energy:
Energy
s*
p
s
p*
n
s
s
p
n
n
s*
p*
p*
s*
p*
alkanes
carbonyls
unsaturated cmpds.
O, N, S, halogens
carbonyls
 1- σ → σ* transition
 2- π → π* transition
 3- n → σ* transition
 4- n → π* transition
Electronic Transition
20
σ electron from orbital is excited to
corresponding anti-bonding orbital σ*.
The energy required is large for this transition.
The organic compounds in which all the valence
shell electrons are involved in the formation of
σ bond do not show absorption in normal uv
region (200-400nm)
This transition is observed with saturated
compounds.
1) σ-σ*
21
Eg: Methane(CH₄) has C-H bond only and can
undergo σ-
σ* transition and shows absorption maxima at
122nm.
The usual spectroscopic technique cannot be used
below
200 nm.
To study this high energy transition,the entire
region should be evacuated (Vacuum uv
region)
Here,the excitation ocuurs with net retention of
electronic spin
This region is less informative 22
 π electron in a bonding orbital is
excited to corresponding anti-bonding
orbital π*.
 Energy required is less when compared to n-σ*
Compounds containing multiple bonds
like
alkenes,alkynes,carbonyls,nitriles,arom
atic compounds etc undergo π-π*
transition.
Eg:Alkenes generally absorb in the region 170-
205nm.
2) π-π*
23
Absorption usually occurs in the
ordinary uv spectrophotometer
Absorption bands in unconjugated alkenes
(170- 190nm)
Absorption bands in carbonyls (180 nm)
Introduction of alkyl group in olefinic
linkage produces bathochromic shift
24
Saturated compounds containing one hetero
atom with unshared pair of electrons(n) like
O,N,S and halogens are capable of n-σ*
transition.
These transition require less energy
than σ-σ* transition.
In saturated alkyl halides, the energy required
for transition decrease with increase in the size
of halogen atom (or decrease in
electronegativity)
3) n-σ*
25
 Eg:Methyl chloride has a λmax of
173nm. Methyl iodide has a λmax
of 258nm.
 This type of transition is very sensitive to
hydrogen bonding
Eg: Alcohol &amines
 Hydrogen bonding shift the uv
absorptions to shorter wavelength.
26
An electron from non-bonding orbital is promoted to
anti-bonding π*orbital.
Compounds containing double bonds
involving hetero atoms(C=O,N=O) undergo
such type of transitions.
This transition require minimum energy out of all
transitions and shows absorption band at
longer wavelength around 300nm.
Eg:Saturated aldehydes shows both type of
transitions (n-π*, π-π*) at {low energy and high
energy} around 290 and 180 nm.
4) n-π*
27
~ 115 nm
~ 200 – 400 nm
~ 150-250
nm
~ 400 - 700
nm
n- π* ˂ π -π* ˂ n- σ* ˂ σ ⇾ σ*
TERMS USED IN UV- VISIBLE
SPECTROSCOPY
29
 Chromophore is defined as the nucleus or
any isolated covalently bonded group
responsible for the absorptionof light radiation.
 Any group which exhibits absorption of
electromagnetic radiations in the visible or
ultraviolet region.
C=C , C=O ,NO2 etc
 Some of the important chromophores
arecarbonyls,acids,esters,nitrile,ethylenic
groups. 30
31
 These are co-ordinatively saturated or un-
saturated groups which themselves do not
absorb radiations,but when present alongwith
a chromophore enhances the absorbing
properties of chromophore.
 Also known as colour enhancing group.
 All auxochromes have one or more non-
bonding pair of electrons.
-NH2 ,-OH ,-OR,-COOH etc
 It extend the conjugation of a chromophore by
sharing the non-bonding electrons. 2
9
33
ABSORPTION
& INTENSITY
SHIFTS
34
When the absorption maxima(λmax)of a
compound shifts to longer wavelength,it is
known as bathochromic shift or red shift.
The effect is due to the presence of auxochrome
by change of solvent.
Eg: The n-π* transition for carbonyl
compounds experiencesbathochromic shift
when the polarityof solvent is decreased.
1) Bathochromic shift(red shift)
35
When the absorption maxima (λmax) of a
compound shifts to a shorter wavelength,it is
known as hypsochromic shift or blue shift.
The effect is due to the presence of a group
causes removal of conjugation or by
change of solvent.
2) Hypsochromic shift(blue shift)
36
Eg
:
Aniline shows blue shift in acidic medium since it
loses conjugation.Aniline(280nm) &Anilinium
ion (- 203nm).
37
3) Hyperchromic effect
38
4) Hypochromic effect
39
SHIFTS &
EFFECTS
40
 The spectrum consist of sharp peaks and each
peak will correspond to the promotion of
electron from one electronic level to another.
 During promotion,the electron moves from a given
vibrational and rotational level within one electronic
mode to the other within the next electronic mode.
 Thus,there will be a large no of possible transitions
 Hence,not just one but a large no. of wavelengths
which are close enough will be absorbed
resulting in the formation of bands 3
9
1) K Band
42
K-Bands originate due to π-π* transition
from a compound containing a
conjugated system
Such type of bands arise in
compounds like dienes,polyenes and
enones etc.
Compound Transition λmax(nm) εmax
Acetophenon
e
π-π* 240 13,000
1,3-butadiene π-π* 217 21,000
R-Band transition originate due to n-π* transition
of a single chromophoric group and having
atleast one lone pair of electrons on the hetero
atom
These are less intense with εmax value below
100
Compound Transition λmax(nm) εmax
Acetone n-π* 270 15
Acetaldehyd
e
n-π* 293 12
43
Such type of bands arise due to π-π*
transition in aromatic or hetero-aromatic
molecules.
Benzene shows absorption peaks between
230- 270nm.when a chromophoric group is
attached to the benzene ring ,the B-Bands
are observed at longer wavelengths than
the more intense K-Bands.
Compound Transition λmax(nm) εmax
Benzene π-π* 255 215
Phenol π- π* 270 1450 44
E-Band originate due to the electronic
transitions in the benzenoid systems of three
ethylenic bonds which are in closed cyclic
conjugation.
These are further characterized as E1and E2
bands
E1 band which appear at shorter wavelength is
usually more intense than the E2 band for the
same compound which appears at longer
wavelength.
Compound E1 Band E1 Band E2 Band E2 Band
λmax(nm) εmax λmax(nm) εmax
Benzene 184 50,000 204 79,000
Napthalene 221 133,000 286 9,300
45
46
BEER’S LAW
According to this law,when a beam of monochromatic
radiation is passed through a solution of absorbing species,the
intensity of beam of monochromatic light decreases exponentially
with increase in concentration of absorbing species
LAMBERT’S LAW
-dI/dc α I
Lambert’s law states that the rate of decrease of
intensity of monochromatic light with the thickness of the
medium is directly proportional to the intensity of incident
light.
-dI/dt α I
47
I₀ is the radiation coming in
I is the radiation coming
out
-dI α I
dc
-dI =KI
dc
-dI =Kdc
dc
-lnI=kc+b-----------1
On integration ,b is constant of integration
When concentration is 0 ,no absorbance hence I=l0
Sustituting in equation 1
-lnI0=b
substituting the value of b in eq 1
-lnI=kc-lnI0
lnI0-lnI=kc
ln I0 =kc (since log A –logB = log A)
I B
I0 /I = ekc (removing natural logarithm)
I /I0 =e-kc (making inverse on both sides)
I=I0e-kc -------------------2
Lambert’s law
-dI/dt α I
Equation can be simplified like equation 1
Thus we get
I=I0e-kt-----------------------3
Equation 2 and 3 can be combined to get
I=I0e-kct
I/I0=10-kct(converting natural logarithm to base 10)
I0/I=10kct
Log I0/I=Kct(taking log on both sides)----------------4
Transmittance (T)=I/I0 and absorbance(A)=log1/T
Hence A=log 1/I/I0
A=log I0/I----------------5
ɛ =E 1% x molecular weight
1cm 10
E1% means the absorbance of 1% w/v Solution 1cm using a
path length of 1cm
52
53
 Real Deviation
 Spectral deviation
 Chemical deviations
Real Deviation- Concentrtion
Spectral Deviation
 Stray radiation
 improper slit width
 Fluctuation s in single beam
.
3.CHEMICAL DEVIATIONS:
Association of molecules
This can be explained by taking the examples
of methylene blue at small concentration(10‾⁵
molar) and at concentration above 10‾⁵molar.
57
 Dissociation of molecules
This can be explained by the fact that
dichromate ions posses their maximum
absorbance at 450nm which is orange in
colour .But upon dilution,it will be dissociated to
chromate ions having maximum absorbance
at 410nm which is yellow in colour.
This law is not valid in case if the absorbing
material is coagulated into a small number of
large units.
This law shows deviation if the absorbing
material at the required wavelength contains
presence of impurities.
58
Incomplete reaction
 Sufficient time
 Instability of colour
Eg determination of iron with thioglycollic acid
UV-Vis Spectrophotometer
Absorption spectrophotometry in the ultraviolet and visible
region is considered to be one of the oldest physical method
for quantitative analysis and structural elucidation.
Wavelength
• UV- 200-400nm
• VISIBLE- 400-800nm
61
PHOTOMETER
SPECTOPHOTOMETER
COLORIMETER
 PHOTOMETER: An instrument for measuring the
intensity of light or the relative intensity of a pair of
lights. Also called an illuminometer. It utilizes filter
to isolate a narrow wavelength region.
62
 SPECTOPHOTOMETER: An instrument measures the
ratio, or a function of the two, of the radiant power of two
EM beams over a large wavelength region. It utilizes
dispersing element (Prisms/Gratings) instead of filters, to
scan large wavelength region.
63
 COLORIMETER: An instrument which is used for
measuring absorption in the visible region is generally
called colorimeter.
source of radiant energy.
Collimating system.
monochromator system.
sample holder or container to hold sample.
detector system of collecting transmitted radiation.
suitable amplifier or readout device.
64
65
REQUIREMENTS OF AN IDEALSOURCE
 It should be stable and should not allow fluctuations.
 It should emit light of continuous spectrum of high and
uniform intensity over the entire wavelength region in which
it’s used.
 It should provide incident light of sufficient intensity for the
transmitted energy to be detected at the end of optic path.
 It should not show fatigue on continued use.
66
TUNGSTEN HALOGEN LAMP
67
Its construction is similar to a house hold lamp.
The bulb contains a filament of Tungsten fixed in evacuated
condition and then filled with inert gas.
The filament can be heated up to 3000 k, beyond this
Tungsten starts sublimating.
It is used when polychromatic light is required. To prevent this
along with inert gas some amount of halogen is introduced
(usually Iodine).
 Sublimated form of tungsten reacts with Iodine to
form Tungsten –Iodine complex.
 Which migrates back to the hot filament where it
decomposes and Tungsten get deposited.
 DEMERIT:
 It emits the major portion of its radiant energy in
near IR region of the spectrum.
68
HYDROGEN DISCHARGE LAMP:
In Hydrogen discharge lamp pair of electrodes is enclosed in a
glass tube (provided with silica or quartz window for UV
radiation to pass trough) filled with hydrogen gas.
When current is passed trough these electrodes maintained at
high voltage, discharge of electrons occurs which excites
hydrogen molecules which in turn cause emission of UV
radiations in near UV region.
They are stable and robust.
69
XENON DISCHARGE LAMP:
70
It possesses two tungsten electrodes separated by some distance.
These are enclosed in a glass tube (for visible) with quartz or fused
silica and xenon gas is filled under pressure.
An intense arc is formed between electrodes by applying high
voltage. This is a good source of continuous plus additional intense
radiation. Its intensity is higher than the hydrogen discharge lamp.
DEMERIT:
The lamp since operates at high voltage becomes very hot during
operation and hence needs thermal insulation.
In mercury arc lamp, mercury vapor is stored under high
pressure and excitation of mercury atoms is done by electric
discharge.
DEMERIT:
Not suitable for continuous spectral studies,(because it doesn’t
give continuous radiations).
71
The radiation emitted by the source is collimated (made
parallel) by lenses, mirrors and slits.
LENSES:
 Materials used for the lenses must be transparent to the
radiation being used.
 Ordinary silicate glass transmits between 350 to 3000 nm
and is suitable for visible and near IR region.
 Quartz or fused silica is used as a material for lenses to work
below 300nm.
72
MIRRORS
73
These are used to reflect, focus or collimate light beams in
spectrophotometer.
To minimize the light loss, mirrors are aluminized on their
front surfaces.
SLITS:
74
Slit is an important device in resolving polychromatic
radiation into monochromatic radiation.
To achieve this, entrance slit and exit slit are used.
The width of slit plays an important role in resolution of
polychromatic radiation.
It is a device used to isolate the radiation of the desired
wavelength from wavelength of the continuous spectra.
Following types of monochromatic devices are used.
1. Filters
2. Prisms
3. Gratings
75
Selection of filters is usually done on a compromise between
peak transmittance and band pass width; the former should be as
high as possible and latter as narrow as possible.
1. Absorption filters- works by selective absorption of unwanted
radiation and transmits the radiation which is required.
Examples- Glass and Gelatin filters.
76
Selection of absorption
the following procedure:
Draw a filter wheel.
filter is done according to
77
Write the color VIBGYOR in clockwise or anticlockwise
manner, omitting Indigo.
If solution to be analyzed is BLUE in color a filter having a
complimentary color ORANGE is used in the analysis.
78
Similarly, we can select the required filter in colorimeter, based
upon the color of the solution.
An Absorption glass filter is made of solid sheet of glass
that has been colored by pigments which Is dissolved or
dispersed in the glass.
79
The color in the glass filters are produced by
metal oxides like (V, Cr, Mn, Fe, Ni, Co, Cu etc.).
incorporating
Gelatin filter is an example of absorption filter prepared by
adding organic pigments; here instead of solid glass sheets thin
gelatin sheets are used. Gelatin filters are not use now days.
80
It tends to deteriorate with time and gets affected by the heat and
moisture. The color of the dye gets bleached.
MERITS:-
Simple in construction
Cheaper
Selection of the filter is easy
 DEMERITS:-
Less accurate
Band pass (bandwidth) is more (±20-30nm) i.e. if we have
to measure at 400nm; we get radiation from 370-430nm.
Hence less accurate results are obtained.
81
 Works on the interference phenomenon, causes rejection of
unwanted wavelength by selective reflection.
 It is constructed by using two parallel glass plates, which are
silvered internally and separated by thin film of dielectric
material of different (CaF2, SiO, MgF2) refractive index. These
filters have a band pass of 10-15nm with peak transmittance of
40-60%.
82
Merits -
 Provide greater transmittance and narrower band pass (10-
15nm) as compare to absorption filter.
 Inexpensive
 Additional filters can be used to cut off undesired wavelength.
83


 Prism is made from glass, Quartz or fused silica.
Quartz or fused silica is the choice of material of UV
spectrum.
When white light is passed through glass prism, dispersion
of polychromatic light in rainbow occurs. Now by rotation
of the prism different wavelengths of the spectrum can be
made to pass through in exit slit on the sample.
 The effective wavelength depends on the dispersive power
of prism material and the optical angle of the prism.
84
85
• There are two types of mounting in an instrument one is called
‘Cornu type’(refractive), which has an optical angle of 60o
and its adjusted such that on rotation the emerging light is
allowed to fall on exit slit.
• The other type is called “Littrow type”(reflective), which has
optical angle 30o and its one surface is aluminized with
reflected light back to pass through prism and to emerge on the
same side of the light source i.e. light doesn’t pass through the
prism on other side.
86
 Are most effective one in converting a polychromatic light to
monochromatic light. As a resolution of +/- 0.1nm could be
achieved by using gratings, they are commonly used in
spectrophotometers.
 Gratings are of two types.
1. Diffraction grating.
2. Transmission gratings.
87
 More refined dispersion of light is obtained by means of
diffraction gratings.
 These consist of large number of parallel lines ( grooves)
about 15000-30000/ inch is ruled on highly polished surface of
aluminum.
 these gratings are replica made from master gratings by
coating the original master grating with a epoxy resin and are
removed after setting
88
To make the surface reflective, a deposit of aluminum
is made on the surface. In order to minimize to
greater amounts of scattered radiation and
appearance of unwanted radiation of other spectral
orders, the gratings are blazed to concentrate the
radiation into a single order.
89
It is similar to diffraction grating but refraction takes
place instead of reflection. Refraction produces
reinforcement. this occurs when radiation transmitted
through grating reinforces with the partially refracted
radiation.
90
 Grating gives higher and linear dispersions compared to
prism monochromator.
like
 Can be used over wide wavelength ranges.
 Gratings can be constructed with materials
aluminium which is resistant to atmospheric moisture.
 Provide light of narrow wavelength.
 No loss of energy due to absorption.
91
Comparison Prism Grating
Made of Glass-: Visible
Quartz/fused silica-: UV
Alkali halide:- IR
Grooved on highly polished
surface like alumina.
Working Principle Angle of Incident Law of diffraction
nλ= d (sini±sinθ)
Merits/demerits  Prisms give non-liner
dispersion hence no
overlap of spectral order.
 It can’t be used over
consideration wavelength
ranges.
 Prisms are not sturdy and
long lasting.
 Grating gives liner dispersion
hence overlap of spectral
order.
 It can be used over
considerable wavelength
ranges.
 Grating are sturdy and long
lasting
92
 The cells or cuvettes are used for handling liquid samples.
 The cell may either be rectangular or cylindrical in nature.
 For study in UV region; the cells are prepared from quartz or
fused silica whereas color corrected fused glass is used for
visible region.
 The surfaces of absorption cells must be kept scrupulously
clean. No fingerprints or blotches should be present on cells.
 Cleaning is carried out washing with distilled water or with
dilute alcohol, acetone.
93
94
 Device which converts light energy into electrical signals, that
are displayed on readout devices.
 The transmitted radiation falls on the detector which
determines the intensity of radiation absorbed by sample
The following types of detectors are employed in instrumentation
of absorption spectrophotometer
1. Barrier layer cell/Photovoltaic cell
2. Phototubes/ Photo emissive tube
3. Photomultiplier tube
95
Requirements of an ideal detector:-
It should give quantitative response.
It should have high sensitivity and low noise level.
It should have a short response time.
It should provide signal or response quantitative to wide
spectrum of radiation received.
96
 The detector has a thin film metallic layer coated with silver or
gold and acts as an electrode.
 It also has a metal base plate which acts as another electrode.
 These two layers are separated by a semiconductor layer of
selenium.
97
 When light radiation falls on selenium layer, electrons become
mobile and are taken up by transparent metal layer.
 This creates a potential difference between two electrodes &
causes the flow of current.
 When it is connected to galvanometer, a flow of current
observed which is proportional to the intensity and wavelength
of light falling on it.
98
99
100
 Consists of a evacuated glass tube with a photocathode and a
collector anode.
 The surface of photocathode is coated with a layer of elements
like cesium, silver oxide or mixture of them.
 When radiant energy falls on photosensitive cathode, electrons
are emitted which are attracted to anode causing current to
flow.
 More sensitive compared to barrier layer cell and therefore
widely used.
101
The principle employed in this detector is that, multiplication
of photoelectrons by secondary emission of electrons.
In a vacuum tube, a primary photo-cathode is fixed which
receives radiation from the sample.
Some eight to ten dynodes are fixed each with increasing
potential of 75-100V higher than preceding one.
Near the last dynode is fixed an anode or electron collector
electrode.
Photo-multiplier is extremely sensitive to light and is best
suited where weaker or low radiation is received
102
103
 Depending upon the monochromators (filters or dispersing
device) used to isolate and transmit a narrow beam of radiant
energy from the incident light determines whether the
instrument is classified as Photometer or a Spectrophotometer.
 Spectrophotometers used here detects the percentage
transmittance of light radiation, when light of certain
intensity & frequency range is passed through the sample.
 Both can be a single beam or double beam optical system.
104
• Light from the source is carried through lens and/or through
aperture to pass through a suitable filter.
• The type of filter to be used is governed by the colour of the
solution.
• The sample solution to be analysed is placed in cuvettes.
105
106
After passing through the solution, the light strikes the surface
of detector (barrier-layer cell or phototube) and produces
electrical current.
The output of current is measured by the deflection of needle
of light-spot galvanometer or micro ammeter. This meter is
calibrated in terms of transmittance as well as optical density.
The readings of solution of both standard and unknown are
recorded in optical density units after adjusting instrument to a
reagent blank.
107
108
Double beam instrument is the one in which two beams are
formed in the space by a U shaped mirror called as beam
splitter or beam chopper .
Chopper is a device consisting of a circular disc. One third of
the disc is opaque and one third is transparent, remaining one
third is mirrored. It splits the monochromatic beam of light
into two beams of equal intensities.
109
110
111
Advantages of single & double
beam spectrophotometer
112
Single beam-
Simple in construction, Easy to use and economical
Double beam-
It facilitates rapid scanning over wide λ region.
Fluctuations due to radiation source are minimised.
It doesn’t require adjustment of the transmittance at 0% and
100% at each wavelength.
It gives ratio of intensities of sample & reference beams
simultaneously.
Single
beam
113
Any fluctuation in the intensity of radiation sources affects the
absorbance.
Continuous spectrum is not obtained.
Double beam
Construction is complicated.
Instrument is expensive.
SL.
NO
SINGLE BEAM
INSTRUMENT
DOUBLBEAM
INSTRUMENT
1. Calibration should be Calibration is done
done with blank every only in the beginning.
time, before measuring
the absorbance or
transmittance of sample
114
2 Radiant energy intensity
changes with fluctuation
of voltage.
It permits a large degree
of inherent
compensation for
fluctuations in the
intensity of the radiant
energy.
3 It measure the total
amount of transmitted
light reaching the detector
It measures the
percentage of light
absorbed by the sample.
115
4 In single beam it’s not
possible to compare blank
and sample together.
In double beam it’s
possible to do direct one
step comparison of sample
in one path with a standard
in the other path.
5 In single beam radiant
energy wavelength has to
be adjusted every time.
In this scanning can be
done over a wide
wavelength region
6 Working on single beam is
tedious and time
consuming.
Working on double beam is
fast and non tedious.
58
Instrumental Analysis, Skoog, Fifth edition, Page no.312-316
Instrumental methods of chemical analysis, Gurdeep R.
chatwal. Page no2.116-2.122
Elementary organic analysis, Principles and chemical
applications , Y R Shrama, page no12-14
A textbook of pharmaceutical analysis, kasturi A V
,Vol 310th
ed., 169-81
11
7
11
8
Light Source-
Function of temperature
Continuous radiation
Adequate intensity
stable
Visible:
Tungsten filament lamps
Tungsten halogen
Carbon arc
Uv:
Hydrogen-Deuterium discharge :two electrodes in a deuterium filled silica envelop
Xenon discharge
Mercuric arc
Monochromator- Filters:
Absorption filters.. complementary
Interference filters…glass plates .. Silvered internally… thin film of dielectric material..
Monochromaters
Prisms:
Refractive type
120
Instrumentation – Sample Handling
1. Virtually all UV spectra are recorded solution-phase
2. Cells can be made of plastic, glass or quartz
3. Only quartz is transparent in the full 200-700 nm range; plastic and glass
are only suitable for visible spectra
4. Concentration (we will cover shortly) is empirically determined
A typical sample cell (commonly called a cuvet):
121
5. Solvents must be transparent in the region to be observed; the
wavelength where a solvent is no longer transparent is referred to as the
cutoff
6. Since spectra are only obtained up to 200 nm, solvents typically only
need to lack conjugated p systems or carbonyls
Common solvents and cutoffs:
acetonitrile 190
chloroform 240
cyclohexane 195
1,4-dioxane 215
95% ethanol 205
n-hexane 201
methanol 205
isooctane 195
water 190
Detectors:
Barrier layer cell:
No power supply
Current proportional to light intensity
Metallic plate… layer selenium …conducting material layer…
Photo tubes
Evacuated tubes…photo catode … collector anode…
Photo multiplier tubes
Sensitive and expensive
Multiplication of initial photo electons
Several anodes with gradually increasing potential..
Never goes zero
Dark current
Absorbance
0.800
λ=430n
m
0.60
0
λ=570n
m
0.40
0
0.20
0
0.0
0 0.00
4.0
8.00 12.00 16.00
concentration 12
3
Absorbance
0.80
0
ε=1000 ε=1500
0.60
0 ε=1750
0.400
0.200
0.00 2.0 4.0 6.0 8.0 10.0
concentration
12
4
Absorb
ance
2.
0
0.0%
0.2
%
1
%
1.
0
5
%
0
2.
5
5.
0
7.
5
10
concentratio
n
12
5
1)Elementary organic spectroscopy,principles &
chemical applications,Y.R Sharma,Revised
edition,pg n.o 18,26,27
2) Pharmaceutical chemistry,Instrumental
techniques,vol 2,Leslie.G.chatten,pg n.o
21-24
3)Principles and practice of analytical
chemistry,F.W Fifield &D.kealey, 5th edition
,pg n.o 270-274
4)Pharmaceutical analysis,P.Parimoo,
pg n.o 147,151,152,165
5)Industrial methods of chemical
analysis,B.K Sharma,pg n.o 46-65,91-
12
6
6)Instrumental
analysis,Skoog,Holler,Crouch,
pg no.383,386
12
7
7)Practical pharmaceutical chemistry,4th
edition,partv 2, Beckett ,stenlake, pg n.o275-277
12
8
THANKYOU
…

More Related Content

Similar to Energy of Radiation and Electromagnetic Spectrum

Lec spectroscopy
Lec spectroscopyLec spectroscopy
Lec spectroscopyZainab&Sons
 
UV Visible spectroscopy, introduction, principles, applications
UV Visible spectroscopy, introduction, principles, applicationsUV Visible spectroscopy, introduction, principles, applications
UV Visible spectroscopy, introduction, principles, applicationsnivedithag131
 
Chapter 8-Spectroscopy.pptx
Chapter 8-Spectroscopy.pptxChapter 8-Spectroscopy.pptx
Chapter 8-Spectroscopy.pptxAkshatGoel35
 
Uv visible spectroscopy absorption methods (2)
Uv visible spectroscopy absorption methods (2)Uv visible spectroscopy absorption methods (2)
Uv visible spectroscopy absorption methods (2)Geeta Prasad Kashyap
 
Uvvisiblespectroscopy 130121115849-phpapp02
Uvvisiblespectroscopy 130121115849-phpapp02Uvvisiblespectroscopy 130121115849-phpapp02
Uvvisiblespectroscopy 130121115849-phpapp02gufy ssah
 
uvvisiblespectroscopy-130121115849-phpapp02.pptx
uvvisiblespectroscopy-130121115849-phpapp02.pptxuvvisiblespectroscopy-130121115849-phpapp02.pptx
uvvisiblespectroscopy-130121115849-phpapp02.pptxTridevSastri1
 
spectroscpy slides sidra
spectroscpy slides sidraspectroscpy slides sidra
spectroscpy slides sidraDr Sidra Khalid
 
UV-Visible Spectroscopy
UV-Visible SpectroscopyUV-Visible Spectroscopy
UV-Visible SpectroscopySudha Reddy
 
Uv vis spectroscopy for ktu students
Uv vis spectroscopy for ktu studentsUv vis spectroscopy for ktu students
Uv vis spectroscopy for ktu studentsSiju N Antony
 
Ultraviolet and visible spectrophotometer and Its application in pharmaceutic...
Ultraviolet and visible spectrophotometer and Its application in pharmaceutic...Ultraviolet and visible spectrophotometer and Its application in pharmaceutic...
Ultraviolet and visible spectrophotometer and Its application in pharmaceutic...nikhil kadam
 
Uv visible spectroscopy
Uv visible spectroscopyUv visible spectroscopy
Uv visible spectroscopyNilesh Thakare
 
UV Visible Spectroscopy
UV Visible SpectroscopyUV Visible Spectroscopy
UV Visible SpectroscopySimranDhiman12
 
Uv visible spectroscopy with Instrumentation
Uv visible spectroscopy with InstrumentationUv visible spectroscopy with Instrumentation
Uv visible spectroscopy with InstrumentationSHIVANEE VYAS
 

Similar to Energy of Radiation and Electromagnetic Spectrum (20)

UV Visible spectroscopy
UV Visible spectroscopyUV Visible spectroscopy
UV Visible spectroscopy
 
Uv visible
Uv visibleUv visible
Uv visible
 
Lec spectroscopy
Lec spectroscopyLec spectroscopy
Lec spectroscopy
 
Uv visible
Uv visibleUv visible
Uv visible
 
UV Visible spectroscopy, introduction, principles, applications
UV Visible spectroscopy, introduction, principles, applicationsUV Visible spectroscopy, introduction, principles, applications
UV Visible spectroscopy, introduction, principles, applications
 
Chapter 8-Spectroscopy.pptx
Chapter 8-Spectroscopy.pptxChapter 8-Spectroscopy.pptx
Chapter 8-Spectroscopy.pptx
 
Uv visible spectroscopy absorption methods (2)
Uv visible spectroscopy absorption methods (2)Uv visible spectroscopy absorption methods (2)
Uv visible spectroscopy absorption methods (2)
 
Uvvisiblespectroscopy 130121115849-phpapp02
Uvvisiblespectroscopy 130121115849-phpapp02Uvvisiblespectroscopy 130121115849-phpapp02
Uvvisiblespectroscopy 130121115849-phpapp02
 
Uv absorption spectroscopy
Uv absorption spectroscopyUv absorption spectroscopy
Uv absorption spectroscopy
 
uvvisiblespectroscopy-130121115849-phpapp02.pptx
uvvisiblespectroscopy-130121115849-phpapp02.pptxuvvisiblespectroscopy-130121115849-phpapp02.pptx
uvvisiblespectroscopy-130121115849-phpapp02.pptx
 
spectroscpy slides sidra
spectroscpy slides sidraspectroscpy slides sidra
spectroscpy slides sidra
 
Ultravoilet spectroscopy
Ultravoilet spectroscopyUltravoilet spectroscopy
Ultravoilet spectroscopy
 
Ultravoilet spectroscopy
Ultravoilet spectroscopyUltravoilet spectroscopy
Ultravoilet spectroscopy
 
UV-Visible Spectroscopy
UV-Visible SpectroscopyUV-Visible Spectroscopy
UV-Visible Spectroscopy
 
Uv vis spectroscopy for ktu students
Uv vis spectroscopy for ktu studentsUv vis spectroscopy for ktu students
Uv vis spectroscopy for ktu students
 
Ultraviolet and visible spectrophotometer and Its application in pharmaceutic...
Ultraviolet and visible spectrophotometer and Its application in pharmaceutic...Ultraviolet and visible spectrophotometer and Its application in pharmaceutic...
Ultraviolet and visible spectrophotometer and Its application in pharmaceutic...
 
Uv visible spectroscopy
Uv visible spectroscopyUv visible spectroscopy
Uv visible spectroscopy
 
Spectroscopy of uv visible
Spectroscopy of uv visibleSpectroscopy of uv visible
Spectroscopy of uv visible
 
UV Visible Spectroscopy
UV Visible SpectroscopyUV Visible Spectroscopy
UV Visible Spectroscopy
 
Uv visible spectroscopy with Instrumentation
Uv visible spectroscopy with InstrumentationUv visible spectroscopy with Instrumentation
Uv visible spectroscopy with Instrumentation
 

More from Ragisha Thomas

DISTRIBUTION OUTLINE.pptx
DISTRIBUTION OUTLINE.pptxDISTRIBUTION OUTLINE.pptx
DISTRIBUTION OUTLINE.pptxRagisha Thomas
 
3-Total-Quality-Management.pptx
3-Total-Quality-Management.pptx3-Total-Quality-Management.pptx
3-Total-Quality-Management.pptxRagisha Thomas
 
drugmetabolism-200501102249.pdf
drugmetabolism-200501102249.pdfdrugmetabolism-200501102249.pdf
drugmetabolism-200501102249.pdfRagisha Thomas
 
chemical Anlyasis.pptx
chemical Anlyasis.pptxchemical Anlyasis.pptx
chemical Anlyasis.pptxRagisha Thomas
 
lecture_4_flame_photometry_ (1).pptx
lecture_4_flame_photometry_ (1).pptxlecture_4_flame_photometry_ (1).pptx
lecture_4_flame_photometry_ (1).pptxRagisha Thomas
 

More from Ragisha Thomas (10)

DISTRIBUTION OUTLINE.pptx
DISTRIBUTION OUTLINE.pptxDISTRIBUTION OUTLINE.pptx
DISTRIBUTION OUTLINE.pptx
 
3-Total-Quality-Management.pptx
3-Total-Quality-Management.pptx3-Total-Quality-Management.pptx
3-Total-Quality-Management.pptx
 
drugmetabolism-200501102249.pdf
drugmetabolism-200501102249.pdfdrugmetabolism-200501102249.pdf
drugmetabolism-200501102249.pdf
 
chemical Anlyasis.pptx
chemical Anlyasis.pptxchemical Anlyasis.pptx
chemical Anlyasis.pptx
 
PPT.pptx
PPT.pptxPPT.pptx
PPT.pptx
 
hplc.pptx
hplc.pptxhplc.pptx
hplc.pptx
 
lecture_4_flame_photometry_ (1).pptx
lecture_4_flame_photometry_ (1).pptxlecture_4_flame_photometry_ (1).pptx
lecture_4_flame_photometry_ (1).pptx
 
flame emission pptx
flame emission pptxflame emission pptx
flame emission pptx
 
AASPresentation.ppt
AASPresentation.pptAASPresentation.ppt
AASPresentation.ppt
 
ELECTROPHORESIS.pptx
ELECTROPHORESIS.pptxELECTROPHORESIS.pptx
ELECTROPHORESIS.pptx
 

Recently uploaded

Unlocking the Potential: Deep dive into ocean of Ceramic Magnets.pptx
Unlocking  the Potential: Deep dive into ocean of Ceramic Magnets.pptxUnlocking  the Potential: Deep dive into ocean of Ceramic Magnets.pptx
Unlocking the Potential: Deep dive into ocean of Ceramic Magnets.pptxanandsmhk
 
Recombinant DNA technology (Immunological screening)
Recombinant DNA technology (Immunological screening)Recombinant DNA technology (Immunological screening)
Recombinant DNA technology (Immunological screening)PraveenaKalaiselvan1
 
Scheme-of-Work-Science-Stage-4 cambridge science.docx
Scheme-of-Work-Science-Stage-4 cambridge science.docxScheme-of-Work-Science-Stage-4 cambridge science.docx
Scheme-of-Work-Science-Stage-4 cambridge science.docxyaramohamed343013
 
Boyles law module in the grade 10 science
Boyles law module in the grade 10 scienceBoyles law module in the grade 10 science
Boyles law module in the grade 10 sciencefloriejanemacaya1
 
Nanoparticles synthesis and characterization​ ​
Nanoparticles synthesis and characterization​  ​Nanoparticles synthesis and characterization​  ​
Nanoparticles synthesis and characterization​ ​kaibalyasahoo82800
 
Call Girls in Munirka Delhi 💯Call Us 🔝8264348440🔝
Call Girls in Munirka Delhi 💯Call Us 🔝8264348440🔝Call Girls in Munirka Delhi 💯Call Us 🔝8264348440🔝
Call Girls in Munirka Delhi 💯Call Us 🔝8264348440🔝soniya singh
 
Disentangling the origin of chemical differences using GHOST
Disentangling the origin of chemical differences using GHOSTDisentangling the origin of chemical differences using GHOST
Disentangling the origin of chemical differences using GHOSTSérgio Sacani
 
G9 Science Q4- Week 1-2 Projectile Motion.ppt
G9 Science Q4- Week 1-2 Projectile Motion.pptG9 Science Q4- Week 1-2 Projectile Motion.ppt
G9 Science Q4- Week 1-2 Projectile Motion.pptMAESTRELLAMesa2
 
Labelling Requirements and Label Claims for Dietary Supplements and Recommend...
Labelling Requirements and Label Claims for Dietary Supplements and Recommend...Labelling Requirements and Label Claims for Dietary Supplements and Recommend...
Labelling Requirements and Label Claims for Dietary Supplements and Recommend...Lokesh Kothari
 
Stunning ➥8448380779▻ Call Girls In Panchshil Enclave Delhi NCR
Stunning ➥8448380779▻ Call Girls In Panchshil Enclave Delhi NCRStunning ➥8448380779▻ Call Girls In Panchshil Enclave Delhi NCR
Stunning ➥8448380779▻ Call Girls In Panchshil Enclave Delhi NCRDelhi Call girls
 
A relative description on Sonoporation.pdf
A relative description on Sonoporation.pdfA relative description on Sonoporation.pdf
A relative description on Sonoporation.pdfnehabiju2046
 
Call Girls in Munirka Delhi 💯Call Us 🔝9953322196🔝 💯Escort.
Call Girls in Munirka Delhi 💯Call Us 🔝9953322196🔝 💯Escort.Call Girls in Munirka Delhi 💯Call Us 🔝9953322196🔝 💯Escort.
Call Girls in Munirka Delhi 💯Call Us 🔝9953322196🔝 💯Escort.aasikanpl
 
NAVSEA PEO USC - Unmanned & Small Combatants 26Oct23.pdf
NAVSEA PEO USC - Unmanned & Small Combatants 26Oct23.pdfNAVSEA PEO USC - Unmanned & Small Combatants 26Oct23.pdf
NAVSEA PEO USC - Unmanned & Small Combatants 26Oct23.pdfWadeK3
 
Bentham & Hooker's Classification. along with the merits and demerits of the ...
Bentham & Hooker's Classification. along with the merits and demerits of the ...Bentham & Hooker's Classification. along with the merits and demerits of the ...
Bentham & Hooker's Classification. along with the merits and demerits of the ...Nistarini College, Purulia (W.B) India
 
Animal Communication- Auditory and Visual.pptx
Animal Communication- Auditory and Visual.pptxAnimal Communication- Auditory and Visual.pptx
Animal Communication- Auditory and Visual.pptxUmerFayaz5
 
Work, Energy and Power for class 10 ICSE Physics
Work, Energy and Power for class 10 ICSE PhysicsWork, Energy and Power for class 10 ICSE Physics
Work, Energy and Power for class 10 ICSE Physicsvishikhakeshava1
 
Analytical Profile of Coleus Forskohlii | Forskolin .pdf
Analytical Profile of Coleus Forskohlii | Forskolin .pdfAnalytical Profile of Coleus Forskohlii | Forskolin .pdf
Analytical Profile of Coleus Forskohlii | Forskolin .pdfSwapnil Therkar
 
Call Us ≽ 9953322196 ≼ Call Girls In Mukherjee Nagar(Delhi) |
Call Us ≽ 9953322196 ≼ Call Girls In Mukherjee Nagar(Delhi) |Call Us ≽ 9953322196 ≼ Call Girls In Mukherjee Nagar(Delhi) |
Call Us ≽ 9953322196 ≼ Call Girls In Mukherjee Nagar(Delhi) |aasikanpl
 
SOLUBLE PATTERN RECOGNITION RECEPTORS.pptx
SOLUBLE PATTERN RECOGNITION RECEPTORS.pptxSOLUBLE PATTERN RECOGNITION RECEPTORS.pptx
SOLUBLE PATTERN RECOGNITION RECEPTORS.pptxkessiyaTpeter
 

Recently uploaded (20)

Unlocking the Potential: Deep dive into ocean of Ceramic Magnets.pptx
Unlocking  the Potential: Deep dive into ocean of Ceramic Magnets.pptxUnlocking  the Potential: Deep dive into ocean of Ceramic Magnets.pptx
Unlocking the Potential: Deep dive into ocean of Ceramic Magnets.pptx
 
Recombinant DNA technology (Immunological screening)
Recombinant DNA technology (Immunological screening)Recombinant DNA technology (Immunological screening)
Recombinant DNA technology (Immunological screening)
 
Scheme-of-Work-Science-Stage-4 cambridge science.docx
Scheme-of-Work-Science-Stage-4 cambridge science.docxScheme-of-Work-Science-Stage-4 cambridge science.docx
Scheme-of-Work-Science-Stage-4 cambridge science.docx
 
Boyles law module in the grade 10 science
Boyles law module in the grade 10 scienceBoyles law module in the grade 10 science
Boyles law module in the grade 10 science
 
Nanoparticles synthesis and characterization​ ​
Nanoparticles synthesis and characterization​  ​Nanoparticles synthesis and characterization​  ​
Nanoparticles synthesis and characterization​ ​
 
Call Girls in Munirka Delhi 💯Call Us 🔝8264348440🔝
Call Girls in Munirka Delhi 💯Call Us 🔝8264348440🔝Call Girls in Munirka Delhi 💯Call Us 🔝8264348440🔝
Call Girls in Munirka Delhi 💯Call Us 🔝8264348440🔝
 
Disentangling the origin of chemical differences using GHOST
Disentangling the origin of chemical differences using GHOSTDisentangling the origin of chemical differences using GHOST
Disentangling the origin of chemical differences using GHOST
 
G9 Science Q4- Week 1-2 Projectile Motion.ppt
G9 Science Q4- Week 1-2 Projectile Motion.pptG9 Science Q4- Week 1-2 Projectile Motion.ppt
G9 Science Q4- Week 1-2 Projectile Motion.ppt
 
Labelling Requirements and Label Claims for Dietary Supplements and Recommend...
Labelling Requirements and Label Claims for Dietary Supplements and Recommend...Labelling Requirements and Label Claims for Dietary Supplements and Recommend...
Labelling Requirements and Label Claims for Dietary Supplements and Recommend...
 
Stunning ➥8448380779▻ Call Girls In Panchshil Enclave Delhi NCR
Stunning ➥8448380779▻ Call Girls In Panchshil Enclave Delhi NCRStunning ➥8448380779▻ Call Girls In Panchshil Enclave Delhi NCR
Stunning ➥8448380779▻ Call Girls In Panchshil Enclave Delhi NCR
 
A relative description on Sonoporation.pdf
A relative description on Sonoporation.pdfA relative description on Sonoporation.pdf
A relative description on Sonoporation.pdf
 
Call Girls in Munirka Delhi 💯Call Us 🔝9953322196🔝 💯Escort.
Call Girls in Munirka Delhi 💯Call Us 🔝9953322196🔝 💯Escort.Call Girls in Munirka Delhi 💯Call Us 🔝9953322196🔝 💯Escort.
Call Girls in Munirka Delhi 💯Call Us 🔝9953322196🔝 💯Escort.
 
NAVSEA PEO USC - Unmanned & Small Combatants 26Oct23.pdf
NAVSEA PEO USC - Unmanned & Small Combatants 26Oct23.pdfNAVSEA PEO USC - Unmanned & Small Combatants 26Oct23.pdf
NAVSEA PEO USC - Unmanned & Small Combatants 26Oct23.pdf
 
Bentham & Hooker's Classification. along with the merits and demerits of the ...
Bentham & Hooker's Classification. along with the merits and demerits of the ...Bentham & Hooker's Classification. along with the merits and demerits of the ...
Bentham & Hooker's Classification. along with the merits and demerits of the ...
 
Animal Communication- Auditory and Visual.pptx
Animal Communication- Auditory and Visual.pptxAnimal Communication- Auditory and Visual.pptx
Animal Communication- Auditory and Visual.pptx
 
Work, Energy and Power for class 10 ICSE Physics
Work, Energy and Power for class 10 ICSE PhysicsWork, Energy and Power for class 10 ICSE Physics
Work, Energy and Power for class 10 ICSE Physics
 
Analytical Profile of Coleus Forskohlii | Forskolin .pdf
Analytical Profile of Coleus Forskohlii | Forskolin .pdfAnalytical Profile of Coleus Forskohlii | Forskolin .pdf
Analytical Profile of Coleus Forskohlii | Forskolin .pdf
 
Call Us ≽ 9953322196 ≼ Call Girls In Mukherjee Nagar(Delhi) |
Call Us ≽ 9953322196 ≼ Call Girls In Mukherjee Nagar(Delhi) |Call Us ≽ 9953322196 ≼ Call Girls In Mukherjee Nagar(Delhi) |
Call Us ≽ 9953322196 ≼ Call Girls In Mukherjee Nagar(Delhi) |
 
SOLUBLE PATTERN RECOGNITION RECEPTORS.pptx
SOLUBLE PATTERN RECOGNITION RECEPTORS.pptxSOLUBLE PATTERN RECOGNITION RECEPTORS.pptx
SOLUBLE PATTERN RECOGNITION RECEPTORS.pptx
 
9953056974 Young Call Girls In Mahavir enclave Indian Quality Escort service
9953056974 Young Call Girls In Mahavir enclave Indian Quality Escort service9953056974 Young Call Girls In Mahavir enclave Indian Quality Escort service
9953056974 Young Call Girls In Mahavir enclave Indian Quality Escort service
 

Energy of Radiation and Electromagnetic Spectrum

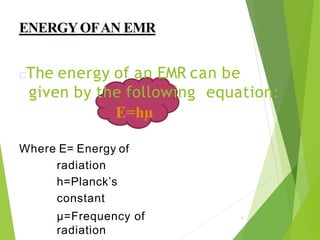
  • 1. Where E= Energy of radiation h=Planck’s constant µ=Frequency of radiation The energy of an EMR can be given by the following equation: E=hµ 1
  • 2. Frequency(µ)= c/ λ Where c=velocity of light in vacuum λ= wavelength 2 :-Hence, E=hµ E=hc/λ Therefore,energy of a radiation depends upon frequency and wavelength of radiation.
  • 3. The arrangement obtained by arranging various types of electromagnetic waves or radiations in order of their increasing wavelegth or decreasing frequencies is called electromagnetic spectrum. The electromagnetic spectrum is divided into a number of regions; these are artificial divisions in the sense that they have been defined solely as a result of differences in the instrumentation required for producing and detecting radiation of a given frequency range. 3
  • 4. Electromagnetic Radiation  Electromagnetic radiation consist of discrete packages  of energy which are called as photons.  Frequency (ν): ◦ It is defined as the number of times electrical field radiation oscillates in one second. ◦ The unit for frequency is Hertz (Hz). 1 Hz = 1 cycle per second  Wavelength (λ): ◦ It is the distance between two nearest parts of the wave in the same phase i.e. distance between two nearest crest or troughs.
  • 5. The relationship between wavelength & frequency can be written as: c = ν λ As photon is subjected to energy, so E = h ν = h c / λ
  • 6. 6
  • 7.  Gamma Ray Region:0.02-1 A  X- rays:1 -10A  UV-Visible: Vaccum-1-180 uv-180-400 Visible 400-800nm IR: IR Near: 0.7-2.5 Micron IR :2.5 -15 Micron far IR-15-200 Micron Microwave:0.1mm-1 cm Radio waves:10m-1cm
  • 8. Types of energies  Translational  Rotational  Vibrational  Electronic
  • 9. E₁-Eₒ= h𝜗 Etotal = Eelectronic + Evibrational + Erotational The energies decreases in the following order: Electronic ⪢ Vibrational ⪢ Rotational
  • 11. Spectroscopy is the measurement and interpretation of electromagnetic radiation absorbed or emitted when the molecules or atoms or ions of a sample moves from one energy state to another energy state SPECTROSCOPY 11
  • 12. 1)Atomic spectroscopy :Here,the changes in energy takes place at atomic level. Eg: Atomic absorption spectroscopy, Flame photometry 2)Molecular spectroscopy:Here,the changes in energy takes place at molecular level. Eg: UVspectroscopy,colorimetry,infra red spectroscopy 12
  • 13. Absorption spectrophotometry can be defined as the measurement of absorption of radiant energy by various substances. It involves the measurement of absorptive capacity for radiant energy in the visible,UV and IR regions of the spectrum. 13
  • 14. o λ- 400-800nm o Coloured substance absorbs light of different λ in different manner and hence get an absorption curve o The λ at which maximum absorption takes place is called as λmax o λmax is characteristic for every coloured substance 14
  • 15.  On plotting a graph of concentration v/s absorbance,we get a calibration curve that is useful in determining the concentration or amount of a drug substance in the given sample solution.
  • 16. 16
  • 17. UV spectroscopy is concerned with the study of absorption 17 of uv radiation which ranges from 200-400nm. Valence electrons absorb the energy thereby molecules undergoes transition from ground state to excited state. This absorption is characteristic and depends on the nature of electrons present. :
  • 18. 18 UV Spectroscopy Observed electronic transitions From the molecular orbital diagram, there are several possible electronic transitions that can occur, each of a different relative energy: Energy s* p s p* n s s p n n s* p* p* s* p* alkanes carbonyls unsaturated cmpds. O, N, S, halogens carbonyls
  • 19.  1- σ → σ* transition  2- π → π* transition  3- n → σ* transition  4- n → π* transition Electronic Transition
  • 20. 20
  • 21. σ electron from orbital is excited to corresponding anti-bonding orbital σ*. The energy required is large for this transition. The organic compounds in which all the valence shell electrons are involved in the formation of σ bond do not show absorption in normal uv region (200-400nm) This transition is observed with saturated compounds. 1) σ-σ* 21
  • 22. Eg: Methane(CH₄) has C-H bond only and can undergo σ- σ* transition and shows absorption maxima at 122nm. The usual spectroscopic technique cannot be used below 200 nm. To study this high energy transition,the entire region should be evacuated (Vacuum uv region) Here,the excitation ocuurs with net retention of electronic spin This region is less informative 22
  • 23.  π electron in a bonding orbital is excited to corresponding anti-bonding orbital π*.  Energy required is less when compared to n-σ* Compounds containing multiple bonds like alkenes,alkynes,carbonyls,nitriles,arom atic compounds etc undergo π-π* transition. Eg:Alkenes generally absorb in the region 170- 205nm. 2) π-π* 23
  • 24. Absorption usually occurs in the ordinary uv spectrophotometer Absorption bands in unconjugated alkenes (170- 190nm) Absorption bands in carbonyls (180 nm) Introduction of alkyl group in olefinic linkage produces bathochromic shift 24
  • 25. Saturated compounds containing one hetero atom with unshared pair of electrons(n) like O,N,S and halogens are capable of n-σ* transition. These transition require less energy than σ-σ* transition. In saturated alkyl halides, the energy required for transition decrease with increase in the size of halogen atom (or decrease in electronegativity) 3) n-σ* 25
  • 26.  Eg:Methyl chloride has a λmax of 173nm. Methyl iodide has a λmax of 258nm.  This type of transition is very sensitive to hydrogen bonding Eg: Alcohol &amines  Hydrogen bonding shift the uv absorptions to shorter wavelength. 26
  • 27. An electron from non-bonding orbital is promoted to anti-bonding π*orbital. Compounds containing double bonds involving hetero atoms(C=O,N=O) undergo such type of transitions. This transition require minimum energy out of all transitions and shows absorption band at longer wavelength around 300nm. Eg:Saturated aldehydes shows both type of transitions (n-π*, π-π*) at {low energy and high energy} around 290 and 180 nm. 4) n-π* 27
  • 28. ~ 115 nm ~ 200 – 400 nm ~ 150-250 nm ~ 400 - 700 nm n- π* ˂ π -π* ˂ n- σ* ˂ σ ⇾ σ*
  • 29. TERMS USED IN UV- VISIBLE SPECTROSCOPY 29
  • 30.  Chromophore is defined as the nucleus or any isolated covalently bonded group responsible for the absorptionof light radiation.  Any group which exhibits absorption of electromagnetic radiations in the visible or ultraviolet region. C=C , C=O ,NO2 etc  Some of the important chromophores arecarbonyls,acids,esters,nitrile,ethylenic groups. 30
  • 31. 31
  • 32.  These are co-ordinatively saturated or un- saturated groups which themselves do not absorb radiations,but when present alongwith a chromophore enhances the absorbing properties of chromophore.  Also known as colour enhancing group.  All auxochromes have one or more non- bonding pair of electrons. -NH2 ,-OH ,-OR,-COOH etc  It extend the conjugation of a chromophore by sharing the non-bonding electrons. 2 9
  • 33. 33
  • 35. When the absorption maxima(λmax)of a compound shifts to longer wavelength,it is known as bathochromic shift or red shift. The effect is due to the presence of auxochrome by change of solvent. Eg: The n-π* transition for carbonyl compounds experiencesbathochromic shift when the polarityof solvent is decreased. 1) Bathochromic shift(red shift) 35
  • 36. When the absorption maxima (λmax) of a compound shifts to a shorter wavelength,it is known as hypsochromic shift or blue shift. The effect is due to the presence of a group causes removal of conjugation or by change of solvent. 2) Hypsochromic shift(blue shift) 36
  • 37. Eg : Aniline shows blue shift in acidic medium since it loses conjugation.Aniline(280nm) &Anilinium ion (- 203nm). 37
  • 41.  The spectrum consist of sharp peaks and each peak will correspond to the promotion of electron from one electronic level to another.  During promotion,the electron moves from a given vibrational and rotational level within one electronic mode to the other within the next electronic mode.  Thus,there will be a large no of possible transitions  Hence,not just one but a large no. of wavelengths which are close enough will be absorbed resulting in the formation of bands 3 9
  • 42. 1) K Band 42 K-Bands originate due to π-π* transition from a compound containing a conjugated system Such type of bands arise in compounds like dienes,polyenes and enones etc. Compound Transition λmax(nm) εmax Acetophenon e π-π* 240 13,000 1,3-butadiene π-π* 217 21,000
  • 43. R-Band transition originate due to n-π* transition of a single chromophoric group and having atleast one lone pair of electrons on the hetero atom These are less intense with εmax value below 100 Compound Transition λmax(nm) εmax Acetone n-π* 270 15 Acetaldehyd e n-π* 293 12 43
  • 44. Such type of bands arise due to π-π* transition in aromatic or hetero-aromatic molecules. Benzene shows absorption peaks between 230- 270nm.when a chromophoric group is attached to the benzene ring ,the B-Bands are observed at longer wavelengths than the more intense K-Bands. Compound Transition λmax(nm) εmax Benzene π-π* 255 215 Phenol π- π* 270 1450 44
  • 45. E-Band originate due to the electronic transitions in the benzenoid systems of three ethylenic bonds which are in closed cyclic conjugation. These are further characterized as E1and E2 bands E1 band which appear at shorter wavelength is usually more intense than the E2 band for the same compound which appears at longer wavelength. Compound E1 Band E1 Band E2 Band E2 Band λmax(nm) εmax λmax(nm) εmax Benzene 184 50,000 204 79,000 Napthalene 221 133,000 286 9,300 45
  • 46. 46
  • 47. BEER’S LAW According to this law,when a beam of monochromatic radiation is passed through a solution of absorbing species,the intensity of beam of monochromatic light decreases exponentially with increase in concentration of absorbing species LAMBERT’S LAW -dI/dc α I Lambert’s law states that the rate of decrease of intensity of monochromatic light with the thickness of the medium is directly proportional to the intensity of incident light. -dI/dt α I 47
  • 48. I₀ is the radiation coming in I is the radiation coming out
  • 49. -dI α I dc -dI =KI dc -dI =Kdc dc -lnI=kc+b-----------1 On integration ,b is constant of integration When concentration is 0 ,no absorbance hence I=l0 Sustituting in equation 1 -lnI0=b substituting the value of b in eq 1 -lnI=kc-lnI0 lnI0-lnI=kc ln I0 =kc (since log A –logB = log A) I B
  • 50. I0 /I = ekc (removing natural logarithm) I /I0 =e-kc (making inverse on both sides) I=I0e-kc -------------------2 Lambert’s law -dI/dt α I Equation can be simplified like equation 1 Thus we get I=I0e-kt-----------------------3 Equation 2 and 3 can be combined to get I=I0e-kct I/I0=10-kct(converting natural logarithm to base 10) I0/I=10kct Log I0/I=Kct(taking log on both sides)----------------4 Transmittance (T)=I/I0 and absorbance(A)=log1/T Hence A=log 1/I/I0 A=log I0/I----------------5
  • 51. ɛ =E 1% x molecular weight 1cm 10 E1% means the absorbance of 1% w/v Solution 1cm using a path length of 1cm
  • 52. 52
  • 53. 53
  • 54.  Real Deviation  Spectral deviation  Chemical deviations
  • 56. Spectral Deviation  Stray radiation  improper slit width  Fluctuation s in single beam
  • 57. . 3.CHEMICAL DEVIATIONS: Association of molecules This can be explained by taking the examples of methylene blue at small concentration(10‾⁵ molar) and at concentration above 10‾⁵molar. 57
  • 58.  Dissociation of molecules This can be explained by the fact that dichromate ions posses their maximum absorbance at 450nm which is orange in colour .But upon dilution,it will be dissociated to chromate ions having maximum absorbance at 410nm which is yellow in colour. This law is not valid in case if the absorbing material is coagulated into a small number of large units. This law shows deviation if the absorbing material at the required wavelength contains presence of impurities. 58
  • 59. Incomplete reaction  Sufficient time  Instability of colour Eg determination of iron with thioglycollic acid
  • 61. Absorption spectrophotometry in the ultraviolet and visible region is considered to be one of the oldest physical method for quantitative analysis and structural elucidation. Wavelength • UV- 200-400nm • VISIBLE- 400-800nm 61
  • 62. PHOTOMETER SPECTOPHOTOMETER COLORIMETER  PHOTOMETER: An instrument for measuring the intensity of light or the relative intensity of a pair of lights. Also called an illuminometer. It utilizes filter to isolate a narrow wavelength region. 62
  • 63.  SPECTOPHOTOMETER: An instrument measures the ratio, or a function of the two, of the radiant power of two EM beams over a large wavelength region. It utilizes dispersing element (Prisms/Gratings) instead of filters, to scan large wavelength region. 63  COLORIMETER: An instrument which is used for measuring absorption in the visible region is generally called colorimeter.
  • 64. source of radiant energy. Collimating system. monochromator system. sample holder or container to hold sample. detector system of collecting transmitted radiation. suitable amplifier or readout device. 64
  • 65. 65
  • 66. REQUIREMENTS OF AN IDEALSOURCE  It should be stable and should not allow fluctuations.  It should emit light of continuous spectrum of high and uniform intensity over the entire wavelength region in which it’s used.  It should provide incident light of sufficient intensity for the transmitted energy to be detected at the end of optic path.  It should not show fatigue on continued use. 66
  • 67. TUNGSTEN HALOGEN LAMP 67 Its construction is similar to a house hold lamp. The bulb contains a filament of Tungsten fixed in evacuated condition and then filled with inert gas. The filament can be heated up to 3000 k, beyond this Tungsten starts sublimating. It is used when polychromatic light is required. To prevent this along with inert gas some amount of halogen is introduced (usually Iodine).
  • 68.  Sublimated form of tungsten reacts with Iodine to form Tungsten –Iodine complex.  Which migrates back to the hot filament where it decomposes and Tungsten get deposited.  DEMERIT:  It emits the major portion of its radiant energy in near IR region of the spectrum. 68
  • 69. HYDROGEN DISCHARGE LAMP: In Hydrogen discharge lamp pair of electrodes is enclosed in a glass tube (provided with silica or quartz window for UV radiation to pass trough) filled with hydrogen gas. When current is passed trough these electrodes maintained at high voltage, discharge of electrons occurs which excites hydrogen molecules which in turn cause emission of UV radiations in near UV region. They are stable and robust. 69
  • 70. XENON DISCHARGE LAMP: 70 It possesses two tungsten electrodes separated by some distance. These are enclosed in a glass tube (for visible) with quartz or fused silica and xenon gas is filled under pressure. An intense arc is formed between electrodes by applying high voltage. This is a good source of continuous plus additional intense radiation. Its intensity is higher than the hydrogen discharge lamp. DEMERIT: The lamp since operates at high voltage becomes very hot during operation and hence needs thermal insulation.
  • 71. In mercury arc lamp, mercury vapor is stored under high pressure and excitation of mercury atoms is done by electric discharge. DEMERIT: Not suitable for continuous spectral studies,(because it doesn’t give continuous radiations). 71
  • 72. The radiation emitted by the source is collimated (made parallel) by lenses, mirrors and slits. LENSES:  Materials used for the lenses must be transparent to the radiation being used.  Ordinary silicate glass transmits between 350 to 3000 nm and is suitable for visible and near IR region.  Quartz or fused silica is used as a material for lenses to work below 300nm. 72
  • 73. MIRRORS 73 These are used to reflect, focus or collimate light beams in spectrophotometer. To minimize the light loss, mirrors are aluminized on their front surfaces.
  • 74. SLITS: 74 Slit is an important device in resolving polychromatic radiation into monochromatic radiation. To achieve this, entrance slit and exit slit are used. The width of slit plays an important role in resolution of polychromatic radiation.
  • 75. It is a device used to isolate the radiation of the desired wavelength from wavelength of the continuous spectra. Following types of monochromatic devices are used. 1. Filters 2. Prisms 3. Gratings 75
  • 76. Selection of filters is usually done on a compromise between peak transmittance and band pass width; the former should be as high as possible and latter as narrow as possible. 1. Absorption filters- works by selective absorption of unwanted radiation and transmits the radiation which is required. Examples- Glass and Gelatin filters. 76
  • 77. Selection of absorption the following procedure: Draw a filter wheel. filter is done according to 77 Write the color VIBGYOR in clockwise or anticlockwise manner, omitting Indigo.
  • 78. If solution to be analyzed is BLUE in color a filter having a complimentary color ORANGE is used in the analysis. 78 Similarly, we can select the required filter in colorimeter, based upon the color of the solution.
  • 79. An Absorption glass filter is made of solid sheet of glass that has been colored by pigments which Is dissolved or dispersed in the glass. 79 The color in the glass filters are produced by metal oxides like (V, Cr, Mn, Fe, Ni, Co, Cu etc.). incorporating
  • 80. Gelatin filter is an example of absorption filter prepared by adding organic pigments; here instead of solid glass sheets thin gelatin sheets are used. Gelatin filters are not use now days. 80 It tends to deteriorate with time and gets affected by the heat and moisture. The color of the dye gets bleached.
  • 81. MERITS:- Simple in construction Cheaper Selection of the filter is easy  DEMERITS:- Less accurate Band pass (bandwidth) is more (±20-30nm) i.e. if we have to measure at 400nm; we get radiation from 370-430nm. Hence less accurate results are obtained. 81
  • 82.  Works on the interference phenomenon, causes rejection of unwanted wavelength by selective reflection.  It is constructed by using two parallel glass plates, which are silvered internally and separated by thin film of dielectric material of different (CaF2, SiO, MgF2) refractive index. These filters have a band pass of 10-15nm with peak transmittance of 40-60%. 82
  • 83. Merits -  Provide greater transmittance and narrower band pass (10- 15nm) as compare to absorption filter.  Inexpensive  Additional filters can be used to cut off undesired wavelength. 83
  • 84.    Prism is made from glass, Quartz or fused silica. Quartz or fused silica is the choice of material of UV spectrum. When white light is passed through glass prism, dispersion of polychromatic light in rainbow occurs. Now by rotation of the prism different wavelengths of the spectrum can be made to pass through in exit slit on the sample.  The effective wavelength depends on the dispersive power of prism material and the optical angle of the prism. 84
  • 85. 85
  • 86. • There are two types of mounting in an instrument one is called ‘Cornu type’(refractive), which has an optical angle of 60o and its adjusted such that on rotation the emerging light is allowed to fall on exit slit. • The other type is called “Littrow type”(reflective), which has optical angle 30o and its one surface is aluminized with reflected light back to pass through prism and to emerge on the same side of the light source i.e. light doesn’t pass through the prism on other side. 86
  • 87.  Are most effective one in converting a polychromatic light to monochromatic light. As a resolution of +/- 0.1nm could be achieved by using gratings, they are commonly used in spectrophotometers.  Gratings are of two types. 1. Diffraction grating. 2. Transmission gratings. 87
  • 88.  More refined dispersion of light is obtained by means of diffraction gratings.  These consist of large number of parallel lines ( grooves) about 15000-30000/ inch is ruled on highly polished surface of aluminum.  these gratings are replica made from master gratings by coating the original master grating with a epoxy resin and are removed after setting 88
  • 89. To make the surface reflective, a deposit of aluminum is made on the surface. In order to minimize to greater amounts of scattered radiation and appearance of unwanted radiation of other spectral orders, the gratings are blazed to concentrate the radiation into a single order. 89
  • 90. It is similar to diffraction grating but refraction takes place instead of reflection. Refraction produces reinforcement. this occurs when radiation transmitted through grating reinforces with the partially refracted radiation. 90
  • 91.  Grating gives higher and linear dispersions compared to prism monochromator. like  Can be used over wide wavelength ranges.  Gratings can be constructed with materials aluminium which is resistant to atmospheric moisture.  Provide light of narrow wavelength.  No loss of energy due to absorption. 91
  • 92. Comparison Prism Grating Made of Glass-: Visible Quartz/fused silica-: UV Alkali halide:- IR Grooved on highly polished surface like alumina. Working Principle Angle of Incident Law of diffraction nλ= d (sini±sinθ) Merits/demerits  Prisms give non-liner dispersion hence no overlap of spectral order.  It can’t be used over consideration wavelength ranges.  Prisms are not sturdy and long lasting.  Grating gives liner dispersion hence overlap of spectral order.  It can be used over considerable wavelength ranges.  Grating are sturdy and long lasting 92
  • 93.  The cells or cuvettes are used for handling liquid samples.  The cell may either be rectangular or cylindrical in nature.  For study in UV region; the cells are prepared from quartz or fused silica whereas color corrected fused glass is used for visible region.  The surfaces of absorption cells must be kept scrupulously clean. No fingerprints or blotches should be present on cells.  Cleaning is carried out washing with distilled water or with dilute alcohol, acetone. 93
  • 94. 94
  • 95.  Device which converts light energy into electrical signals, that are displayed on readout devices.  The transmitted radiation falls on the detector which determines the intensity of radiation absorbed by sample The following types of detectors are employed in instrumentation of absorption spectrophotometer 1. Barrier layer cell/Photovoltaic cell 2. Phototubes/ Photo emissive tube 3. Photomultiplier tube 95
  • 96. Requirements of an ideal detector:- It should give quantitative response. It should have high sensitivity and low noise level. It should have a short response time. It should provide signal or response quantitative to wide spectrum of radiation received. 96
  • 97.  The detector has a thin film metallic layer coated with silver or gold and acts as an electrode.  It also has a metal base plate which acts as another electrode.  These two layers are separated by a semiconductor layer of selenium. 97
  • 98.  When light radiation falls on selenium layer, electrons become mobile and are taken up by transparent metal layer.  This creates a potential difference between two electrodes & causes the flow of current.  When it is connected to galvanometer, a flow of current observed which is proportional to the intensity and wavelength of light falling on it. 98
  • 99. 99
  • 100. 100
  • 101.  Consists of a evacuated glass tube with a photocathode and a collector anode.  The surface of photocathode is coated with a layer of elements like cesium, silver oxide or mixture of them.  When radiant energy falls on photosensitive cathode, electrons are emitted which are attracted to anode causing current to flow.  More sensitive compared to barrier layer cell and therefore widely used. 101
  • 102. The principle employed in this detector is that, multiplication of photoelectrons by secondary emission of electrons. In a vacuum tube, a primary photo-cathode is fixed which receives radiation from the sample. Some eight to ten dynodes are fixed each with increasing potential of 75-100V higher than preceding one. Near the last dynode is fixed an anode or electron collector electrode. Photo-multiplier is extremely sensitive to light and is best suited where weaker or low radiation is received 102
  • 103. 103
  • 104.  Depending upon the monochromators (filters or dispersing device) used to isolate and transmit a narrow beam of radiant energy from the incident light determines whether the instrument is classified as Photometer or a Spectrophotometer.  Spectrophotometers used here detects the percentage transmittance of light radiation, when light of certain intensity & frequency range is passed through the sample.  Both can be a single beam or double beam optical system. 104
  • 105. • Light from the source is carried through lens and/or through aperture to pass through a suitable filter. • The type of filter to be used is governed by the colour of the solution. • The sample solution to be analysed is placed in cuvettes. 105
  • 106. 106
  • 107. After passing through the solution, the light strikes the surface of detector (barrier-layer cell or phototube) and produces electrical current. The output of current is measured by the deflection of needle of light-spot galvanometer or micro ammeter. This meter is calibrated in terms of transmittance as well as optical density. The readings of solution of both standard and unknown are recorded in optical density units after adjusting instrument to a reagent blank. 107
  • 108. 108
  • 109. Double beam instrument is the one in which two beams are formed in the space by a U shaped mirror called as beam splitter or beam chopper . Chopper is a device consisting of a circular disc. One third of the disc is opaque and one third is transparent, remaining one third is mirrored. It splits the monochromatic beam of light into two beams of equal intensities. 109
  • 110. 110
  • 111. 111
  • 112. Advantages of single & double beam spectrophotometer 112 Single beam- Simple in construction, Easy to use and economical Double beam- It facilitates rapid scanning over wide λ region. Fluctuations due to radiation source are minimised. It doesn’t require adjustment of the transmittance at 0% and 100% at each wavelength. It gives ratio of intensities of sample & reference beams simultaneously.
  • 113. Single beam 113 Any fluctuation in the intensity of radiation sources affects the absorbance. Continuous spectrum is not obtained. Double beam Construction is complicated. Instrument is expensive.
  • 114. SL. NO SINGLE BEAM INSTRUMENT DOUBLBEAM INSTRUMENT 1. Calibration should be Calibration is done done with blank every only in the beginning. time, before measuring the absorbance or transmittance of sample 114
  • 115. 2 Radiant energy intensity changes with fluctuation of voltage. It permits a large degree of inherent compensation for fluctuations in the intensity of the radiant energy. 3 It measure the total amount of transmitted light reaching the detector It measures the percentage of light absorbed by the sample. 115
  • 116. 4 In single beam it’s not possible to compare blank and sample together. In double beam it’s possible to do direct one step comparison of sample in one path with a standard in the other path. 5 In single beam radiant energy wavelength has to be adjusted every time. In this scanning can be done over a wide wavelength region 6 Working on single beam is tedious and time consuming. Working on double beam is fast and non tedious. 58
  • 117. Instrumental Analysis, Skoog, Fifth edition, Page no.312-316 Instrumental methods of chemical analysis, Gurdeep R. chatwal. Page no2.116-2.122 Elementary organic analysis, Principles and chemical applications , Y R Shrama, page no12-14 A textbook of pharmaceutical analysis, kasturi A V ,Vol 310th ed., 169-81 11 7
  • 118. 11 8
  • 119. Light Source- Function of temperature Continuous radiation Adequate intensity stable Visible: Tungsten filament lamps Tungsten halogen Carbon arc Uv: Hydrogen-Deuterium discharge :two electrodes in a deuterium filled silica envelop Xenon discharge Mercuric arc Monochromator- Filters: Absorption filters.. complementary Interference filters…glass plates .. Silvered internally… thin film of dielectric material.. Monochromaters Prisms: Refractive type
  • 120. 120 Instrumentation – Sample Handling 1. Virtually all UV spectra are recorded solution-phase 2. Cells can be made of plastic, glass or quartz 3. Only quartz is transparent in the full 200-700 nm range; plastic and glass are only suitable for visible spectra 4. Concentration (we will cover shortly) is empirically determined A typical sample cell (commonly called a cuvet):
  • 121. 121 5. Solvents must be transparent in the region to be observed; the wavelength where a solvent is no longer transparent is referred to as the cutoff 6. Since spectra are only obtained up to 200 nm, solvents typically only need to lack conjugated p systems or carbonyls Common solvents and cutoffs: acetonitrile 190 chloroform 240 cyclohexane 195 1,4-dioxane 215 95% ethanol 205 n-hexane 201 methanol 205 isooctane 195 water 190
  • 122. Detectors: Barrier layer cell: No power supply Current proportional to light intensity Metallic plate… layer selenium …conducting material layer… Photo tubes Evacuated tubes…photo catode … collector anode… Photo multiplier tubes Sensitive and expensive Multiplication of initial photo electons Several anodes with gradually increasing potential.. Never goes zero Dark current
  • 124. Absorbance 0.80 0 ε=1000 ε=1500 0.60 0 ε=1750 0.400 0.200 0.00 2.0 4.0 6.0 8.0 10.0 concentration 12 4
  • 126. 1)Elementary organic spectroscopy,principles & chemical applications,Y.R Sharma,Revised edition,pg n.o 18,26,27 2) Pharmaceutical chemistry,Instrumental techniques,vol 2,Leslie.G.chatten,pg n.o 21-24 3)Principles and practice of analytical chemistry,F.W Fifield &D.kealey, 5th edition ,pg n.o 270-274 4)Pharmaceutical analysis,P.Parimoo, pg n.o 147,151,152,165 5)Industrial methods of chemical analysis,B.K Sharma,pg n.o 46-65,91- 12 6
  • 127. 6)Instrumental analysis,Skoog,Holler,Crouch, pg no.383,386 12 7 7)Practical pharmaceutical chemistry,4th edition,partv 2, Beckett ,stenlake, pg n.o275-277