FACTORIAL DESIGN IN
PHARMACEUTICAL RESEARCH
Dr. Ashwani Dhingra
Professor,
GGSCOP, Yamunanagar
FACTORIAL DESIGN
Objectives
To study the effect of different
factors, conditions and their
interactions on the response
observed in experiments
FACTORIAL
DESIGN
Definitions
Factor
An assigned variable such as
concentration, Temperature, an
adjuvant, treatment method or
diet. It may be,
• Qualitative (Batches,
Treatment, diet etc.)
• Quantitative (Concentration,
Temperature or any
measurable parameter)
FACTORIAL
DESIGN
Definitions
Levels
• Values or designations assigned to
the factor (30o, 50o, 0.1m, 0.3m etc.)
• Generally, the trials of the factorial
experiment consists of all
combination of all levels of all
factors. Example
Symbol Formulation
(1) Low drug & low lubricant conc.
a Low drug & high lubricant conc.
b High drug & low lubricant conc.
ab High drug & high lubricant conc.
FACTORIAL
DESIGN
Definitions
Effect
Change in response caused by varying the levels
of the factor (drug at two levels)
--------------------------------------------------------------------------
Symbol Formulation Effect (Dissolution)
--------------------------------------------------------------------------
(1) Low drug & low lubricant conc low (mean of
a Low drug & high lubricant conc low (1) & a)
b High drug & low lubricant conc High (mean of
ab High drug & high lubricant conc High b & ab)
--------------------------------------------------------------------------
Shows linear effect of drug.
FACTORIAL
DESIGN
Effect
Change in response caused by varying the
levels of the factor (lubricant at three levels)
-----------------------------------------------------------------
Formulation Effect (Dissolution)
-----------------------------------------------------------------
Low drug & low lubricant conc low
Low drug & Medium lubricant conc medium
Low drug & High lubricant conc High
-----------------------------------------------------------------
Show non-linearity (Quadratic)
FACTORIAL
DESIGN
Interaction
Lack of additivity of factor
effect
Example: effect of a=5 & b=10
Effect of a+b ≠ 15 (Interaction);
>15 (Synergistic);
< 15 (Antagonistic)
Interaction is also when
effect of a factor changes
with the level of the other
FACTORIAL
DESIGN
Experiments
Types of factorial experiments
-------------------------------------------------
Type No. of factors No. of levels No. of expts.
-------------------------------------------------
22 2 2 4
23 3 2 8
32 2 3 9
24 4 2 16
25 5 2 32
-------------------------------------------------
FACTORIAL
DESIGN
Notation
Factorial experiments, Notations
for 23 design (8 Expts.)
-----------------------------------------------------
Expt. No. Combination A B C
-----------------------------------------------------
(1) - - -
a + - -
b - + -
ab + + -
c - - +
ac + - +
bc - + +
abc + + +
-----------------------------------------------------
- low level : + High level
FACTORIAL DESIGN
Example
Factorial experiments, Example of a 23 design (8 Expts.)
---------------------------------------------------------------------------------------------------------------------------
Factor Comb. Stearate Drug Starch Response (Thickness)
---------------------------------------------------------------------------------------------------------------------------
(1) - - - 475 Cm-3
a + - - 487 Cm-3
b - + - 421 Cm-3
Ab + + - 426 Cm-3
C - - + 525 Cm-3
Ac + - + 546 Cm-3
Bc - + + 472 Cm-3
Abc + + + 522 Cm-3
---------------------------------------------------------------------------------------------------------------------------
Level Stearate Drug Starch
Low (-) 0.5 60 30
High (+) 1.5 120 50
FACTORIAL DESIGN
Computation
Computation of the main effect and interaction
Steps:
• Obtain signs to calculate effect for interaction terms
• Calculate the average main effect
• Calculate the interaction effect
• Data analysis
a. Method of Yates
b. Analysis of variance
• Interpretation of effects and interaction of factors
FACTORIAL DESIGN
Computation
Obtain signs to calculate effect for interaction terms
------------------------------------------------------------------------------------------------------------------------------
Factor Comb Levels Interaction
A B C AB AC BC ABC
------------------------------------------------------------------------------------------------------------------------------
(1) - - - + + + -
a + - - - - + +
b - + - - + - +
Ab + + - + - - -
C - - + + - - +
Ac + - + - + - -
Bc - + + - - + -
Abc + + + + + + +
------------------------------------------------------------------------------------------------------------------------------
Multiply signs of factors to obtain the signs of interaction
FACTORIAL DESIGN
Computation
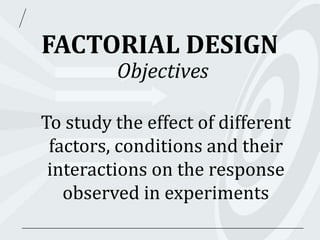
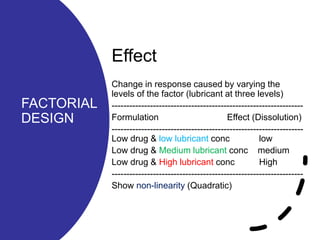
Calculation of the average main effect
The average main effect for factor A :
= [-(1)+a-b+ab-c+ac-bc+abc / 2(n-1)
= [ (a+ab+ac+abc) - ((1)+b+c+bc)] / 2(n-1)
= [(487+426+456+522)- (475+421+525+472)] / 4
= 22 x 10-3 cms
Similarly the average main effect for factor B and C are
calculated
FACTORIAL DESIGN
Computation
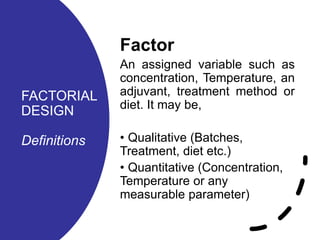
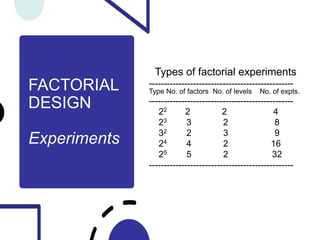
Calculation of the interaction effect
AC interaction effect is
= [(abc+ac-bc-c)- (ab+a-b-(1))] / 2(n-1)
= [ ( 522+546-472-525)- (426+487-421-475)] / 4
= 13.5 x 10⁻³ cms
Similarly, interaction effect of ab, bc, abc are calculated
FACTORIAL DESIGN
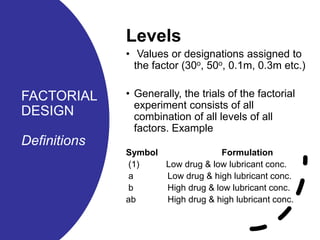
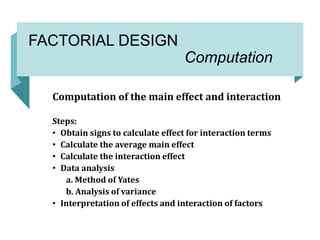
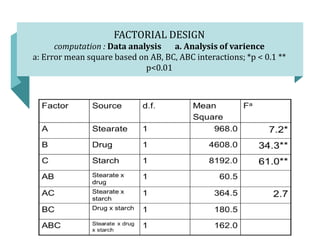
computation : Data analysis a. Method of Yates
*(1) + a; b+ab; c+ac; bc+abc; a-(1); ab-b; ac-c; abc-bc
@ Sequential addition and subtraction of values in column (1) [Ex; 962+847=1809]
# Sequential addition and subtraction of values in column (2) [Ex; 1809+2065=3874]
Combina
tion
Thicknes
s
(1)* (2)@ (3)# Effect
(3)/4
Mean
Square
(3)2 /8
(1)
a
b
ab
c
ac
bc
abc
475
487
421
426
525
546
472
522
962
847
1071
994
12
5
21
50
1809
2065
17
71
-115
-77
-7
29
3874
88
-192
22
256
54
38
36
-
22.0
-48.0
5.5
64.0
13.5
9.5
9.0
-
968.0
4608.0
60.5
8192.0
364.5
180.5
162.0
FACTORIAL DESIGN
computation : Data analysis a. Analysis of varience
a: Error mean square based on AB, BC, ABC interactions; *p < 0.1 **
p<0.01
FACTORIAL DESIGN
Interpretation
Each effect has one degree of freedom
• AC interaction suggests that the effect of A
(Stearate) depends on the level of C (Although
not significant; Fa= 2.7)
• B (drug) does not interact with A (stearate) or C
(starch)
FACTORIAL DESIGN
Optimization
Fitting of an empirical polynomial equation
For 23 factorial, Response ‘Y’ is given by
Y= Bo + B1X1+ B2X2+ B3X3+ B12X1X2+ B13X1X3+ B23X2X3+
B123X1X2X3
Bo : Intercept
B1,B2,B3 : Coefficients of factors 1,2,3.
B12, B23, B13: Coefficient of interaction bet factors 1-2, 2-3, 1-3
B123 : Coefficient of interaction bet factors 1-2-3
X1,X2,X3 : Levels of factors 1,2,3.
FACTORIAL DESIGN
Optimization
Formulation X1 X2 X3 Y
1 0 0 0 5
2 2 0 0 9
3 0 1 0 8
4 2 1 0 10.8
5 0 0 5 10
6 2 0 5 10
7 0 1 5 16.5
8 2 1 5 16.5
• Fitting of an empirical polynomial equation
• When all the factors = 0; Y= Bo= 5
FACTORIAL DESIGN
Advantages
 In absence of interaction, it gives maximum efficiency in estimating
main effect.
 If interaction exist, FD are necessary to reveal and identify the
interaction.
 Since factor effects are measured over varying levels of other
factors, conclusions apply to a vide range of conditions.
 Maximum use of the data is made as the effect and interactions are
calculated from all the data.
 FD may be orthogonal (All estimated effect of one factor is
independent of the effect of other factor) or non-orthogonal
(Dependent).
Prof. (Dr.) Ashwani K. Dhingra
Guru Gobind Singh College of Pharmacy,
Yamuna Nagar, Haryana.
E-mail: ashwani1683@gmail.com
Contact No.: +91-9996230055

Factorial Design.pptx

  • 1.
    FACTORIAL DESIGN IN PHARMACEUTICALRESEARCH Dr. Ashwani Dhingra Professor, GGSCOP, Yamunanagar
  • 2.
    FACTORIAL DESIGN Objectives To studythe effect of different factors, conditions and their interactions on the response observed in experiments
  • 3.
    FACTORIAL DESIGN Definitions Factor An assigned variablesuch as concentration, Temperature, an adjuvant, treatment method or diet. It may be, • Qualitative (Batches, Treatment, diet etc.) • Quantitative (Concentration, Temperature or any measurable parameter)
  • 4.
    FACTORIAL DESIGN Definitions Levels • Values ordesignations assigned to the factor (30o, 50o, 0.1m, 0.3m etc.) • Generally, the trials of the factorial experiment consists of all combination of all levels of all factors. Example Symbol Formulation (1) Low drug & low lubricant conc. a Low drug & high lubricant conc. b High drug & low lubricant conc. ab High drug & high lubricant conc.
  • 5.
    FACTORIAL DESIGN Definitions Effect Change in responsecaused by varying the levels of the factor (drug at two levels) -------------------------------------------------------------------------- Symbol Formulation Effect (Dissolution) -------------------------------------------------------------------------- (1) Low drug & low lubricant conc low (mean of a Low drug & high lubricant conc low (1) & a) b High drug & low lubricant conc High (mean of ab High drug & high lubricant conc High b & ab) -------------------------------------------------------------------------- Shows linear effect of drug.
  • 6.
    FACTORIAL DESIGN Effect Change in responsecaused by varying the levels of the factor (lubricant at three levels) ----------------------------------------------------------------- Formulation Effect (Dissolution) ----------------------------------------------------------------- Low drug & low lubricant conc low Low drug & Medium lubricant conc medium Low drug & High lubricant conc High ----------------------------------------------------------------- Show non-linearity (Quadratic)
  • 7.
    FACTORIAL DESIGN Interaction Lack of additivityof factor effect Example: effect of a=5 & b=10 Effect of a+b ≠ 15 (Interaction); >15 (Synergistic); < 15 (Antagonistic) Interaction is also when effect of a factor changes with the level of the other
  • 8.
    FACTORIAL DESIGN Experiments Types of factorialexperiments ------------------------------------------------- Type No. of factors No. of levels No. of expts. ------------------------------------------------- 22 2 2 4 23 3 2 8 32 2 3 9 24 4 2 16 25 5 2 32 -------------------------------------------------
  • 9.
    FACTORIAL DESIGN Notation Factorial experiments, Notations for23 design (8 Expts.) ----------------------------------------------------- Expt. No. Combination A B C ----------------------------------------------------- (1) - - - a + - - b - + - ab + + - c - - + ac + - + bc - + + abc + + + ----------------------------------------------------- - low level : + High level
  • 10.
    FACTORIAL DESIGN Example Factorial experiments,Example of a 23 design (8 Expts.) --------------------------------------------------------------------------------------------------------------------------- Factor Comb. Stearate Drug Starch Response (Thickness) --------------------------------------------------------------------------------------------------------------------------- (1) - - - 475 Cm-3 a + - - 487 Cm-3 b - + - 421 Cm-3 Ab + + - 426 Cm-3 C - - + 525 Cm-3 Ac + - + 546 Cm-3 Bc - + + 472 Cm-3 Abc + + + 522 Cm-3 --------------------------------------------------------------------------------------------------------------------------- Level Stearate Drug Starch Low (-) 0.5 60 30 High (+) 1.5 120 50
  • 11.
    FACTORIAL DESIGN Computation Computation ofthe main effect and interaction Steps: • Obtain signs to calculate effect for interaction terms • Calculate the average main effect • Calculate the interaction effect • Data analysis a. Method of Yates b. Analysis of variance • Interpretation of effects and interaction of factors
  • 12.
    FACTORIAL DESIGN Computation Obtain signsto calculate effect for interaction terms ------------------------------------------------------------------------------------------------------------------------------ Factor Comb Levels Interaction A B C AB AC BC ABC ------------------------------------------------------------------------------------------------------------------------------ (1) - - - + + + - a + - - - - + + b - + - - + - + Ab + + - + - - - C - - + + - - + Ac + - + - + - - Bc - + + - - + - Abc + + + + + + + ------------------------------------------------------------------------------------------------------------------------------ Multiply signs of factors to obtain the signs of interaction
  • 13.
    FACTORIAL DESIGN Computation Calculation ofthe average main effect The average main effect for factor A : = [-(1)+a-b+ab-c+ac-bc+abc / 2(n-1) = [ (a+ab+ac+abc) - ((1)+b+c+bc)] / 2(n-1) = [(487+426+456+522)- (475+421+525+472)] / 4 = 22 x 10-3 cms Similarly the average main effect for factor B and C are calculated
  • 14.
    FACTORIAL DESIGN Computation Calculation ofthe interaction effect AC interaction effect is = [(abc+ac-bc-c)- (ab+a-b-(1))] / 2(n-1) = [ ( 522+546-472-525)- (426+487-421-475)] / 4 = 13.5 x 10⁻³ cms Similarly, interaction effect of ab, bc, abc are calculated
  • 15.
    FACTORIAL DESIGN computation :Data analysis a. Method of Yates *(1) + a; b+ab; c+ac; bc+abc; a-(1); ab-b; ac-c; abc-bc @ Sequential addition and subtraction of values in column (1) [Ex; 962+847=1809] # Sequential addition and subtraction of values in column (2) [Ex; 1809+2065=3874] Combina tion Thicknes s (1)* (2)@ (3)# Effect (3)/4 Mean Square (3)2 /8 (1) a b ab c ac bc abc 475 487 421 426 525 546 472 522 962 847 1071 994 12 5 21 50 1809 2065 17 71 -115 -77 -7 29 3874 88 -192 22 256 54 38 36 - 22.0 -48.0 5.5 64.0 13.5 9.5 9.0 - 968.0 4608.0 60.5 8192.0 364.5 180.5 162.0
  • 16.
    FACTORIAL DESIGN computation :Data analysis a. Analysis of varience a: Error mean square based on AB, BC, ABC interactions; *p < 0.1 ** p<0.01
  • 17.
    FACTORIAL DESIGN Interpretation Each effecthas one degree of freedom • AC interaction suggests that the effect of A (Stearate) depends on the level of C (Although not significant; Fa= 2.7) • B (drug) does not interact with A (stearate) or C (starch)
  • 18.
    FACTORIAL DESIGN Optimization Fitting ofan empirical polynomial equation For 23 factorial, Response ‘Y’ is given by Y= Bo + B1X1+ B2X2+ B3X3+ B12X1X2+ B13X1X3+ B23X2X3+ B123X1X2X3 Bo : Intercept B1,B2,B3 : Coefficients of factors 1,2,3. B12, B23, B13: Coefficient of interaction bet factors 1-2, 2-3, 1-3 B123 : Coefficient of interaction bet factors 1-2-3 X1,X2,X3 : Levels of factors 1,2,3.
  • 19.
    FACTORIAL DESIGN Optimization Formulation X1X2 X3 Y 1 0 0 0 5 2 2 0 0 9 3 0 1 0 8 4 2 1 0 10.8 5 0 0 5 10 6 2 0 5 10 7 0 1 5 16.5 8 2 1 5 16.5 • Fitting of an empirical polynomial equation • When all the factors = 0; Y= Bo= 5
  • 20.
    FACTORIAL DESIGN Advantages  Inabsence of interaction, it gives maximum efficiency in estimating main effect.  If interaction exist, FD are necessary to reveal and identify the interaction.  Since factor effects are measured over varying levels of other factors, conclusions apply to a vide range of conditions.  Maximum use of the data is made as the effect and interactions are calculated from all the data.  FD may be orthogonal (All estimated effect of one factor is independent of the effect of other factor) or non-orthogonal (Dependent).
  • 21.
    Prof. (Dr.) AshwaniK. Dhingra Guru Gobind Singh College of Pharmacy, Yamuna Nagar, Haryana. E-mail: ashwani1683@gmail.com Contact No.: +91-9996230055