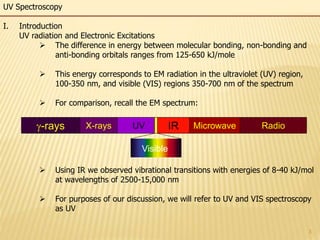
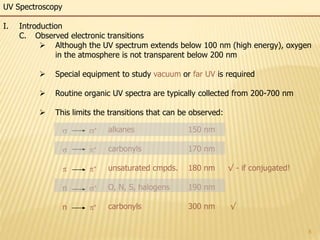
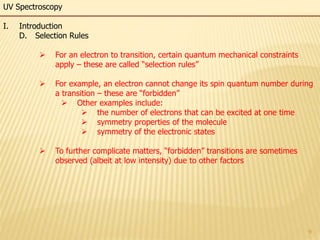
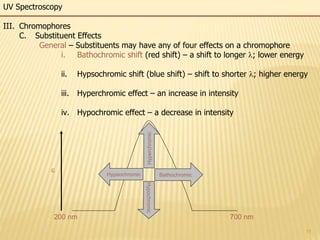
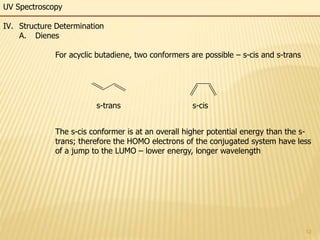
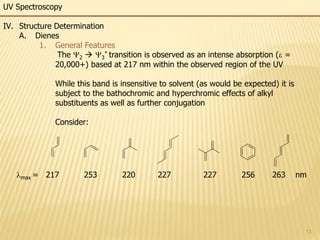
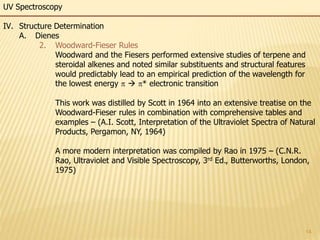
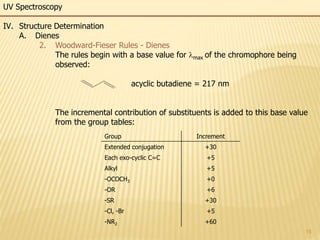
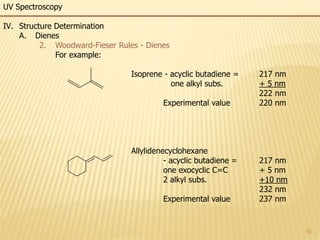
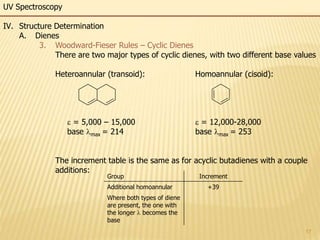
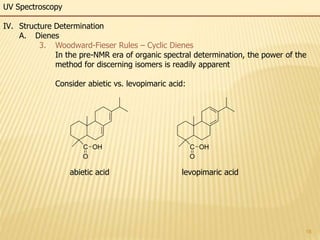
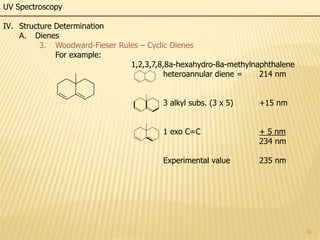
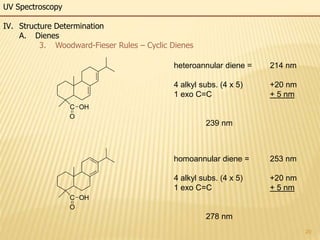
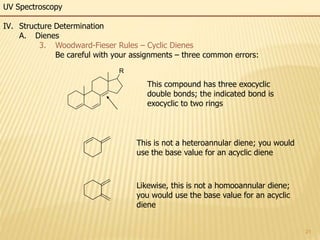
This document provides an overview of UV-Visible spectroscopy. It begins with an introduction that describes UV radiation and electronic excitations. It explains how UV spectroscopy works and the types of electronic transitions that are observed. It discusses chromophores, substituent effects, and selection rules. The document then covers using UV spectroscopy for structure determination, including discussing dienes and applying the Woodward-Fieser rules to determine structures of cyclic and acyclic dienes. In the final section, it discusses common errors in applying the Woodward-Fieser rules.
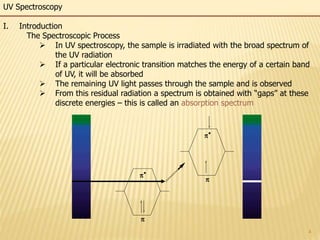


![UV SPECTROSCOPY [ULTRA-VIOLET SPECTROSCOPY]](https://cdn.slidesharecdn.com/ss_thumbnails/40-191218142647-thumbnail.jpg?width=640&height=640&fit=bounds)


