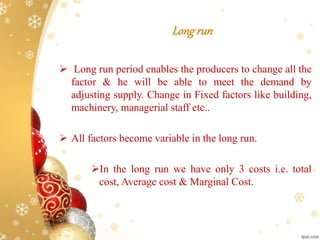
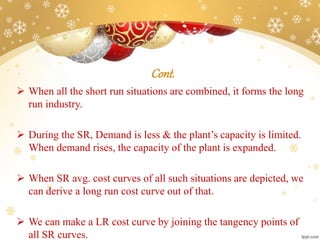
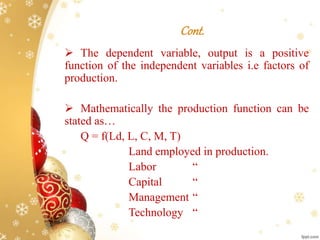
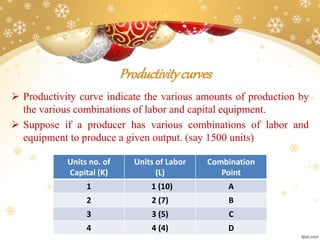
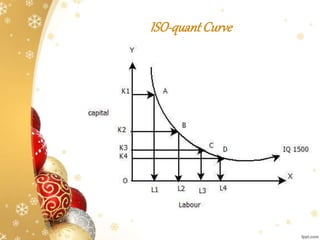
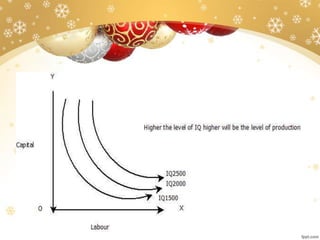
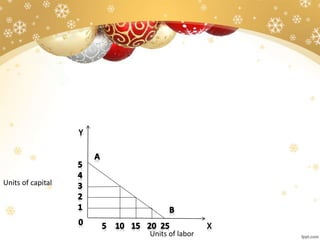
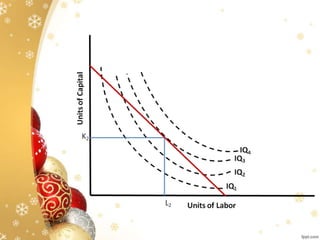
The document discusses production functions and costs. It defines a production function as the relationship between inputs like labor, capital, land, and entrepreneurship and the volume of output. It describes how productivity curves show different combinations of inputs that can produce certain outputs. It also discusses concepts like economies of scale, fixed vs variable costs, and how average and marginal costs change with different levels of output in the short run and long run.
Introduction,Factor of production,Production functions,Types of production functions,Short run,Long run,Iso-quant line,Iso-cost line,Production possibility frontier
The basic function of a firm is to produce one or more goods and /or services and sell them in the market.
Production requires employment of various factors of production, which are substitutes among themselves to certain extent.
Thus, every firm has to decide what combination of various factors of production, also called inputs, to choose to produce a certain fixed or variable quantities of a particular good.
The problem is referred to as “ how to produce?”
cost of production / Chapter 6(pindyck)RAHUL SINHA
topics covered
•Production and firm
•The production function
•Short run versus Long run
•Production with one variable input(Labour)
•Average product
•Marginal product
•The slopes of the production curve
•Law of diminishing marginal returns
•Production with two variable inputs
•Isoquant
•Isoquant Maps
•Diminishing marginal returns
•Substitution among inputs
•Returns to scale
•Describing returns to scale
Shyness (also called diffidence) is the feeling of apprehension, lack of comfort, or awkwardness especially when a person is around other people. This commonly occurs in new situations or with unfamiliar people. Shyness can be a characteristic of people who have low self-esteem.
We’ve both experienced different variations of shyness, and through practice and increased awareness we have both overcome this. The following are tips that have helped us overcome this uncomfortable feeling.
This is an Economics project which will help in understanding the concept of production, the costs involved in it, and the contributing factors associated with both.
The French Revolution, which began in 1789, was a period of radical social and political upheaval in France. It marked the decline of absolute monarchies, the rise of secular and democratic republics, and the eventual rise of Napoleon Bonaparte. This revolutionary period is crucial in understanding the transition from feudalism to modernity in Europe.
For more information, visit-www.vavaclasses.com
Read| The latest issue of The Challenger is here! We are thrilled to announce that our school paper has qualified for the NATIONAL SCHOOLS PRESS CONFERENCE (NSPC) 2024. Thank you for your unwavering support and trust. Dive into the stories that made us stand out!
2024.06.01 Introducing a competency framework for languag learning materials ...Sandy Millin
http://sandymillin.wordpress.com/iateflwebinar2024
Published classroom materials form the basis of syllabuses, drive teacher professional development, and have a potentially huge influence on learners, teachers and education systems. All teachers also create their own materials, whether a few sentences on a blackboard, a highly-structured fully-realised online course, or anything in between. Despite this, the knowledge and skills needed to create effective language learning materials are rarely part of teacher training, and are mostly learnt by trial and error.
Knowledge and skills frameworks, generally called competency frameworks, for ELT teachers, trainers and managers have existed for a few years now. However, until I created one for my MA dissertation, there wasn’t one drawing together what we need to know and do to be able to effectively produce language learning materials.
This webinar will introduce you to my framework, highlighting the key competencies I identified from my research. It will also show how anybody involved in language teaching (any language, not just English!), teacher training, managing schools or developing language learning materials can benefit from using the framework.
The Indian economy is classified into different sectors to simplify the analysis and understanding of economic activities. For Class 10, it's essential to grasp the sectors of the Indian economy, understand their characteristics, and recognize their importance. This guide will provide detailed notes on the Sectors of the Indian Economy Class 10, using specific long-tail keywords to enhance comprehension.
For more information, visit-www.vavaclasses.com
We all have good and bad thoughts from time to time and situation to situation. We are bombarded daily with spiraling thoughts(both negative and positive) creating all-consuming feel , making us difficult to manage with associated suffering. Good thoughts are like our Mob Signal (Positive thought) amidst noise(negative thought) in the atmosphere. Negative thoughts like noise outweigh positive thoughts. These thoughts often create unwanted confusion, trouble, stress and frustration in our mind as well as chaos in our physical world. Negative thoughts are also known as “distorted thinking”.
Synthetic Fiber Construction in lab .pptxPavel ( NSTU)
Synthetic fiber production is a fascinating and complex field that blends chemistry, engineering, and environmental science. By understanding these aspects, students can gain a comprehensive view of synthetic fiber production, its impact on society and the environment, and the potential for future innovations. Synthetic fibers play a crucial role in modern society, impacting various aspects of daily life, industry, and the environment. ynthetic fibers are integral to modern life, offering a range of benefits from cost-effectiveness and versatility to innovative applications and performance characteristics. While they pose environmental challenges, ongoing research and development aim to create more sustainable and eco-friendly alternatives. Understanding the importance of synthetic fibers helps in appreciating their role in the economy, industry, and daily life, while also emphasizing the need for sustainable practices and innovation.
1. Unit – 4 : Production Function
By RADHIKA
Faculty of Auditing
J H B W C
2. Introductionto Productionfunction
Production:
The term production refers to a process of converting
input into output. Inputs refer to the factors of
production. i.e Land, Labour, Capital and
Entrepreneur. Outputs refer to the volume of goods
and services produced.
3. • Land
• Labor
• Capital
• Entrepreneur
INPUTS
• Work In
Progress
Process • Goods
&
• Service
OUTPUT
4. ProductionFunction
Pro. Fun. states the relationship between the inputs
and the output factors of production. For any prod.
process the factors of production determine the
output.
Land, Labor, Capital and Entrepreneur(Management)
and Technology are those five major determinants of
any output.
5. Cont.
The dependent variable, output is a positive
function of the independent variables i.e factors of
production.
Mathematically the production function can be
stated as…
Q = f(Ld, L, C, M, T)
Land employed in production.
Labor “
Capital “
Management “
Technology “
6. Productivitycurves
Productivity curve indicate the various amounts of production by
the various combinations of labor and capital equipment.
Suppose if a producer has various combinations of labor and
equipment to produce a given output. (say 1500 units)
Units no. of
Capital (K)
Units of Labor
(L)
Combination
Point
1 1 (10) A
2 2 (7) B
3 3 (5) C
4 4 (4) D
8. Cont.
In the diagram the x-axis measures the amount of capital used and
y-axis amount of labor used.
By combining these two factors the firm can produce 1500 units .
Every point on the curve represents a combination of K and L
which will produce the same quantity of output.
The producer can choose any one of the combinations to secure
the given output.
If he chooses one combination, he will indifferent about others.
Hence the curve IQ is known as producers indifference curve as
ISO-quant or ISO-product curve.
9. Now a firm may be able to produce 1500 units
or 2000 and so on.
In the next diagram IQs represent the different
combinations of labor and capital which can
produce 1500 IQs represents 2000 units & so
on.
Every firm would like to produce the
highest possible output.
Cont.
10.
11. ISO-CostCurve
In order to find out the best output and the best combination to
produce that output, we will have to find out the amount of
money available to the producer for the two factors and the
prices of the two factors.
Suppose the producer has 20,000 rs. Available to be spent on
two factors and prices of those two factors are 4,000 rs. Per unit
of capital and 800 rs. Per workers. The producer will have three
alternative before him.
1. To secure 5 units of capital
2. To secure 25 worker only
3. To secure some machines and some workers e.g 3 units of
capital and 10 workers.
14. Economiesof Scale
Economies of scale are the cost advantages that enterprises
obtain due to size, output, or scale of operation, with cost per
unit of output generally decreasing with increasing scale as
fixed costs are spread out over more units of output.
The scale or size of enterprise to the amount investment in
relatively fixed factors of production.
Cost of production is generally lower in larger plants than in
smaller units
This is because of a no. of economies of large scale production.
15. Cont.
Economies of scale
Internal Economies
I. Managerial Economies
II. Financial Economies
III. Technical Economies
IV. Trade Economies
External Economies
I. Economies of Concentration [localized economies]
II. Economies of Dis-integration
III. Economies of Information
16. Unit -4Cost –OutputRelationship
In the short-run a change in output is possible only by making
changes in the variable inputs like raw materials, labour etc. Inputs
like land and buildings, plant and machinery etc. are fixed in the
short-run. It means that short-run is a period not sufficient enough
to expand the quantity of fixed inputs. Thus Total Cost (TC) in the
short-run is composed of two elements – Total Fixed Cost (TFC)
and Total Variable Cost (TVC).
TFC remains the same throughout the period and is not influenced
by the level of activity. The firm will continue to incur these costs
even if the firm is temporarily shut down. Even though TFC
remains the same fixed cost per unit varies with changes in the
level of output.
17. Cont.
The SR is a period which doesn’t permit
alterations in the fixed equipment
(machinery , building etc) & in the size of
the org.
The LR is a period in which there is
sufficient time to alter the equipment
(machinery, building, land etc.) & the size of
the org. output can be increased without
any limits being placed by the fixed
factors of production.
18. Total, average & marginal cost
1. Total cost (TC) =
TFC + TVC, rise as output
rises
2. Average cost (AC) =
TC/output
3. Marginal cost (MC) =
change in TC as a result of
changing output by one unit
Fixed cost & variable cost
1.Total fixed cost (TFC) =
cost of using fixed factors =
cost that does not change
when output is changed, e.g.
2. Total variable cost (TVC) =
cost of using variable
factors = cost that changes
when output is changed,
19.
20.
21. AverageFixedCostandOutput
The greater the output, the lower the fixed
cost per unit, i.e. the average fixed cost.
Total fixed costs remain the same & do not
change with a change in output.
22. AverageVariableCostandoutput
The avg. variable costs will first fall & then rise as more &
more units are produced in a given plant.
Variable factors tend to produce somewhat more efficiently near
a firm’s optimum output than at very low levels of output.
Greater output can be obtained but at much greater avg variable
cost.
E.g. if more & more workers are appointed, it may ultimately
lead to overcrowding & bad org. moreover, workers may have
to be paid higher wages for overtime work.
23. AverageTotalcost andoutput
Average total cost, also known as average costs,
would decline first & then rise upwards.
Average cost consists of average fixed cost plus
average variable cost.
Average fixed cost continues to fall with an
increase in output while avg. variable cost
first declines & then rises.
24. Cont.
So , as Avg. variable cost declines the Avg. total
cost will also decline. But after a point the Avg.
variable cost will rise.
When the rise in AVC is more than the drop in
Avg. fixed cost that the Avg. total cost will show a
rise.
25. Longrun
Long run period enables the producers to change all the
factor & he will be able to meet the demand by
adjusting supply. Change in Fixed factors like building,
machinery, managerial staff etc..
All factors become variable in the long run.
In the long run we have only 3 costs i.e. total
cost, Average cost & Marginal Cost.
26. Cont.
When all the short run situations are combined, it forms the long
run industry.
During the SR, Demand is less & the plant’s capacity is limited.
When demand rises, the capacity of the plant is expanded.
When SR avg. cost curves of all such situations are depicted, we
can derive a long run cost curve out of that.
We can make a LR cost curve by joining the tangency points of
all SR curves.