Downloaded 207 times
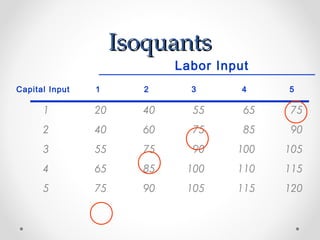
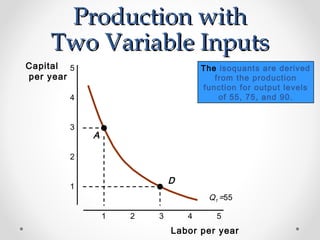
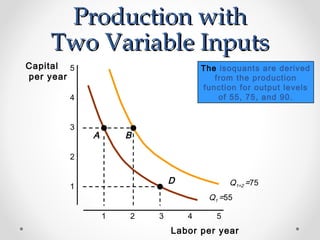
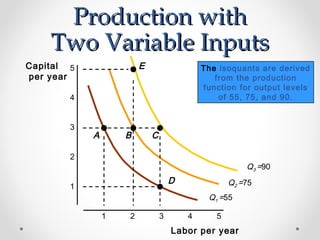
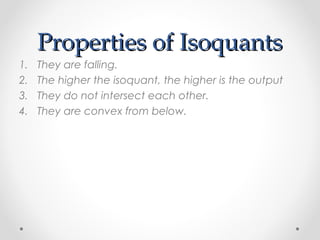
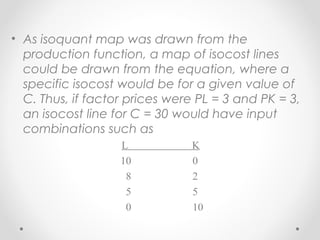


The document outlines the essentials of production in economics, emphasizing its broad definition, the factors of production, and the importance of production functions in determining output levels based on varying inputs. It differentiates between short-run and long-run production periods, explaining how fixed and variable inputs affect production capacity, and introduces concepts like isoquants and isocost lines to optimize input combinations for cost-efficiency and profit maximization. Key features discussed include the relationships between labor and capital, the impact of changes in input prices, and the strategic decision-making process for production management.


![Production function [ management ]](https://cdn.slidesharecdn.com/ss_thumbnails/productionfunctionmanagement-140115104149-phpapp01-thumbnail.jpg?width=640&height=640&fit=bounds)


