Downloaded 337 times

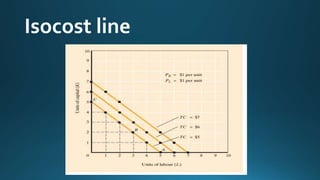

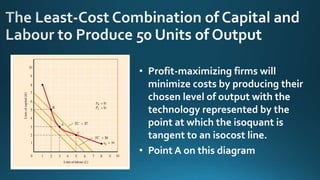
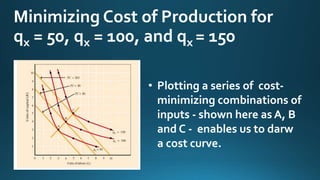
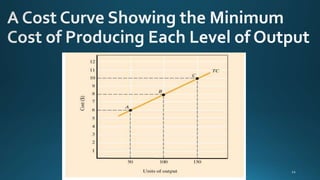


The document discusses isoquants and isocost curves. An isoquant shows the different combinations of two inputs, like labor and capital, that produce the same level of output. An isocost curve shows the combinations of inputs that can be purchased at a given total cost, given input prices. Together, isoquants and isocost curves can be used to find the cost-minimizing combination of inputs for a given level of output. The point where the isoquant is tangent to the isocost curve indicates the lowest cost combination.


