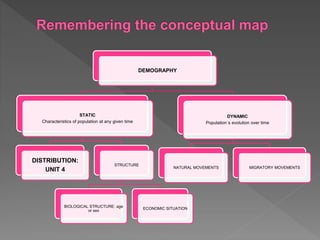
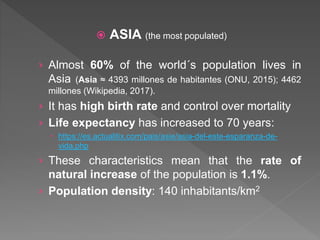
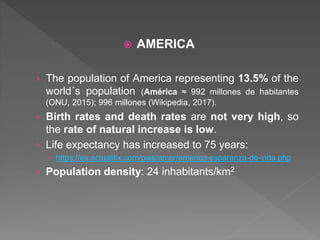
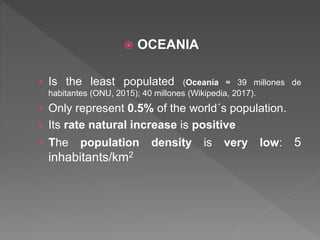
https://www.youtube.com/watch?v=tLCc_rqYgVE
DEMOGRAPHY
STATIC
Characteristics of population at any given time
DISTRIBUTION:
UNIT 4
STRUCTURE
BIOLOGICAL STRUCTURE: age
or sex
ECONOMIC SITUATION
DYNAMIC
Population´s evolution over time
NATURAL MOVEMENTS MIGRATORY MOVEMENTS
The Earth is inhabited by over 7.3 billion human beings.
However, they are inequalities in population distribution
over the Earth´s surface, because different FACTORS:
PHYSICAL AND HUMAN.
 FACTORS THAT AFFECT POPULATION DISTRIBUTION
 PHYSICAL FACTORS
› Climate. A suitable temperature favours human
settlement. For example, areas with very cold (polar regions) or
very high temps (equatorial forest or driest areas: hot deserts) are
almost unpopulated.
› Topography. Although there are people living in villages located
in mountainous areas, with difficult access, people prefer to settle
in low-lying areas near the coast and in river
valleys.
› Soil. The fertility of the soil, which favours the
developed of agriculture, has been an important factor.
› Water. In areas where water is scare, such as in deserts, the
population is usually low.
 It means that people tend lo live in temperate climates, areas of low
altitude and places near water with fertile soil.
Climate Topography
Soil Water
 HUMAN FACTORS
These are consequences of human actions which attract people to a territory or
cause them to leave it.
› Political. Decisions made by governments can influence demographic
behavior. Ex: policies encouraging or penalizing births, regulating
migration or causing citizens to go into exile.
› Economic. People usually settle where there is employment, industry
and services, such as cities. For example: welfare state (Spain): a lot of
public services and quality of life
› Technological. Technological advances allow people to alter natural
physical factors. For example, agriculture can be developed in previosly
arid areas thanks to hydraulic technologies.
Example of an anti-natalist policy: China and its one-
child policy (until 2015). ¿Why? To reduce population
growth, using propaganda posters and penalizing
couples who had more than one child.
› POPULATION DENSITY
 To analyse the number of people concentrated in an area and
compare population sizes, we need to calculate the population
density. This indicator allows us to make comparisons between
territories or countries of different sizes.
 To calculate it, we use the following formula:
› Very low population density: below 10 inhabitants/km2
› Low population density: 10-50 inhabitants/km2
› Moderate population density: 50-100 inhabitants/km2
› High population density: over 100 inhabitants/km2
› For example:
 Size of Africa = 30.310.000 Km2
 Total population = 1.186.000.000 of total population
 Population density of Africa = 39, 13 inhabitants/km2
 TOTAL POPULATION: Number of people that live
in a particular place.
› https://www.saberespractico.com/demografia/paises-por-
poblacion-2017/
 POPULATION DENSITY: Describes the
relationship that exists between the surface area of
a place and its population.
› https://www.indexmundi.com/g/r.aspx?v=21000&l=es
› https://www.saberespractico.com/curiosidades/paises-por-
densidad-de-poblacion/
› http://www.expansion.com/economia/2017/02/24/58b01455ca4741
e56f8b458f.html
 On a political map of the world you have to
stick in your notebook:
› Write the name of the ten most populated
countries of the world (red color).
› Write the name of the ten most densely
populated countries or places of the world (blue
color).
 ASIA (the most populated)
› Almost 60% of the world´s population lives in
Asia (Asia ≈ 4393 millones de habitantes (ONU, 2015); 4462
millones (Wikipedia, 2017).
› It has high birth rate and control over mortality
› Life expectancy has increased to 70 years:
 https://es.actualitix.com/pais/asie/asia-del-este-esparanza-de-
vida.php
› These characteristics mean that the rate of
natural increase of the population is 1.1%.
› Population density: 140 inhabitants/km2
 AFRICA
› The population of Africa represents the 16.1% of the
world´s population (África ≈ 1186 millones de habitantes
(ONU, 2015); 1196 millones (Wikipedia, 2017).
› It has the highest crude birth rate, but it also has
high death rates (especially infant mortality rate).
› Life expectancy has increased to 60 years (OMS)
 https://es.actualitix.com/pais/afri/africa-esparanza-de-vida.php
› In spite of this, Africa has a high rate of natural
increase with a young population.
› Population density: 39 inhabitants/km2
 AMERICA
› The population of America representing 13.5% of the
world´s population (América ≈ 992 millones de habitantes
(ONU, 2015); 996 millones (Wikipedia, 2017).
› Birth rates and death rates are not very high, so
the rate of natural increase is low.
› Life expectancy has increased to 75 years:
 https://es.actualitix.com/pais/amer/america-esparanza-de-vida.php
› Population density: 24 inhabitants/km2
 EUROPE.
› The population of Europe represents 10.04% of the
world´s population (Europa ≈ 738 millones de habitantes
(ONU, 2015); 744 millones (Wikipedia, 2017).
› The rate of natural increase is very low and is
negative in some countries (Spain, Bulgaria, Hungary).
› Life expectancy: 80 years.
› Population density: 32 inhabitants/km2
The most populous
country is Russia.
 OCEANIA
› Is the least populated (Oceanía ≈ 39 millones de
habitantes (ONU, 2015); 40 millones (Wikipedia, 2017).
› Only represent 0.5% of the world´s population.
› Its rate natural increase is positive
› The population density is very low: 5
inhabitants/km2
 THE DISPROPORTION BETWEEN GROWTH AND RESOURCES.
› In many poor countries, where the population is growing very fast, people go hungry
and development is restricted.
› These places are the starting point of migration.
 THE AGEING POPULATION.
› In developed countries, such as Spain, we can talk about an elderly population. It
means not only that we have to pay pensions, healthcare and specialist care, but also
the productive capacity of society suffers, because if there are fewer births, there are
fewer workers.
› In many countries with this situation, governments are putting pro-natalist policies into
practice.
 INEQUALITIES IN DEVELOPMENT
› The differences between the developed countries (richest countries) and developing
or underdeveloped countries (poorest countries) are measured by the UN uses the
Human Development Index (HDI) or INDICE DE DESARROLLO HUMANO (IDH)
 GDP AND PERCAPITA INCOME
Gross domestic product (GDP). In Spanish language, PIB o Producto Interior Bruto. The value
(in money terms) of all of a country´s production of goods and services.
Per capita income (renta percápita). If the relationship between GPD and the number of
inhabitants is calculated, the per capita income is calculated.
In developed countries, these indicators are very high, whereas in developing countries are very
low.
 ECONOMY AND TECHNOLOGY
In developed countries: great level of technological development, tertiary sector the most
important economic sector and a large-scales trade.
In developing countries: agriculture is the primary activity and they do not have advanced
technology.
 EDUCATION AND HEALTHCARE
In developed countries: governments guarantees social benefits, such as public education,
health coverage and pensions. However, many inhabitants of developing countries do not have
access to these services. Sometimes, non-governmental organisations provide these services.
 SOCIAL INEQUALITIES
In developed countries, the distribution of wealth is relatively equitable. Most of the population
enjoys a level of purchasing power. On the other hand, there is very unequal distribution of
wealth in developing countries, with a rich minority and a large number of poor people.
The end

UNIT 4

  • 1.
  • 2.
    DEMOGRAPHY STATIC Characteristics of populationat any given time DISTRIBUTION: UNIT 4 STRUCTURE BIOLOGICAL STRUCTURE: age or sex ECONOMIC SITUATION DYNAMIC Population´s evolution over time NATURAL MOVEMENTS MIGRATORY MOVEMENTS
  • 3.
    The Earth isinhabited by over 7.3 billion human beings. However, they are inequalities in population distribution over the Earth´s surface, because different FACTORS: PHYSICAL AND HUMAN.
  • 4.
     FACTORS THATAFFECT POPULATION DISTRIBUTION  PHYSICAL FACTORS › Climate. A suitable temperature favours human settlement. For example, areas with very cold (polar regions) or very high temps (equatorial forest or driest areas: hot deserts) are almost unpopulated. › Topography. Although there are people living in villages located in mountainous areas, with difficult access, people prefer to settle in low-lying areas near the coast and in river valleys. › Soil. The fertility of the soil, which favours the developed of agriculture, has been an important factor. › Water. In areas where water is scare, such as in deserts, the population is usually low.  It means that people tend lo live in temperate climates, areas of low altitude and places near water with fertile soil.
  • 5.
  • 6.
     HUMAN FACTORS Theseare consequences of human actions which attract people to a territory or cause them to leave it. › Political. Decisions made by governments can influence demographic behavior. Ex: policies encouraging or penalizing births, regulating migration or causing citizens to go into exile. › Economic. People usually settle where there is employment, industry and services, such as cities. For example: welfare state (Spain): a lot of public services and quality of life › Technological. Technological advances allow people to alter natural physical factors. For example, agriculture can be developed in previosly arid areas thanks to hydraulic technologies. Example of an anti-natalist policy: China and its one- child policy (until 2015). ¿Why? To reduce population growth, using propaganda posters and penalizing couples who had more than one child.
  • 7.
    › POPULATION DENSITY To analyse the number of people concentrated in an area and compare population sizes, we need to calculate the population density. This indicator allows us to make comparisons between territories or countries of different sizes.  To calculate it, we use the following formula: › Very low population density: below 10 inhabitants/km2 › Low population density: 10-50 inhabitants/km2 › Moderate population density: 50-100 inhabitants/km2 › High population density: over 100 inhabitants/km2 › For example:  Size of Africa = 30.310.000 Km2  Total population = 1.186.000.000 of total population  Population density of Africa = 39, 13 inhabitants/km2
  • 8.
     TOTAL POPULATION:Number of people that live in a particular place. › https://www.saberespractico.com/demografia/paises-por- poblacion-2017/  POPULATION DENSITY: Describes the relationship that exists between the surface area of a place and its population. › https://www.indexmundi.com/g/r.aspx?v=21000&l=es › https://www.saberespractico.com/curiosidades/paises-por- densidad-de-poblacion/ › http://www.expansion.com/economia/2017/02/24/58b01455ca4741 e56f8b458f.html
  • 9.
     On apolitical map of the world you have to stick in your notebook: › Write the name of the ten most populated countries of the world (red color). › Write the name of the ten most densely populated countries or places of the world (blue color).
  • 11.
     ASIA (themost populated) › Almost 60% of the world´s population lives in Asia (Asia ≈ 4393 millones de habitantes (ONU, 2015); 4462 millones (Wikipedia, 2017). › It has high birth rate and control over mortality › Life expectancy has increased to 70 years:  https://es.actualitix.com/pais/asie/asia-del-este-esparanza-de- vida.php › These characteristics mean that the rate of natural increase of the population is 1.1%. › Population density: 140 inhabitants/km2
  • 12.
     AFRICA › Thepopulation of Africa represents the 16.1% of the world´s population (África ≈ 1186 millones de habitantes (ONU, 2015); 1196 millones (Wikipedia, 2017). › It has the highest crude birth rate, but it also has high death rates (especially infant mortality rate). › Life expectancy has increased to 60 years (OMS)  https://es.actualitix.com/pais/afri/africa-esparanza-de-vida.php › In spite of this, Africa has a high rate of natural increase with a young population. › Population density: 39 inhabitants/km2
  • 13.
     AMERICA › Thepopulation of America representing 13.5% of the world´s population (América ≈ 992 millones de habitantes (ONU, 2015); 996 millones (Wikipedia, 2017). › Birth rates and death rates are not very high, so the rate of natural increase is low. › Life expectancy has increased to 75 years:  https://es.actualitix.com/pais/amer/america-esparanza-de-vida.php › Population density: 24 inhabitants/km2
  • 14.
     EUROPE. › Thepopulation of Europe represents 10.04% of the world´s population (Europa ≈ 738 millones de habitantes (ONU, 2015); 744 millones (Wikipedia, 2017). › The rate of natural increase is very low and is negative in some countries (Spain, Bulgaria, Hungary). › Life expectancy: 80 years. › Population density: 32 inhabitants/km2 The most populous country is Russia.
  • 15.
     OCEANIA › Isthe least populated (Oceanía ≈ 39 millones de habitantes (ONU, 2015); 40 millones (Wikipedia, 2017). › Only represent 0.5% of the world´s population. › Its rate natural increase is positive › The population density is very low: 5 inhabitants/km2
  • 16.
     THE DISPROPORTIONBETWEEN GROWTH AND RESOURCES. › In many poor countries, where the population is growing very fast, people go hungry and development is restricted. › These places are the starting point of migration.  THE AGEING POPULATION. › In developed countries, such as Spain, we can talk about an elderly population. It means not only that we have to pay pensions, healthcare and specialist care, but also the productive capacity of society suffers, because if there are fewer births, there are fewer workers. › In many countries with this situation, governments are putting pro-natalist policies into practice.  INEQUALITIES IN DEVELOPMENT › The differences between the developed countries (richest countries) and developing or underdeveloped countries (poorest countries) are measured by the UN uses the Human Development Index (HDI) or INDICE DE DESARROLLO HUMANO (IDH)
  • 17.
     GDP ANDPERCAPITA INCOME Gross domestic product (GDP). In Spanish language, PIB o Producto Interior Bruto. The value (in money terms) of all of a country´s production of goods and services. Per capita income (renta percápita). If the relationship between GPD and the number of inhabitants is calculated, the per capita income is calculated. In developed countries, these indicators are very high, whereas in developing countries are very low.  ECONOMY AND TECHNOLOGY In developed countries: great level of technological development, tertiary sector the most important economic sector and a large-scales trade. In developing countries: agriculture is the primary activity and they do not have advanced technology.  EDUCATION AND HEALTHCARE In developed countries: governments guarantees social benefits, such as public education, health coverage and pensions. However, many inhabitants of developing countries do not have access to these services. Sometimes, non-governmental organisations provide these services.  SOCIAL INEQUALITIES In developed countries, the distribution of wealth is relatively equitable. Most of the population enjoys a level of purchasing power. On the other hand, there is very unequal distribution of wealth in developing countries, with a rich minority and a large number of poor people.
  • 18.