The document discusses several topics related to population density, distribution, and growth rates:
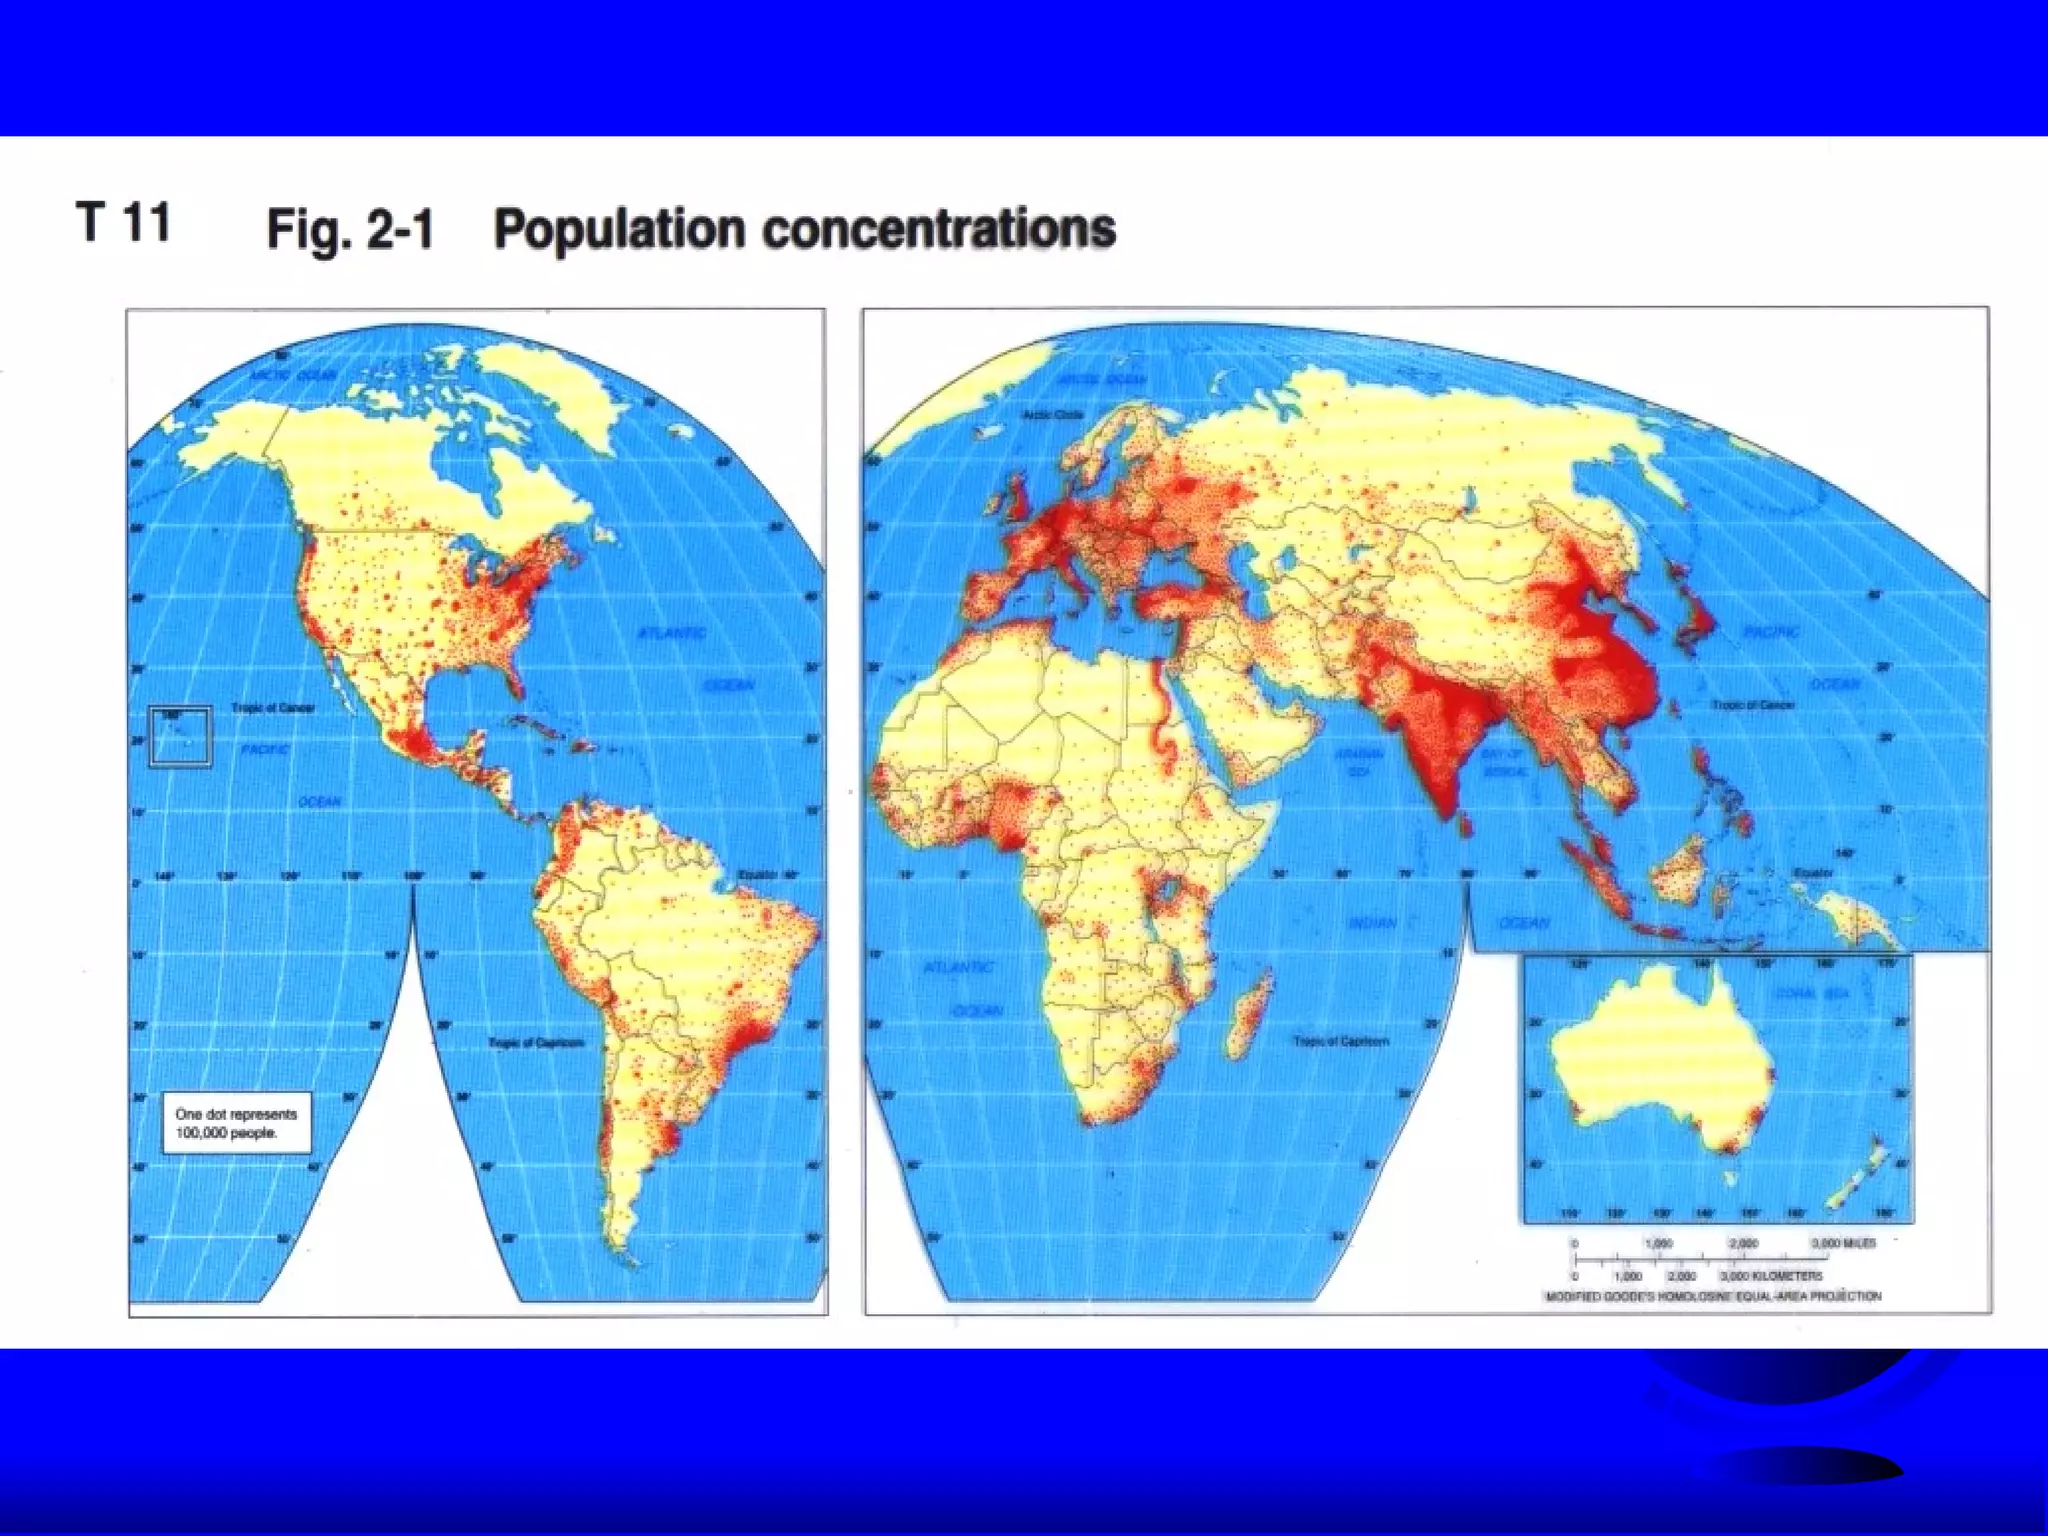
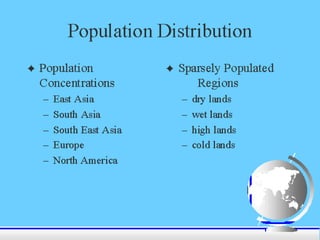
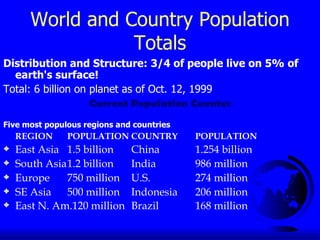
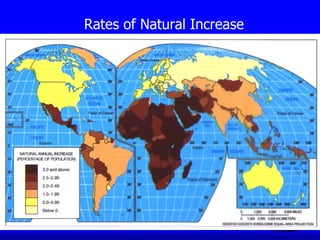
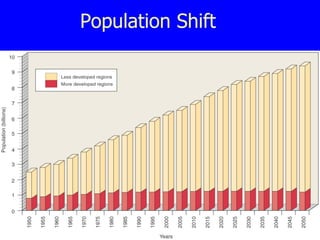
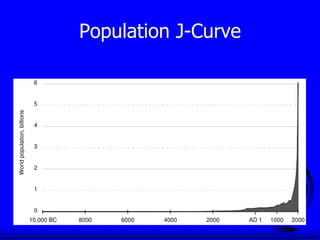
- World population is around 6 billion, with 3/4 living in densely populated areas in East Asia and South Asia. China and India have the largest populations.
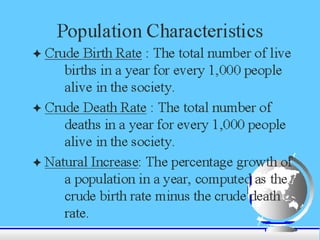
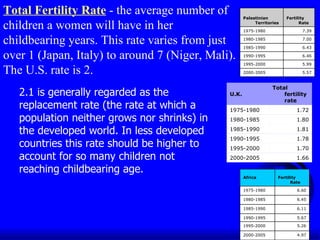
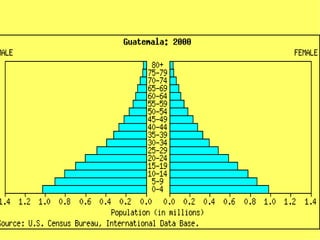
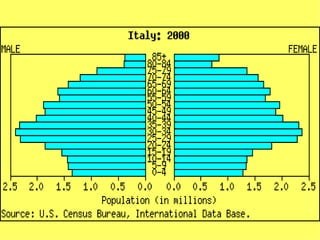
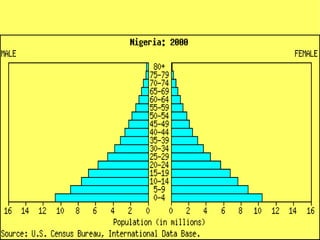
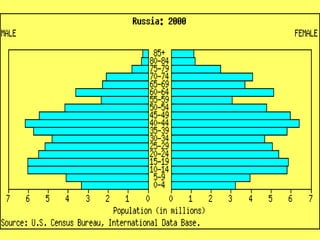
- Total fertility rates vary widely between countries, from over 7 children per woman in Niger and Mali to just over 1 in Italy and Japan. The US rate is 2.5.
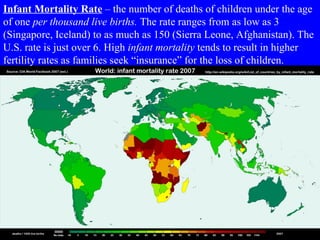
- Infant mortality rates range from 3 per 1000 births in Singapore and Iceland to over 150 in Sierra Leone and Afghanistan. The US rate is just over 6.
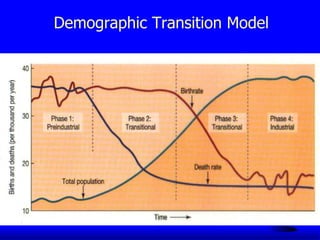
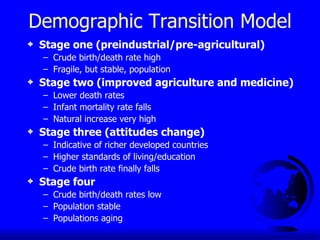
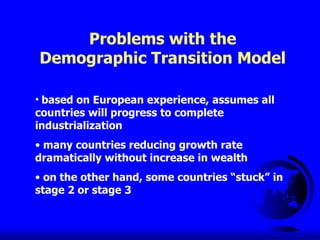
- The demographic transition model outlines four stages of population growth as countries develop from pre-industrial to industrialized economies