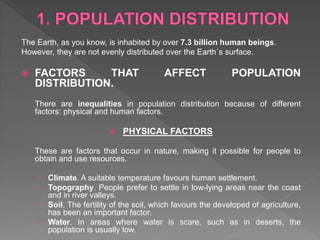
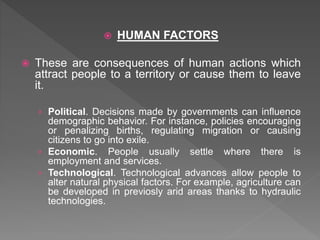
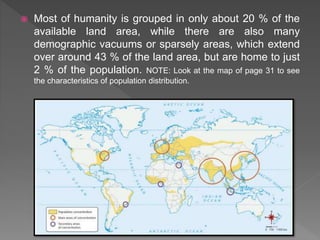
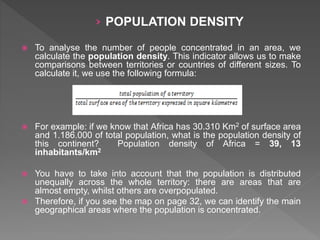
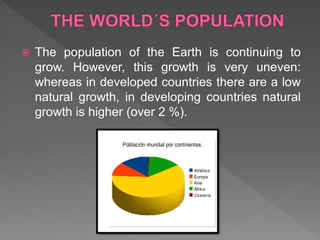
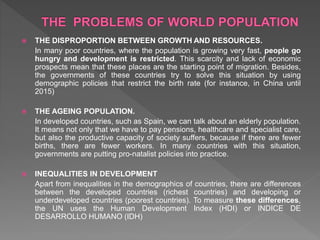
 Billion= mil millones / Billón= un millón de millones
The Earth, as you know, is inhabited by over 7.3 billion human beings.
However, they are not evenly distributed over the Earth´s surface.
 FACTORS THAT AFFECT POPULATION
DISTRIBUTION.
There are inequalities in population distribution because of different
factors: physical and human factors.
 PHYSICAL FACTORS
These are factors that occur in nature, making it possible for people to
obtain and use resources.
› Climate. A suitable temperature favours human settlement.
› Topography. People prefer to settle in low-lying areas near the coast
and in river valleys.
› Soil. The fertility of the soil, which favours the developed of agriculture,
has been an important factor.
› Water. In areas where water is scare, such as in deserts, the
population is usually low.
 HUMAN FACTORS
 These are consequences of human actions which
attract people to a territory or cause them to leave
it.
› Political. Decisions made by governments can influence
demographic behavior. For instance, policies encouraging
or penalizing births, regulating migration or causing
citizens to go into exile.
› Economic. People usually settle where there is
employment and services.
› Technological. Technological advances allow people to
alter natural physical factors. For example, agriculture can
be developed in previosly arid areas thanks to hydraulic
technologies.
 Most of humanity is grouped in only about 20 % of the
available land area, while there are also many
demographic vacuums or sparsely areas, which extend
over around 43 % of the land area, but are home to just
2 % of the population. NOTE: Look at the map of page 31 to see
the characteristics of population distribution.
› POPULATION DENSITY
 To analyse the number of people concentrated in an area, we
calculate the population density. This indicator allows us to make
comparisons between territories or countries of different sizes. To
calculate it, we use the following formula:
 For example: if we know that Africa has 30.310 Km2 of surface area
and 1.186.000 of total population, what is the population density of
this continent? Population density of Africa = 39, 13
inhabitants/km2
 You have to take into account that the population is distributed
unequally across the whole territory: there are areas that are
almost empty, whilst others are overpopulated.
 Therefore, if you see the map on page 32, we can identify the main
geographical areas where the population is concentrated.
 The population of the Earth is continuing to
grow. However, this growth is very uneven:
whereas in developed countries there are a low
natural growth, in developing countries natural
growth is higher (over 2 %).
 THE DISPROPORTION BETWEEN GROWTH AND RESOURCES.
In many poor countries, where the population is growing very fast, people go
hungry and development is restricted. This scarcity and lack of economic
prospects mean that these places are the starting point of migration. Besides,
the governments of these countries try to solve this situation by using
demographic policies that restrict the birth rate (for instance, in China until
2015)
 THE AGEING POPULATION.
In developed countries, such as Spain, we can talk about an elderly population.
It means not only that we have to pay pensions, healthcare and specialist care,
but also the productive capacity of society suffers, because if there are fewer
births, there are fewer workers. In many countries with this situation,
governments are putting pro-natalist policies into practice.
 INEQUALITIES IN DEVELOPMENT
Apart from inequalities in the demographics of countries, there are differences
between the developed countries (richest countries) and developing or
underdeveloped countries (poorest countries). To measure these differences,
the UN uses the Human Development Index (HDI) or INDICE DE
DESARROLLO HUMANO (IDH)
 GDP AND PERCAPITA INCOME
Gross domestic product (GDP). In Spanish language, PIB o Producto Interior Bruto. The value
(in money terms) of all of a country´s production of goods and services.
Per capita income (renta percápita). If the relationship between GPD and the number of
inhabitants is calculated, the per capita income is calculated.
In developed countries, these indicators are very high, whereas in developing countries are very
low.
 ECONOMY AND TECHNOLOGY
In developed countries: great level of technological development, tertiary sector the most
important economic sector and a large-scales trade.
In developing countries: agriculture is the primary activity and they do not have advanced
technology.
 EDUCATION AND HEALTHCARE
In developed countries: governments guarantees social benefits, such as public education,
health coverage and pensions. However, many inhabitants of developing countries do not have
access to these services. Sometimes, non-governmental organisations provide these services.
 SOCIAL INEQUALITIES
In developed countries, the distribution of wealth is relatively equitable. Most of the population
enjoys a level of purchasing power. On the other hand, there is very unequal distribution of
wealth in developing countries, with a rich minority and a large number of poor people.
The end

Unit 3

  • 2.
     Billion= milmillones / Billón= un millón de millones
  • 3.
    The Earth, asyou know, is inhabited by over 7.3 billion human beings. However, they are not evenly distributed over the Earth´s surface.  FACTORS THAT AFFECT POPULATION DISTRIBUTION. There are inequalities in population distribution because of different factors: physical and human factors.  PHYSICAL FACTORS These are factors that occur in nature, making it possible for people to obtain and use resources. › Climate. A suitable temperature favours human settlement. › Topography. People prefer to settle in low-lying areas near the coast and in river valleys. › Soil. The fertility of the soil, which favours the developed of agriculture, has been an important factor. › Water. In areas where water is scare, such as in deserts, the population is usually low.
  • 4.
     HUMAN FACTORS These are consequences of human actions which attract people to a territory or cause them to leave it. › Political. Decisions made by governments can influence demographic behavior. For instance, policies encouraging or penalizing births, regulating migration or causing citizens to go into exile. › Economic. People usually settle where there is employment and services. › Technological. Technological advances allow people to alter natural physical factors. For example, agriculture can be developed in previosly arid areas thanks to hydraulic technologies.
  • 5.
     Most ofhumanity is grouped in only about 20 % of the available land area, while there are also many demographic vacuums or sparsely areas, which extend over around 43 % of the land area, but are home to just 2 % of the population. NOTE: Look at the map of page 31 to see the characteristics of population distribution.
  • 6.
    › POPULATION DENSITY To analyse the number of people concentrated in an area, we calculate the population density. This indicator allows us to make comparisons between territories or countries of different sizes. To calculate it, we use the following formula:  For example: if we know that Africa has 30.310 Km2 of surface area and 1.186.000 of total population, what is the population density of this continent? Population density of Africa = 39, 13 inhabitants/km2  You have to take into account that the population is distributed unequally across the whole territory: there are areas that are almost empty, whilst others are overpopulated.  Therefore, if you see the map on page 32, we can identify the main geographical areas where the population is concentrated.
  • 7.
     The populationof the Earth is continuing to grow. However, this growth is very uneven: whereas in developed countries there are a low natural growth, in developing countries natural growth is higher (over 2 %).
  • 8.
     THE DISPROPORTIONBETWEEN GROWTH AND RESOURCES. In many poor countries, where the population is growing very fast, people go hungry and development is restricted. This scarcity and lack of economic prospects mean that these places are the starting point of migration. Besides, the governments of these countries try to solve this situation by using demographic policies that restrict the birth rate (for instance, in China until 2015)  THE AGEING POPULATION. In developed countries, such as Spain, we can talk about an elderly population. It means not only that we have to pay pensions, healthcare and specialist care, but also the productive capacity of society suffers, because if there are fewer births, there are fewer workers. In many countries with this situation, governments are putting pro-natalist policies into practice.  INEQUALITIES IN DEVELOPMENT Apart from inequalities in the demographics of countries, there are differences between the developed countries (richest countries) and developing or underdeveloped countries (poorest countries). To measure these differences, the UN uses the Human Development Index (HDI) or INDICE DE DESARROLLO HUMANO (IDH)
  • 9.
     GDP ANDPERCAPITA INCOME Gross domestic product (GDP). In Spanish language, PIB o Producto Interior Bruto. The value (in money terms) of all of a country´s production of goods and services. Per capita income (renta percápita). If the relationship between GPD and the number of inhabitants is calculated, the per capita income is calculated. In developed countries, these indicators are very high, whereas in developing countries are very low.  ECONOMY AND TECHNOLOGY In developed countries: great level of technological development, tertiary sector the most important economic sector and a large-scales trade. In developing countries: agriculture is the primary activity and they do not have advanced technology.  EDUCATION AND HEALTHCARE In developed countries: governments guarantees social benefits, such as public education, health coverage and pensions. However, many inhabitants of developing countries do not have access to these services. Sometimes, non-governmental organisations provide these services.  SOCIAL INEQUALITIES In developed countries, the distribution of wealth is relatively equitable. Most of the population enjoys a level of purchasing power. On the other hand, there is very unequal distribution of wealth in developing countries, with a rich minority and a large number of poor people.
  • 10.