Population dynamics
• LessonObjectives:
• Understand the concept of population
dynamics.
• Analyze how populations of organisms change
over time.
3.
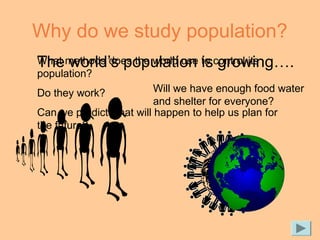
Why do westudy population?
The world’s population is growing….
Will we have enough food water
and shelter for everyone?
What methods does the world use to control its
population?
Do they work?
Can we predict what will happen to help us plan for
the future?
Population distribution
• Keywords and definitions
Population density – The number of people
per square km
Dense – Many people per square km
Sparse – Few people per square km
Distribution – How people are spread out
6.
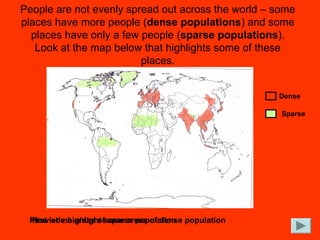
People are notevenly spread out across the world – some
places have more people (dense populations) and some
places have only a few people (sparse populations).
Look at the map below that highlights some of these
places.
First let’s highlight some areas of dense population
Now some areas of sparse population
Dense
Sparse
7.
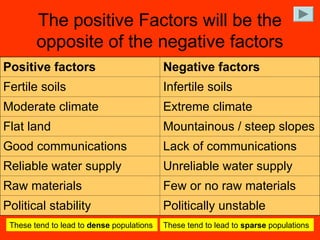
The positive Factorswill be the
opposite of the negative factors
Positive factors Negative factors
Fertile soils Infertile soils
Moderate climate Extreme climate
Flat land Mountainous / steep slopes
Good communications Lack of communications
Reliable water supply Unreliable water supply
Raw materials Few or no raw materials
Political stability Politically unstable
These tend to lead to dense populations These tend to lead to sparse populations
8.
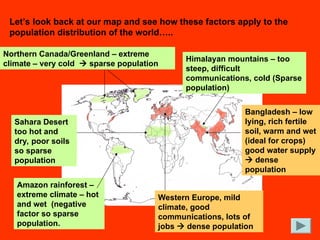
Let’s look backat our map and see how these factors apply to the
population distribution of the world…..
Amazon rainforest –
extreme climate – hot
and wet (negative
factor so sparse
population.
Northern Canada/Greenland – extreme
climate – very cold sparse population
Sahara Desert
too hot and
dry, poor soils
so sparse
population
Himalayan mountains – too
steep, difficult
communications, cold (Sparse
population)
Bangladesh – low
lying, rich fertile
soil, warm and wet
(ideal for crops)
good water supply
dense
population
Western Europe, mild
climate, good
communications, lots of
jobs dense population
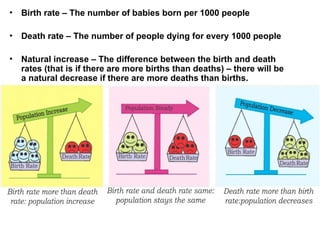
• Birth rate– The number of babies born per 1000 people
• Death rate – The number of people dying for every 1000 people
• Natural increase – The difference between the birth and death
rates (that is if there are more births than deaths) – there will be
a natural decrease if there are more deaths than births.
11.
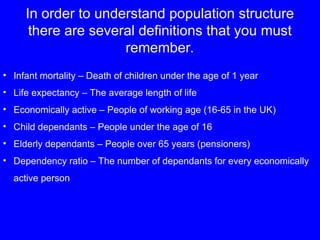
In order tounderstand population structure
there are several definitions that you must
remember.
• Infant mortality – Death of children under the age of 1 year
• Life expectancy – The average length of life
• Economically active – People of working age (16-65 in the UK)
• Child dependants – People under the age of 16
• Elderly dependants – People over 65 years (pensioners)
• Dependency ratio – The number of dependants for every economically
active person
12.
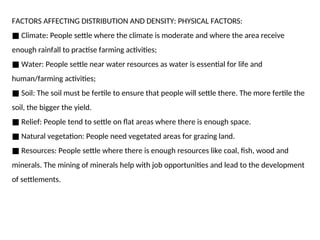
FACTORS AFFECTING DISTRIBUTIONAND DENSITY: PHYSICAL FACTORS:
■ Climate: People settle where the climate is moderate and where the area receive
enough rainfall to practise farming activities;
■ Water: People settle near water resources as water is essential for life and
human/farming activities;
■ Soil: The soil must be fertile to ensure that people will settle there. The more fertile the
soil, the bigger the yield.
■ Relief: People tend to settle on flat areas where there is enough space.
■ Natural vegetation: People need vegetated areas for grazing land.
■ Resources: People settle where there is enough resources like coal, fish, wood and
minerals. The mining of minerals help with job opportunities and lead to the development
of settlements.
13.
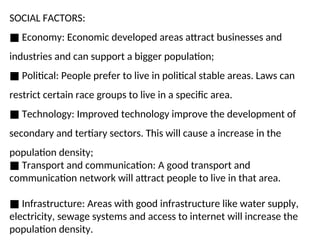
SOCIAL FACTORS:
■ Economy:Economic developed areas attract businesses and
industries and can support a bigger population;
■ Political: People prefer to live in political stable areas. Laws can
restrict certain race groups to live in a specific area.
■ Technology: Improved technology improve the development of
secondary and tertiary sectors. This will cause a increase in the
population density;
■ Transport and communication: A good transport and
communication network will attract people to live in that area.
■ Infrastructure: Areas with good infrastructure like water supply,
electricity, sewage systems and access to internet will increase the
population density.
14.
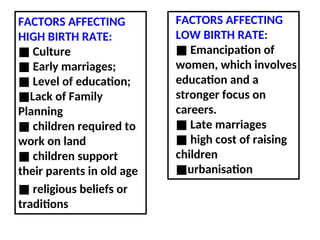
FACTORS AFFECTING
HIGH BIRTHRATE:
■ Culture
■ Early marriages;
■ Level of education;
■Lack of Family
Planning
■ children required to
work on land
■ children support
their parents in old age
■ religious beliefs or
traditions
FACTORS AFFECTING
LOW BIRTH RATE:
■ Emancipation of
women, which involves
education and a
stronger focus on
careers.
■ Late marriages
■ high cost of raising
children
■urbanisation
15.
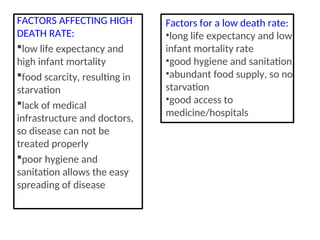
FACTORS AFFECTING HIGH
DEATHRATE:
low life expectancy and
high infant mortality
food scarcity, resulting in
starvation
lack of medical
infrastructure and doctors,
so disease can not be
treated properly
poor hygiene and
sanitation allows the easy
spreading of disease
Factors for a low death rate:
•long life expectancy and low
infant mortality rate
•good hygiene and sanitation
•abundant food supply, so no
starvation
•good access to
medicine/hospitals
16.
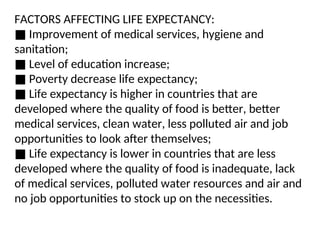
FACTORS AFFECTING LIFEEXPECTANCY:
■ Improvement of medical services, hygiene and
sanitation;
■ Level of education increase;
■ Poverty decrease life expectancy;
■ Life expectancy is higher in countries that are
developed where the quality of food is better, better
medical services, clean water, less polluted air and job
opportunities to look after themselves;
■ Life expectancy is lower in countries that are less
developed where the quality of food is inadequate, lack
of medical services, polluted water resources and air and
no job opportunities to stock up on the necessities.
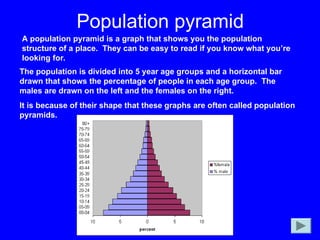
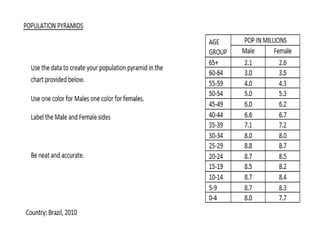
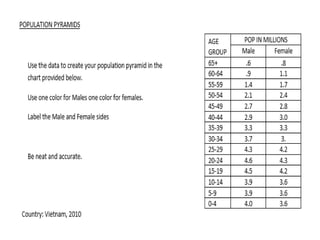
Population pyramid
A populationpyramid is a graph that shows you the population
structure of a place. They can be easy to read if you know what you’re
looking for.
The population is divided into 5 year age groups and a horizontal bar
drawn that shows the percentage of people in each age group. The
males are drawn on the left and the females on the right.
It is because of their shape that these graphs are often called population
pyramids.
19.
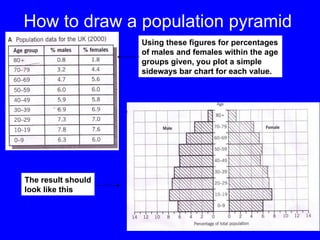
How to drawa population pyramid
Using these figures for percentages
of males and females within the age
groups given, you plot a simple
sideways bar chart for each value.
The result should
look like this
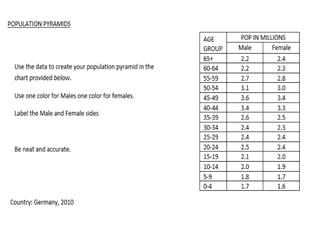
20.
Steps to reada population pyramid
• Note the title – are you looking at a whole country
or a special part of one eg. Rural or urban
populations
• Look at the general shape
• Note the proportions of the working population and
the elderly and child dependants (ages 17-65,
above 65 and 0-16)
• Look at the height of the pyramid (indicates life
expectancy)
• Look at the sex ratio (the proportion of males to
females)
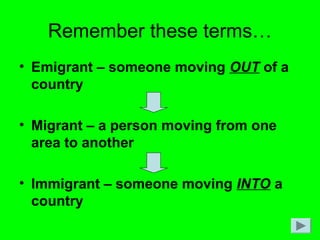
Remember these terms…
•Emigrant – someone moving OUT of a
country
• Migrant – a person moving from one
area to another
• Immigrant – someone moving INTO a
country
26.
Migration can beclassified by
distance
• International migration – when people
move from one country to another
• Regional migration – when people move
to another region inside the same country
• Local migration – when people move a
short distance within the same region
27.
Migration can alsobe classified by
reason or timescale…
• Migration may be forced or voluntary
• Migration may be temporary or permanent
Remember migration will affect both the area the
migrants come from as well as the are they are going to.
28.
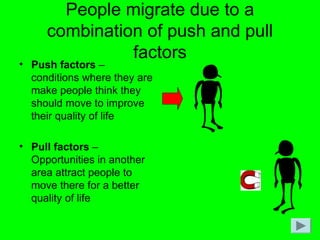
People migrate dueto a
combination of push and pull
factors
• Push factors –
conditions where they are
make people think they
should move to improve
their quality of life
• Pull factors –
Opportunities in another
area attract people to
move there for a better
quality of life
29.
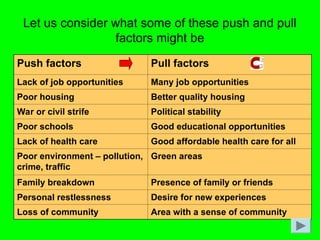
Let us considerwhat some of these push and pull
factors might be
Push factors Pull factors
Lack of job opportunities Many job opportunities
Poor housing Better quality housing
War or civil strife Political stability
Poor schools Good educational opportunities
Lack of health care Good affordable health care for all
Poor environment – pollution,
crime, traffic
Green areas
Family breakdown Presence of family or friends
Personal restlessness Desire for new experiences
Loss of community Area with a sense of community
30.
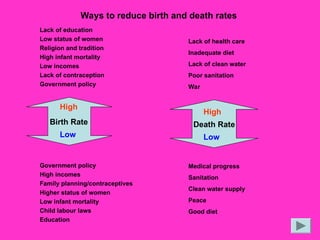
Ways to reducebirth and death rates
Lack of education
Low status of women
Religion and tradition
High infant mortality
Low incomes
Lack of contraception
Government policy
Government policy
High incomes
Family planning/contraceptives
Higher status of women
Low infant mortality
Child labour laws
Education
Birth Rate
High
Low
Death Rate
High
Low
Lack of health care
Inadequate diet
Lack of clean water
Poor sanitation
War
Medical progress
Sanitation
Clean water supply
Peace
Good diet