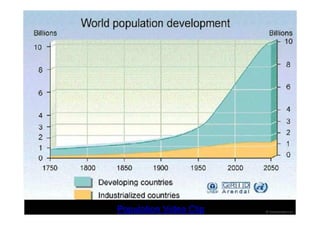
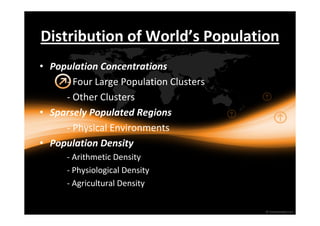
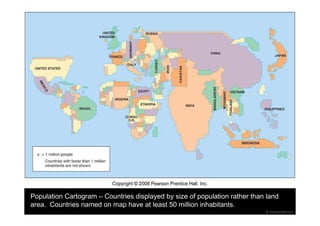
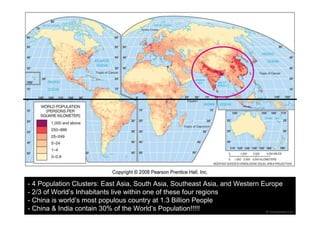
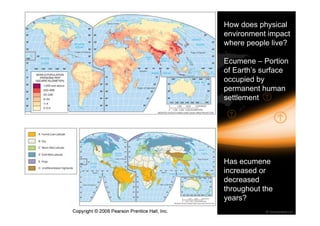
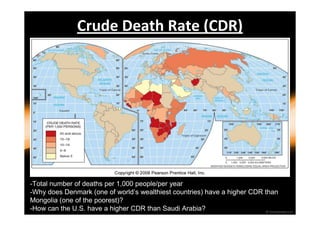
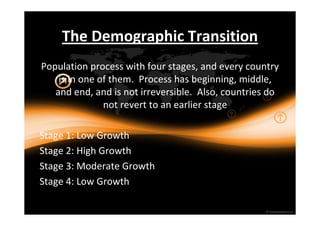
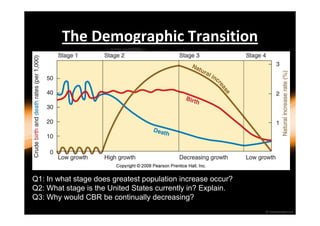
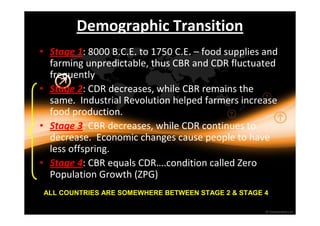
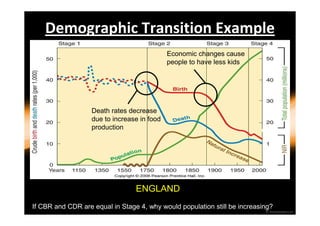
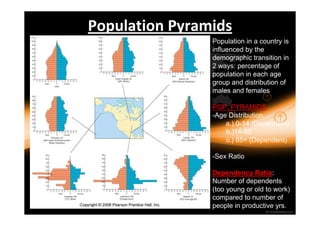
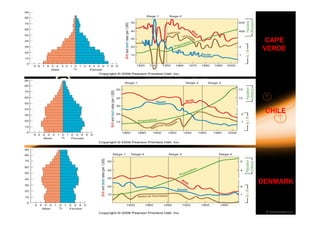
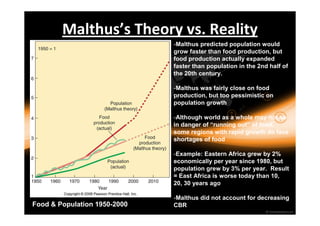
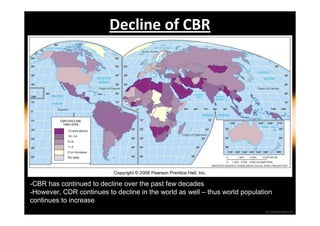
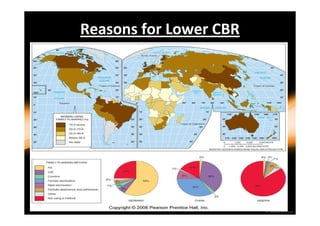
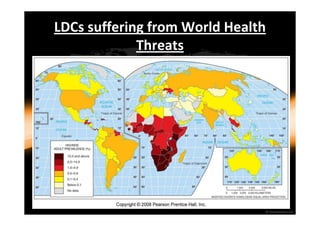
Rubenstein Ch. 2 
Population
Icebreaker – Imagining Billions 
Q1: The equator stretches approx. 25,000 miles 
around Earth. If each of the world’s 6.8 billion 
people was allotted 1 yard of space. How many 
times would the current human population circle 
the globe? (Hint: 1,760 yards = 1 mile) 
Q2: If a human, beginning at birth, started to count 
to world’s population. How many years would it 
take him to count all 6.8 billion people? (Note: 
For each second he/she would count one 
person)
Key Issues 
1.) Where is the world’s population distributed? 
2.) Where has the world’s population increased? 
3.) Why is overpopulation increasing at different rates 
in different countries? 
4.) Why might the world face an overpopulation 
problem?
Population Video Clip
Distribution of World’s Population 
• Population Concentrations 
- Four Large Population Clusters 
- Other Clusters 
• Sparsely Populated Regions 
- Physical Environments 
• Population Density 
- Arithmetic Density 
- Physiological Density 
- Agricultural Density
Population Cartogram – Countries displayed by size of population rather than land 
area. Countries named on map have at least 50 million inhabitants.
- 4 Population Clusters: East Asia, South Asia, Southeast Asia, and Western Europe 
- 2/3 of World’s Inhabitants live within one of these four regions 
- China is world’s most populous country at 1.3 Billion People 
- China & India contain 30% of the World’s Population!!!!!
How does physical 
environment impact 
where people live? 
Ecumene – Portion 
of Earth’s surface 
occupied by 
permanent human 
settlement 
Has ecumene 
increased or 
decreased 
throughout the 
years?
ECUMENE
Population Density 
• Arithmetic Density – Total number of people 
divided by total land area. 
• Physiological Density – Number of people 
supported by a unit of arable land. 
• Agricultural Density – Ratio of number of 
farmers to amount of arable land.
Arithmetic Density 
What is 
odd 
About 
Russia? 
-Population / Land Area = Arithmetic Density (Population Density) 
-Brazil 200,000,000 / 8,500,000 = 23.5 Arithmetic Density (23.5 persons per square 
kilometer 
-Measures how densely or sparsely populated a region is
Physiological Density 
-The higher the physiological density, the greater pressure that people may place on 
the land to produce enough food 
-Egypt has an arithmetic density of 75, but physiological density is 2,580…..why??? 
-95% of population lives within Nile River Valley (small area)
Distribution of World Population Growth 
• Natural Increase Rate 
– CBR (Crude Birth Rate) 
– CDR (Crude Death Rate) 
• Fertility 
– TFR (Total Fertility Rate) 
• Mortality 
– IMR (Infant Mortality Rate) 
– Life Expectancy
Natural Increase Rate (NIR) 
-Current NIR in world is 1.2, meaning population of world is growing 1.2% each year 
-1.2% of 6.5 billion is approx. 80 million (equivalent to pop. of Germany) 
-Increase of the NIR to 2% would result in world pop. increasing 132 million each year 
-Majority of natural increase is occurring in LDCs (Less Developed Countries) 
-Less resources in LDCs mean it’s harder to maintain population
Total Fertility Rates (TFR) 
-Avg. number of children a woman will have in her childbearing years (15-49) 
-Varies significantly between MDCs and LDCs 
-All European nations below 2.0 
-China controlling TFR by issuing 1-child policy
Infant Mortality Rates (IMR) 
-Number of deaths of infants under 1 year of age 
-Reflects a country’s health care system 
-Varies significantly between MDCs and LDCs
Crude Death Rate (CDR) 
-Total number of deaths per 1,000 people/per year 
-Why does Denmark (one of world’s wealthiest countries) have a higher CDR than 
Mongolia (one of the poorest)? 
-How can the U.S. have a higher CDR than Saudi Arabia?
The Demographic Transition 
Population process with four stages, and every country 
is in one of them. Process has beginning, middle, 
and end, and is not irreversible. Also, countries do 
not revert to an earlier stage 
Stage 1: Low Growth 
Stage 2: High Growth 
Stage 3: Moderate Growth 
Stage 4: Low Growth
The Demographic Transition 
Q1: In what stage does greatest population increase occur? 
Q2: What stage is the United States currently in? Explain. 
Q3: Why would CBR be continually decreasing?
Demographic Transition 
• Stage 1: 8000 B.C.E. to 1750 C.E. – food supplies and 
farming unpredictable, thus CBR and CDR fluctuated 
frequently 
• Stage 2: CDR decreases, while CBR remains the 
same. Industrial Revolution helped farmers increase 
food production. 
• Stage 3: CBR decreases, while CDR continues to 
decrease. Economic changes cause people to have 
less offspring. 
• Stage 4: CBR equals CDR….condition called Zero 
Population Growth (ZPG) 
ALL COUNTRIES ARE SOMEWHERE BETWEEN STAGE 2 & STAGE 4
Demographic Transition Example 
Death rates decrease 
due to increase in food 
production 
Economic changes cause 
people to have less kids 
ENGLAND 
If CBR and CDR are equal in Stage 4, why would population still be increasing?
Population Pyramids 
Population in a country is 
influenced by the 
demographic transition in 
2 ways: percentage of 
population in each age 
group and distribution of 
males and females 
POP. PYRAMIDS 
-Age Distribution 
a.) 0-14 (Dependent) 
b.)14-65 
c.) 65+ (Dependent) 
-Sex Ratio 
Dependency Ratio: 
Number of dependents 
(too young or old to work) 
compared to number of 
people in productive yrs.
CAPE 
VERDE 
CHILE 
DENMARK
Will World Face an Overpopulation 
Problem? 
• Thomas Malthus on Overpopulation 
- Malthus’s Theory 
- Malthus Critics 
• Declining Birth Rates 
- Malthus Theory vs. Reality 
- Reasons for Decline 
• World Health Threats 
- Epidemiological Transition Stages
Malthus’s Theory vs. Reality 
Food & Population 1950-2000 
-Malthus predicted population would 
grow faster than food production, but 
food production actually expanded 
faster than population in the 2nd half of 
the 20th century. 
-Malthus was fairly close on food 
production, but too pessimistic on 
population growth 
-Although world as a whole may not be 
in danger of “running out” of food, 
some regions with rapid growth do face 
shortages of food 
-Example: Eastern Africa grew by 2% 
economically per year since 1980, but 
population grew by 3% per year. Result 
= East Africa is worse today than 10, 
20, 30 years ago 
-Malthus did not account for decreasing 
CBR
Decline of CBR 
-CBR has continued to decline over the past few decades 
-However, CDR continues to decline in the world as well – thus world population 
continues to increase
Reasons for Lower CBR
LDCs suffering from World Health 
Threats

Rubenstein ch 2_notes

  • 1.
    Rubenstein Ch. 2 Population
  • 2.
    Icebreaker – ImaginingBillions Q1: The equator stretches approx. 25,000 miles around Earth. If each of the world’s 6.8 billion people was allotted 1 yard of space. How many times would the current human population circle the globe? (Hint: 1,760 yards = 1 mile) Q2: If a human, beginning at birth, started to count to world’s population. How many years would it take him to count all 6.8 billion people? (Note: For each second he/she would count one person)
  • 3.
    Key Issues 1.)Where is the world’s population distributed? 2.) Where has the world’s population increased? 3.) Why is overpopulation increasing at different rates in different countries? 4.) Why might the world face an overpopulation problem?
  • 4.
  • 5.
    Distribution of World’sPopulation • Population Concentrations - Four Large Population Clusters - Other Clusters • Sparsely Populated Regions - Physical Environments • Population Density - Arithmetic Density - Physiological Density - Agricultural Density
  • 6.
    Population Cartogram –Countries displayed by size of population rather than land area. Countries named on map have at least 50 million inhabitants.
  • 7.
    - 4 PopulationClusters: East Asia, South Asia, Southeast Asia, and Western Europe - 2/3 of World’s Inhabitants live within one of these four regions - China is world’s most populous country at 1.3 Billion People - China & India contain 30% of the World’s Population!!!!!
  • 8.
    How does physical environment impact where people live? Ecumene – Portion of Earth’s surface occupied by permanent human settlement Has ecumene increased or decreased throughout the years?
  • 9.
  • 10.
    Population Density •Arithmetic Density – Total number of people divided by total land area. • Physiological Density – Number of people supported by a unit of arable land. • Agricultural Density – Ratio of number of farmers to amount of arable land.
  • 11.
    Arithmetic Density Whatis odd About Russia? -Population / Land Area = Arithmetic Density (Population Density) -Brazil 200,000,000 / 8,500,000 = 23.5 Arithmetic Density (23.5 persons per square kilometer -Measures how densely or sparsely populated a region is
  • 12.
    Physiological Density -Thehigher the physiological density, the greater pressure that people may place on the land to produce enough food -Egypt has an arithmetic density of 75, but physiological density is 2,580…..why??? -95% of population lives within Nile River Valley (small area)
  • 13.
    Distribution of WorldPopulation Growth • Natural Increase Rate – CBR (Crude Birth Rate) – CDR (Crude Death Rate) • Fertility – TFR (Total Fertility Rate) • Mortality – IMR (Infant Mortality Rate) – Life Expectancy
  • 14.
    Natural Increase Rate(NIR) -Current NIR in world is 1.2, meaning population of world is growing 1.2% each year -1.2% of 6.5 billion is approx. 80 million (equivalent to pop. of Germany) -Increase of the NIR to 2% would result in world pop. increasing 132 million each year -Majority of natural increase is occurring in LDCs (Less Developed Countries) -Less resources in LDCs mean it’s harder to maintain population
  • 15.
    Total Fertility Rates(TFR) -Avg. number of children a woman will have in her childbearing years (15-49) -Varies significantly between MDCs and LDCs -All European nations below 2.0 -China controlling TFR by issuing 1-child policy
  • 16.
    Infant Mortality Rates(IMR) -Number of deaths of infants under 1 year of age -Reflects a country’s health care system -Varies significantly between MDCs and LDCs
  • 17.
    Crude Death Rate(CDR) -Total number of deaths per 1,000 people/per year -Why does Denmark (one of world’s wealthiest countries) have a higher CDR than Mongolia (one of the poorest)? -How can the U.S. have a higher CDR than Saudi Arabia?
  • 18.
    The Demographic Transition Population process with four stages, and every country is in one of them. Process has beginning, middle, and end, and is not irreversible. Also, countries do not revert to an earlier stage Stage 1: Low Growth Stage 2: High Growth Stage 3: Moderate Growth Stage 4: Low Growth
  • 19.
    The Demographic Transition Q1: In what stage does greatest population increase occur? Q2: What stage is the United States currently in? Explain. Q3: Why would CBR be continually decreasing?
  • 20.
    Demographic Transition •Stage 1: 8000 B.C.E. to 1750 C.E. – food supplies and farming unpredictable, thus CBR and CDR fluctuated frequently • Stage 2: CDR decreases, while CBR remains the same. Industrial Revolution helped farmers increase food production. • Stage 3: CBR decreases, while CDR continues to decrease. Economic changes cause people to have less offspring. • Stage 4: CBR equals CDR….condition called Zero Population Growth (ZPG) ALL COUNTRIES ARE SOMEWHERE BETWEEN STAGE 2 & STAGE 4
  • 21.
    Demographic Transition Example Death rates decrease due to increase in food production Economic changes cause people to have less kids ENGLAND If CBR and CDR are equal in Stage 4, why would population still be increasing?
  • 22.
    Population Pyramids Populationin a country is influenced by the demographic transition in 2 ways: percentage of population in each age group and distribution of males and females POP. PYRAMIDS -Age Distribution a.) 0-14 (Dependent) b.)14-65 c.) 65+ (Dependent) -Sex Ratio Dependency Ratio: Number of dependents (too young or old to work) compared to number of people in productive yrs.
  • 23.
  • 24.
    Will World Facean Overpopulation Problem? • Thomas Malthus on Overpopulation - Malthus’s Theory - Malthus Critics • Declining Birth Rates - Malthus Theory vs. Reality - Reasons for Decline • World Health Threats - Epidemiological Transition Stages
  • 25.
    Malthus’s Theory vs.Reality Food & Population 1950-2000 -Malthus predicted population would grow faster than food production, but food production actually expanded faster than population in the 2nd half of the 20th century. -Malthus was fairly close on food production, but too pessimistic on population growth -Although world as a whole may not be in danger of “running out” of food, some regions with rapid growth do face shortages of food -Example: Eastern Africa grew by 2% economically per year since 1980, but population grew by 3% per year. Result = East Africa is worse today than 10, 20, 30 years ago -Malthus did not account for decreasing CBR
  • 26.
    Decline of CBR -CBR has continued to decline over the past few decades -However, CDR continues to decline in the world as well – thus world population continues to increase
  • 27.
  • 29.
    LDCs suffering fromWorld Health Threats