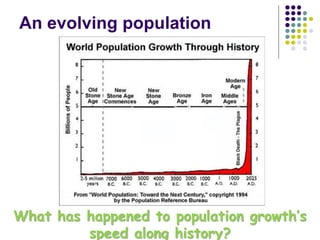
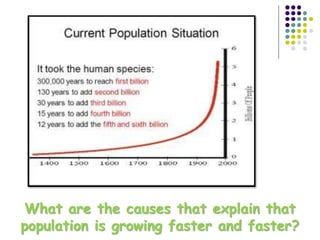
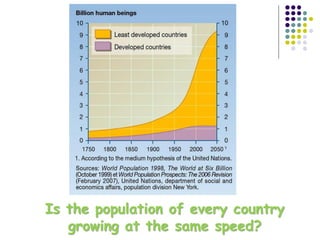
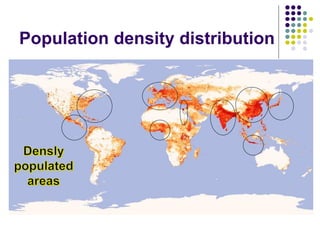
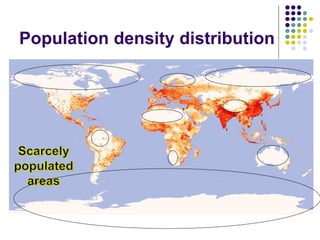
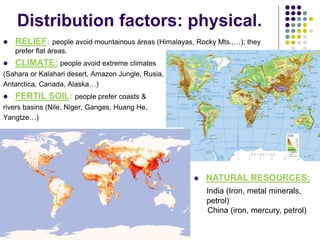
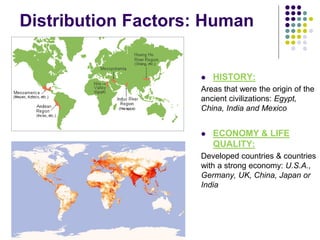
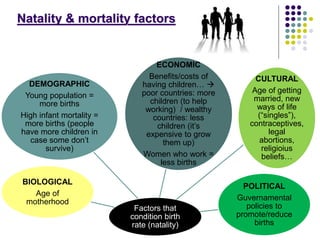
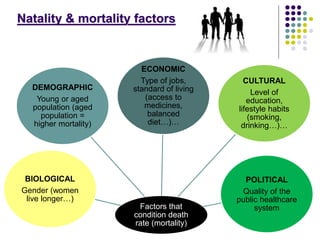
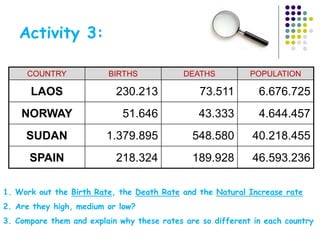
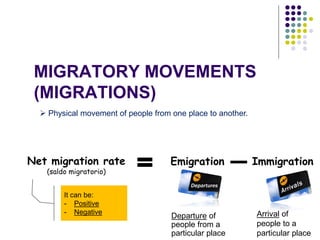
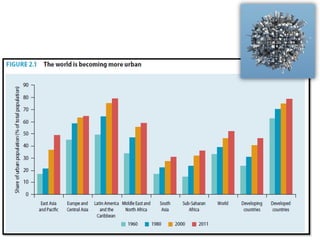
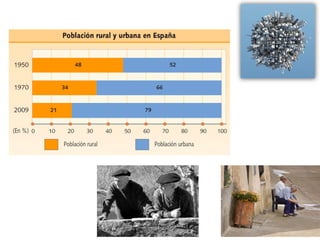
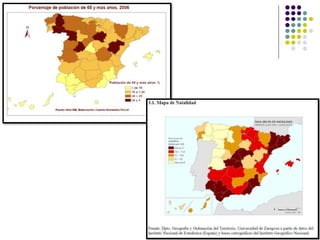
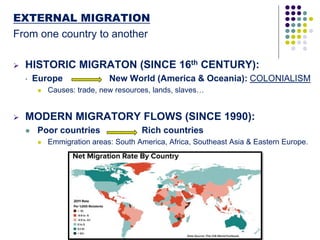
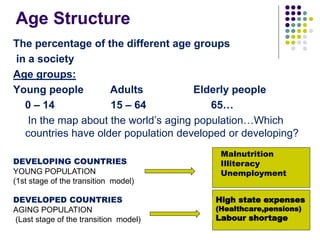
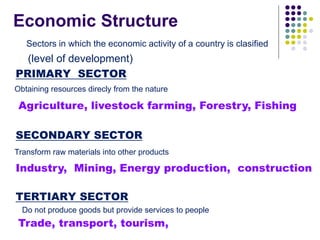
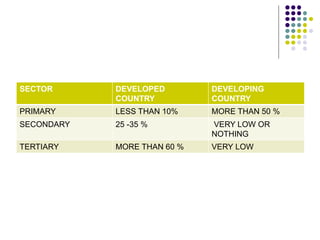
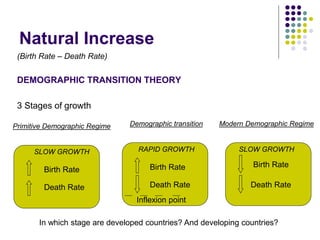
3. Demo (from Ancient
Greek δῆμος demos
= "the people“)
Graphy (from Ancient
Greek γράφω graphō,
= “description, writing
or measurement”)
4. POPULATION = inhabitants in a territory.
Which science study population?
DEMOGRAPHY: the study of the development, distribution, births, deaths &
changing structures of human population.
Demography uses periodical CENSUSES
to calculate the population in a territory.
https://www.youtube.com/watch?v=_6Jd5XZw_ZQ
5. Why is geography interested in population?
Geography is interested in the relationship between a geographical place and
the people living there and how the human being has an effect on the space.
The main aspects to study are :
•Population distribution and population density
•Natural population movements: birth & death rate.
•The Natural increase through history (Demographyc transition theory)
•The demographic structure: characteristics of the population (age
& gender).
•Migratory movements
10. What was the population in 2012? And
what will it be in 2048? What will be
the consequences of this growth?
11.
12.
13.
14. But… if we slow down the birth rate,
what’s going to happen?!! Problems??
15. Population distribution
Current world’s population is about 7.178 millions people but the
distribution is not equal, so to analyze the population we need to
know…
The Population density: the relationship between the number
of inhabitants in a place & the surface area that it occupies (km2).
Total population
Surface Km2
= people/Km2
High = >100
Medium = 50 – 100
Low = 25- 50
Very low = < 25
16. Activity 1: Calculate the
population density…
http://www.nationsonline.org
COUNTRY INHABITANTS AREA POPULATION
DENSITY
RATE
NEW
ZELAND
4,434,000 270,467 km²
ETHIOPIA 84,321,000 1,126,829 km²
IRAQ 33,330,000 438,317 km²
SPAIN 46,185,000 506.000 km²
FRANCE 65,350,000 551,500 km²
17. SOLUTION
COUNTRY INHABITANTS AREA POPULATION
DENSITY
RATE
NEW
ZELAND
4,434,000 270,467 km² 16.4 Very low
ETHIOPIA 84,321,000 1,126,829 km² 74.8 Medium
IRAQ 33,330,000 438,317 km² 76 Medium
SPAIN 46,185,000 506.000 km² 91 Medium
FRANCE 65,350,000 551,500 km² 118 High
20. Distribution factors: physical.
RELIEF: people avoid mountainous áreas (Himalayas, Rocky Mts.,…); they
prefer flat áreas.
CLIMATE: people avoid extreme climates
(Sahara or Kalahari desert, Amazon Jungle, Rusia,
Antarctica, Canada, Alaska…)
FERTIL SOIL: people prefer coasts &
rivers basins (Nile, Niger, Ganges, Huang He,
Yangtze…)
NATURAL RESOURCES:
India (Iron, metal minerals,
petrol)
China (iron, mercury, petrol)
21. Distribution Factors: Human
HISTORY:
Areas that were the origin of the
ancient civilizations: Egypt,
China, India and Mexico
ECONOMY & LIFE
QUALITY:
Developed countries & countries
with a strong economy: U.S.A.,
Germany, UK, China, Japan or
India
22. Richest Countries (GDP) Gross Domestic Products (the goods and
services produced by the country)
23. Activity 2: work in pairs
A) What is the density of population?
B) Look for the 10 most populated countries in the world:
• Calculate their population density.
• Locate them in the blank map.
C) Calculate the population density of:
- Australia - Monaco
- Canada - Vatican city
- Argentina - Malta
- Saudi Arabia - Singapore
D) Compare the population densities of the countries in
activities B & C and draw some conclusions.
26. Nº Births Nº Deaths
NATURAL
POPULATION
MOVEMENT
Natural increase
(crecimiento natural / vegetativo)
It can be:
- Positive growth
- Negative growth
27. Birth Rate (tasa de natalidad) (‰): proportion of births
in a year in relation to the total population.
Death Rate (tasa de mortalidad) (‰): proportion of
deaths in a year in relation to the total population.
Natural increase rate (‰): balance between the birth
rate & the death rate.
Nº births in a year X 1.000
Total population
However, to be able to compare the natural population movement in
different countries we need to use RATES (tasas/índices) they
consider the amount of something (births, deaths…) in relation to
the population of the country. They are calculated for every 1.000
people (‰).
Nº deaths in a year X 1.000
Total population
High >30 ‰
Medium 20-30 ‰
Low <20 ‰
Borth rate - Death rate
High >15 ‰
Medium 10-15 ‰
Low <10 ‰
High >20 ‰
Medium 20-10 ‰
Low <10 ‰
30. Fertility Rate: average number of children
each woman has in her life.
Other rates:
31. Infant mortality rate (‰): proportion of
babies who die when they are less than
one year old in relation with the total
number of births.
Other rates:
33. Natality & mortality factors
• Where is birth rate higher: in developed or in
developing countries? Why?
• Where is mortality rate lower: in developed or
in developing countries? Why?
• Do you think culture (education, ways of life,
religion,…) influences birth rates?
• Can governments influence in birth/death
rates?
34. Natality & mortality factors
Factors that
condition birth
rate (natality)
ECONOMIC
Benefits/costs of
having children…
poor countries: more
children (to help
working) / wealthy
countries: less
children (it’s
expensive to grow
them up)
Women who work =
less births
DEMOGRAPHIC
Young population =
more births
High infant mortality =
more births (people
have more children in
case some don’t
survive)
CULTURAL
Age of getting
married, new
ways of life
(“singles”),
contraceptives,
legal
abortions,
religioius
beliefs…
POLITICAL
Guvernamental
policies to
promote/reduce
births
BIOLOGICAL
Age of
motherhood
35. Natality & mortality factors
Factors that
condition death
rate (mortality)
ECONOMIC
Type of jobs,
standard of living
(access to
medicines,
balanced
diet…)…
DEMOGRAPHIC
Young or aged
population (aged
population =
higher mortality)
CULTURAL
Level of
education,
lifestyle habits
(smoking,
drinking…)…
POLITICAL
Quality of the
public healthcare
system
BIOLOGICAL
Gender (women
live longer…)
36. COUNTRY BIRTHS DEATHS POPULATION
LAOS 230.213 73.511 6.676.725
NORWAY 51.646 43.333 4.644.457
SUDAN 1.379.895 548.580 40.218.455
SPAIN 218.324 189.928 46.593.236
1. Work out the Birth Rate, the Death Rate and the Natural Increase rate
2. Are they high, medium or low?
3. Compare them and explain why these rates are so different in each country
Activity 3:
37. Emigration Immigration
MIGRATORY MOVEMENTS
(MIGRATIONS)
Net migration rate
(saldo migratorio)
It can be:
- Positive
- Negative
Departure of
people from a
particular place
Arrival of
people to a
particular place
Physical movement of people from one place to another.
41. INTERNAL MIGRATION
Within a country’s borders.
“Rural exodus” = migrations from the
countryside to urban areas.
Causes:
Mechanisation of agriculture
Industralisation
Consequences:
Enlargement of cities
Abandonment & economic decline of rural
áreas
Ageing of rural population
46. EXTERNAL MIGRATION
From one country to another
HISTORIC MIGRATON (SINCE 16th CENTURY):
• Europe New World (America & Oceania): COLONIALISM
Causes: trade, new resources, lands, slaves…
MODERN MIGRATORY FLOWS (SINCE 1990):
Poor countries Rich countries
Emmigration areas: South America, Africa, Southeast Asia & Eastern Europe.
47.
48. Is immigration positive or negative?
Do we stereotype inmigrants?
Have you ever thought about the
problems immigrants face when
they leave their own country?
What can Governments do to palliate
immigration problems?
49. Consequences
Countries of origin
Positive
Negative
Destination countries (host countries)
Positive
Negative
• Incomes from outside (money sent from abroad)
• Lower unemployment
• Ageing population young people loss & birth rate decrease
• Younger population birth rate increase & death rate decrease
• Cheaper workforce
• Multiculturalism
• Higher unemployment, lower wages…
• Social problems: integration, racism….
52. a) Define “rural exodus” & explain its causes
& consequences.
b) P.183: exercises 1 and 4
c) Design a diagram to summarize the
consequences of external migrations for
origin & host countries.
Activity 4:
53. DEMOGRAPHIC STRUCTURE
(composition of the population)
Composition of the population according to several characteristics that
define it: age, gender & economic sectors.
55. Age Structure
The percentage of the different age groups in a society
DEVELOPING COUNTRIES
DEVELOPED COUNTRIES
YOUNGER POPULATION
AGEING POPULATION
Young people Adults Old people
0-14 15-64 ≥65
56.
57. Compare these population pyramids.
Which belongs to a developed country
and which one to a developing one?
Explain why.
58.
59. Are there more men or women in the world?
What change in gender distribution can you
notice between the young & the old people?
60. IN YOUNGER AGE GROUPS (0-14)
IN ELDERLY GROUPS (≥65)
Gender Structure
The relationship between the number of men and women
BECAUSE LIFE EXPECTANCY IS
HIGHER FOR WOMEN!!!
MORE
MALES
MORE
FEMALES
61. Why do women have a higher life
expectancy?
Will it be the same in the future?
63. Economic Structure
Basic concepts:
Active population: people of working age who are employed, or
unemployed but available & willing to enter the labour market.
Inactive population: people of working age that aren’t available
to enter the labour market. It includes students, retired people &
home makers.
Total population
In working age
Active population
Employed/working population
Unemployed population
Inactive
population
Others
Children under 16 years old
People over 65 years old
64. Economic Structure
Activity rate: proportion (ratio) between the active population
and the total number of people of working age.
Active population X 100
People of working age
Activity rate (%)
(tasa de actividad)
Unemployment rate: proportion (ratio) between the
unemployed population and the active population.
Unemployed population X 100
Active population
Unemployment rate (%)
(tasa de desempleo/paro)
65. a) Calculate & compare the activity &
unemployment rate for Spain in 2005 and
2015.
Activity 5:
2005 2015
Población de 16 y más años 36.489.600 38.517.200
Activos 20,951,100 22.899.400
• Ocupados 19.191.100 17.454.800
• Parados 1.760.000 5,444,600
Inactivos 15,533,500 15.617.800
66. Economic Structure
Sectors in which the economic activity of a country is clasified
PRIMARY SECTOR
SECONDARY SECTOR
TERTIARY SECTOR
Agriculture, livestock farming, forestry, fishing
Industry, building, mining, energy production
Trade, transport, tourism,…
Obtaining resources direcly from the nature
Transform raw materials into other products
Do not produce goods but provide services to people
67. Economic Structure
Primary sector: <10%
Secondary sector: 25 – 35%
Tertiary sector: >60%
DEVELOPED
COUNTRIES
Primary sector: >50%
Secondary sector: very low
Tertiary sector: low
DEVELOPING
COUNTRIES
68. a) P.185: exercises 1 / 3 / 4
b) Match each profession with its sector:
Teacher, fisherman, policeman, industry
technician, nurse, farmer, construction worker,
woodcutter, waiter
Activity 6:
70. Developed countries
• Low birth rate:
• Women entering the labour force
• Contraceptives
• People get married & have babies later
than in the past
• Low death rate:
• Medical advances
• Rich diet
• Low natural increase (even
negative) & ageing population
Developing countries
• High birth rate:
• Many young people
• Limited use of contraceptives
• People get married & have babies
earlier that in developed countries
• High death rate, but
decreasing:
• Medical & higiene advances
• High natural increase & young
population
CONSEQUENCES:
• Death rate increases
• Higher health costs
• Retirement pensions’ system
unsustainable
• Lack of workforce
favourable conditions for arrival
of inmmigrants
CONSEQUENCES:
• Big pressure on natural resources
• Low standard of living
(malnutrition, poor medical
attention…)
• Workforce surplus (high
unemployment rate) favourable
conditions for emmigration
71. DEMOGRAPHIC TRANSITION
THEORY
3 Stages of Natural increase (Birth rate – Death rate)
In which stage are developed countries?
And developing countries?
1st STAGE
Primitive Demographic Regime
SLOW GROWTH
3rd STAGE
Modern Demographic Regime
SLOW GROWTH
2nd STAGE
Demographic transition
RAPID GROWTH
High Birth Rate High Birth Rate
High Death Rate
Decreasing
Death Rate
Birth Rate
Death Rate
Inflexion point
72. DEMOGRAPHIC TRANSITION
THEORY
3 Stages in Natural increase (Birth rate – Death rate)
1st STAGE
Primitive Demographic Regime
SLOW GROWTH
3rd STAGE
Modern Demographic Regime
SLOW GROWTH
2nd STAGE
Demographic transition
RAPID GROWTH
High Birth Rate High Birth Rate
High Death Rate
Decreasing
Death Rate
Birth Rate
Death Rate
Inflexion point
76. What are they????
Graphic representation of the structure of a population at a
given momento (year) according to:
Age
Gender
They give us information about:
Percentage of males and females
Proportion of each age group
Evolution of the population structure
Level of economic development
History and Future of the society
77. Parts of a Population Pyramid
It shows the
percentage (or
total figures)
of men &
women
grouped in
five-year
ranges
78. 1. What, where and when?
Define what is a
population pyramid
Say which country is
represented & the year.
If it’s given, mention the
source.
How to analyze a population
pyramid??
79. 2. Gender Structure: explain the
proportion of males & females.
Does it change in the groups of
ages?
Identify age groups where
there are more males or
females.
Higher percentage of boys
under 4
More women than men over
65 years old.
Explain why:
More boys are born than
girls
Females have a longer life
expectancy (live longer)
80. 3. Age structure: describe & explain the shape of the pyramid &
the distribution of the different age groups (young, adult, old).
EXPANSIVE
(Pyramid- shaped)
Wide base high birth
rate, young population.
Narrow top high
death rate, short life
expectancy.
STATIONARY
(Bell-shaped)
Moderate base high birth
rate but decreasing.
Big proportion of adults
Moderate top decreasing
death rate, increasing life
expectancy.
CONTRACTIVE
(Urn-shaped)
Narrow base low
birth rate.
Wide top ageing
population, long life
expectancy.
81. 3. Age structure: explain the main
historical events that might have had a
demographic consequence:
INCREASE IN A HORIZONTAL BAR
something happened in that generation:
Baby boom?
Immigration?
DECREASE IN A HORIZONTAL BAR
something happened in that generation
High mortality (epidemics or wars)?
Decrease in natality? (wars, crisis,
modern demographic regime
lifestyle…)
Emigration?
Substract the group of age to
the date of the Pyramid
2007 – 69 = 1938 Civil War
82. 4. Conclusions:
a) Decide if it belongs to an underdeveloped, a developing or a
developed country & explain why.
b) Then explain the forecast/problems/consequences which that
society might have in the future.
Underdeveloped country Developing country Developed country