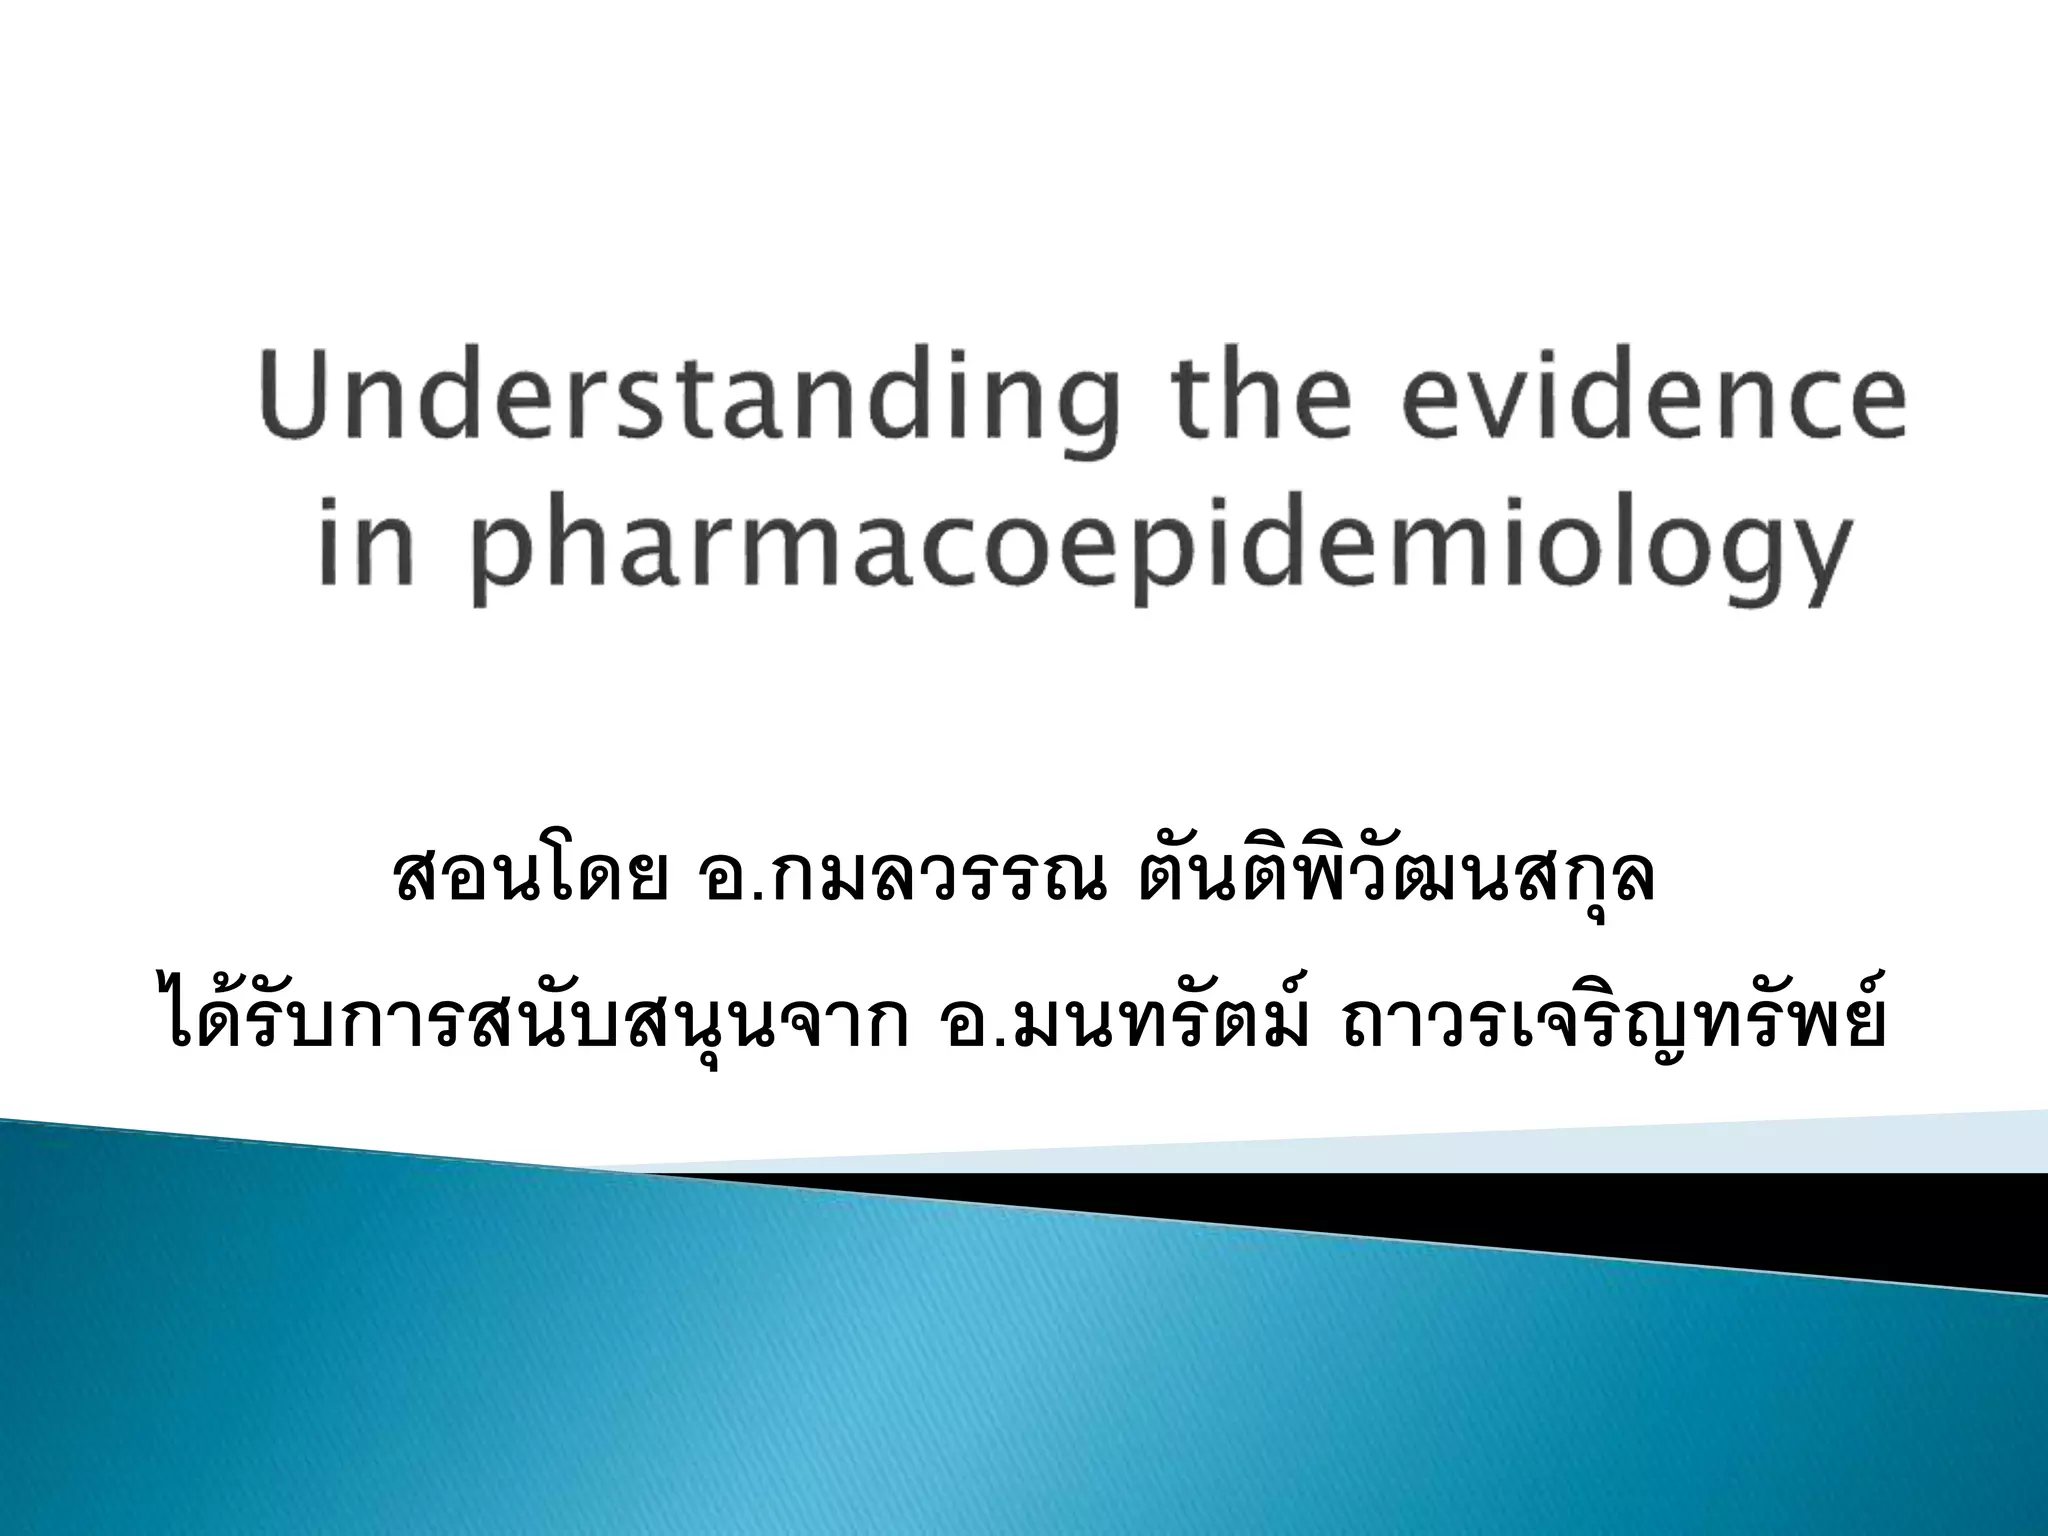
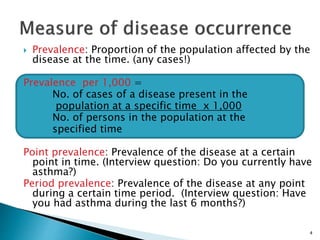
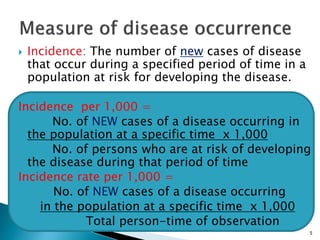
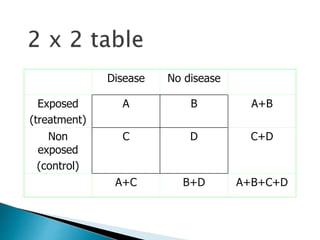
This document discusses key concepts in understanding evidence from epidemiological studies, including:
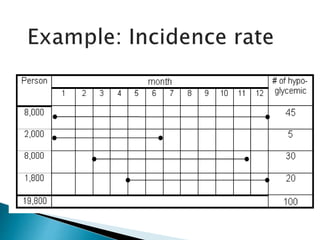
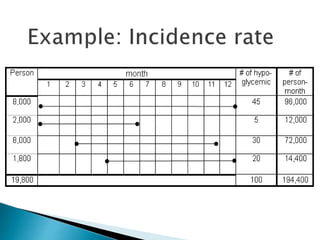
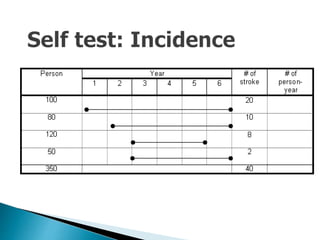
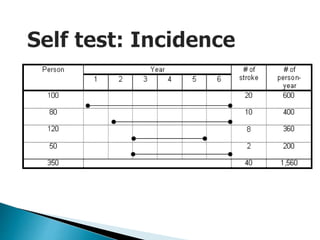
- The difference between prevalence and incidence and how they are calculated
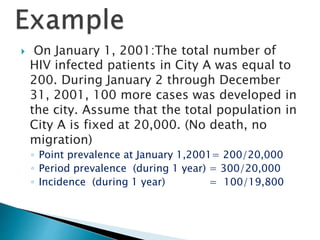
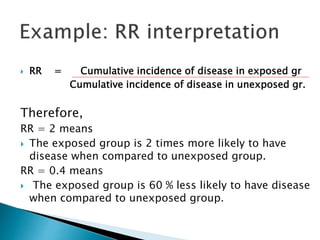
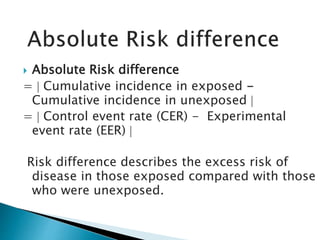
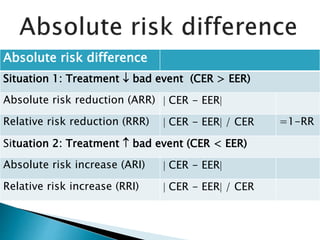
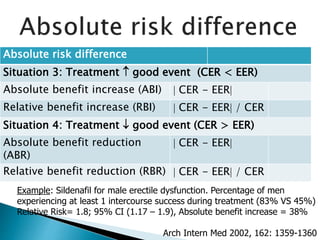
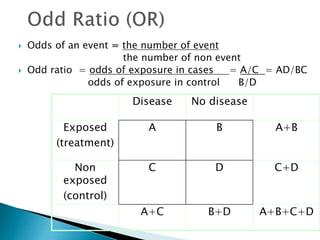
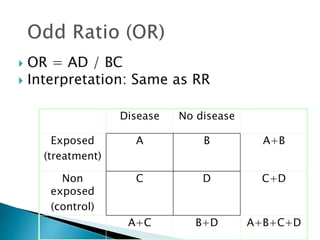
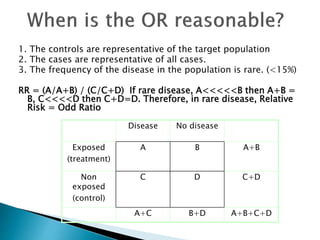
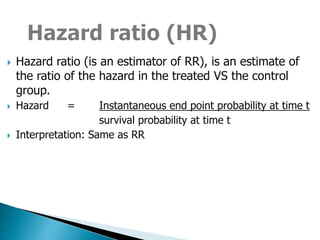
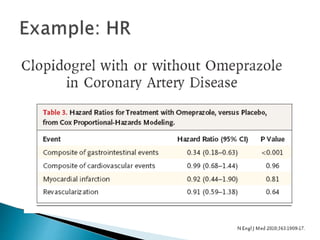
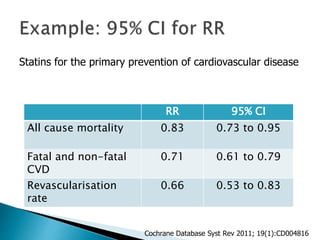
- Common effect measures used to quantify associations including relative risk, risk difference, odds ratio, number needed to treat, and hazard ratio
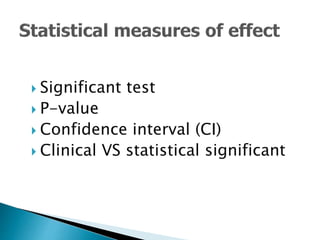
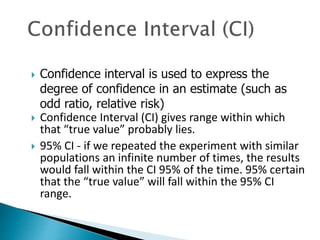
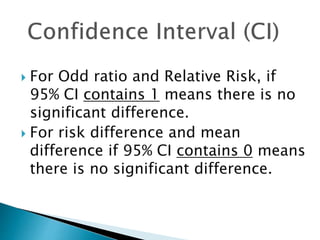
- The importance of confidence intervals and p-values in determining statistical significance and how they are interpreted
- The difference between statistical significance and clinical significance when evaluating study results
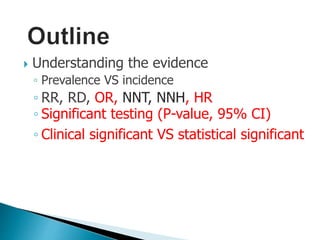


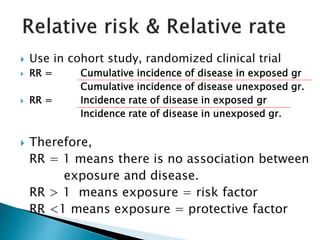
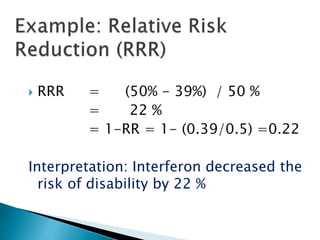
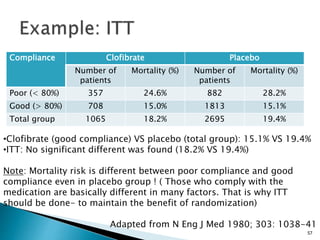
![ Relative risk = Cumulative incidence in exposed gr.
Cumulative incidence in unexposed gr.
= [a /(a+b)] / [c / (c+d)]
Relative rate = Incidence rate in exposed gr.
(Relative risk ratio) Incidence rate in unexposed gr
= a / person-time exposed.
c / person-time unexposed](https://image.slidesharecdn.com/understandingtheevidenceinpe-190813074545/85/Understanding-the-evidence-in-pharmacoepidemiology-study-15-320.jpg)
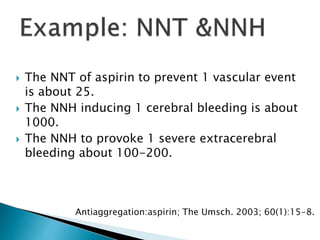
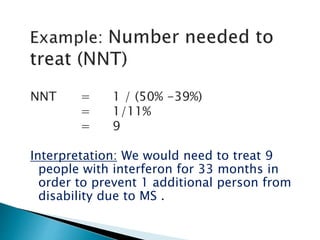

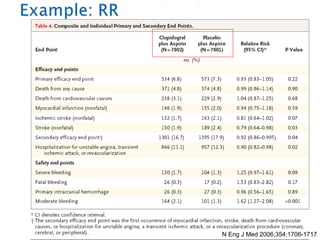
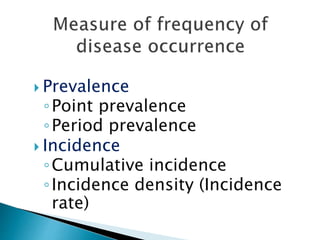
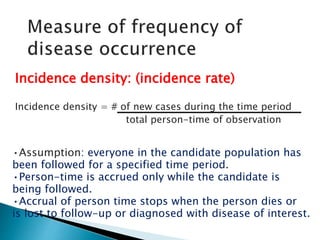
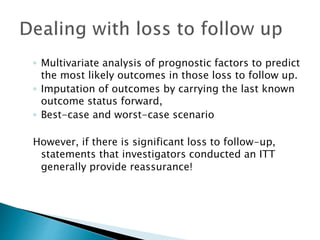
![Penciclovir cream for the treatment of herpes simplex labialis. A
randomized, multicenter, double-blind, placebo-controlled trial. Topical
Penciclovir Collaborative Study Group.
JAMA. 1997 May 7;277(17):1374-9
OBJECTIVE:To compare the safety and efficacy of topical 1%
penciclovir cream with vehicle control cream (placebo) for the
treatment of a recurrent episode of herpes simplex labialis (cold
sores) in immunocompetent patients.
Results: Healing of classical lesions (vesicles, ulcers, and/or
crusts) was 0.7 day faster for penciclovir-treated patients
compared with those who received vehicle control cream (median,
4.8 days vs 5.5 days; hazard ratio [HR], 1.33; 95% confidence
interval [CI], 1.18-1.49; P<.001). Pain (median, 3.5 days vs 4.1
days; HR, 1.22; 95% CI, 1.09-1.36; P<.001) …](https://image.slidesharecdn.com/understandingtheevidenceinpe-190813074545/85/Understanding-the-evidence-in-pharmacoepidemiology-study-52-320.jpg)


![CTEV [ clubfoot] DR ARUN LAL ,DR MOHAMED ASHRAF travancore medical college k...](https://cdn.slidesharecdn.com/ss_thumbnails/ctevclubfootdrarunlaldrmohamedashraftravancoremedicalcollegekollamkeralaindia-260208063247-18fc466c-thumbnail.jpg?width=640&height=640&fit=bounds)


