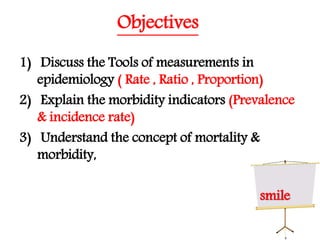
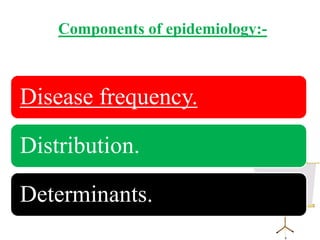
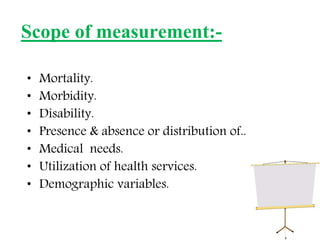
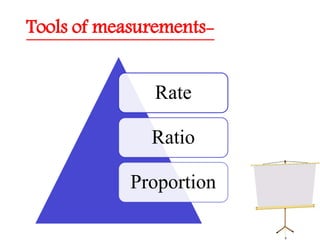
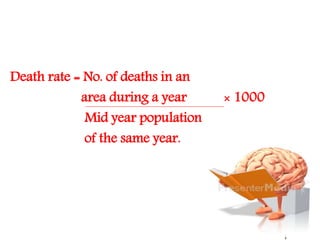
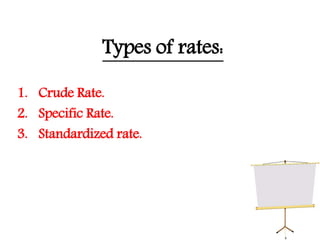
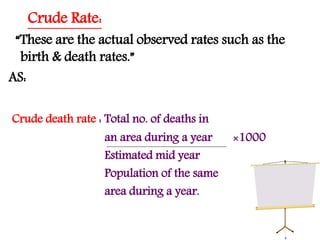
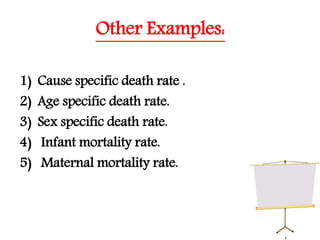
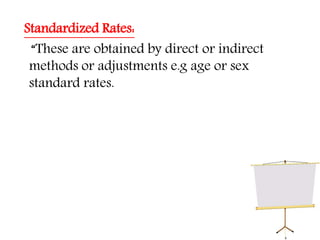
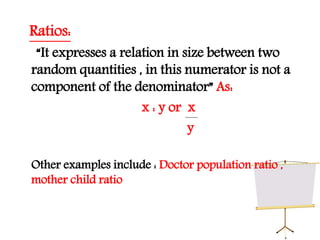
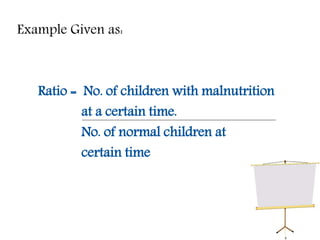
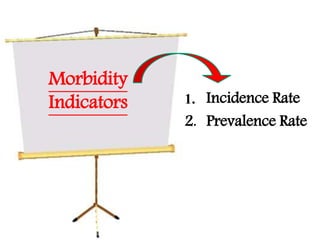
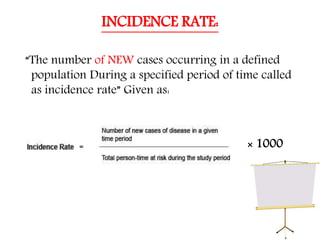
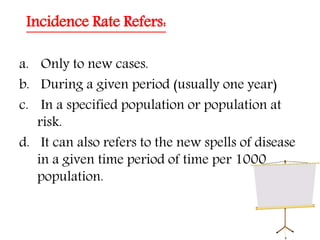
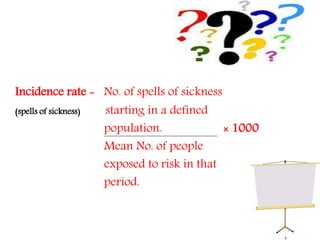
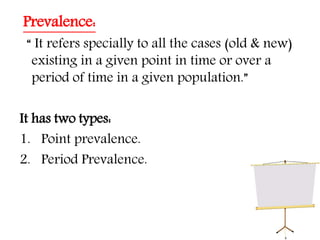
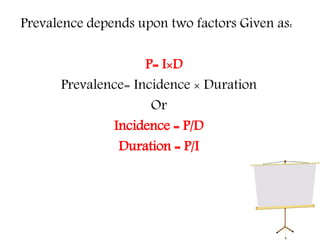
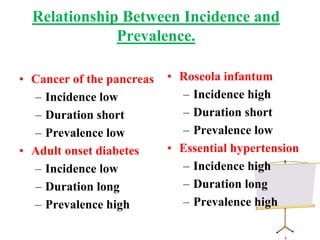
SlideShare a Scribd company logo
1 of 46
Measurements
in
Epidemiology
PALWASHA KHAN
BSN (COLLEGE OF NURSING
NMU)
Objectives
1) Discuss the Tools of measurements in
epidemiology ( Rate , Ratio , Proportion)
2) Explain the morbidity indicators (Prevalence
& incidence rate)
3) Understand the concept of mortality &
morbidity,
smile
Epidemiology:
“The study of frequency , distribution and
determinants of health related states or
events in a specified population & the
application of this study to control the
health problems.”
Components of epidemiology:-
Disease frequency.
Distribution.
Determinants.
• Mortality.
• Morbidity.
• Disability.
• Presence & absence or distribution of..
• Medical needs.
• Utilization of health services.
• Demographic variables.
Scope of measurement:-
Tools of measurements-
Rate
Ratio
Proportion
Rate:
“it measures the frequency or occurrence
of some particular event (development of
disease or the occurrence of death) in a
population during a given time period.”
Death rate = No. of deaths in an
area during a year × 1000
Mid year population
of the same year.
Types of rates:
1. Crude Rate.
2. Specific Rate.
3. Standardized rate.
Crude Rate:
“These are the actual observed rates such as the
birth & death rates.”
AS:
Crude death rate : Total no. of deaths in
an area during a year ×1000
Estimated mid year
Population of the same
area during a year.
If:
Total number of deaths is : 1000
Mid- year population at that time = 3500.
Calculate the crude death rate = ???
Specific Rates:
“These are actual observed rates due to specific
causes (e.g tuberculosis) , or that is occurring
in specific group (e.g age sex groups) , or
during specific time periods (e,g annual ,
monthly or weekly rates).
Cause specific death rate =
No. of deaths from specific
cause in an area during a year × 1000
Estimated mid year population of
the same area during the same year.
Total No. of deaths from in an age 20-40 = 1500
Mid year population at risk = 5,550 .
Calculate the specific death rate….??
Other Examples:
1) Cause specific death rate .
2) Age specific death rate.
3) Sex specific death rate.
4) Infant mortality rate.
5) Maternal mortality rate.
Standardized Rates:
“These are obtained by direct or indirect
methods or adjustments e.g age or sex
standard rates.
Ratios:
“It expresses a relation in size between two
random quantities , in this numerator is not a
component of the denominator” As:
x : y or x
y
Other examples include : Doctor population ratio ,
mother child ratio
Example Given as:
Ratio = No. of children with malnutrition
at a certain time.
No. of normal children at
certain time
If A city of
No of Persons = 40,000
No. clinics = 500
Calculate the ratio of clinic per person.…..???
Proportion:
“A measure which indicates the relation in
magnitude of a part of the whole , numerator is
always included in denominator , expressed in
percentage”
Example:
The No. of children with scabies
at a certain time. × 100
total No. of children in village
at that time.
If :
No. of persons with hypertension is = A = 1,400
No of persons without hypertension= B = 9,650
And total study population =A+B= 11050.
Calculate the proportion of people with
hypertension ????/
Morbidity
Indicators 1. Incidence Rate
2. Prevalence Rate
INCIDENCE RATE:
“The number of NEW cases occurring in a defined
population During a specified period of time called
as incidence rate” Given as:
× 1000
Incidence Rate Refers:
a. Only to new cases.
b. During a given period (usually one year)
c. In a specified population or population at
risk.
d. It can also refers to the new spells of disease
in a given time period of time per 1000
population.
Incidence rate = No. of spells of sickness
(spells of sickness) starting in a defined
population. × 1000
Mean No. of people
exposed to risk in that
period.
If
there had been 50 new cases of an illness in a
population of 30,000 in a year .
Calculate the incidence rate?
Special Incidence Rates:
1. Attack rate.
2. Secondary attack rate.
Attack Rate:
“An incidence rate used only when the population is
exposed to risk for a limited period of time such as
in epidemic”
Given as:
Attack rate = No. of NEW cases of a specified
disease during specific interval × 100
Total population at risk during
the same interval.
Outbreak of cholera in country X in 1999 ,
No. of new cases = 490
Population at risk = 18,600
Calculate the attack rate ?????????
Secondary Attack rate:
“The number of exposed persons developing the
disease within the range of incubation period ,
following exposure to the primary case”
Given as:
SAR = No. of contacts developing tuberculosis × 100
Number of persons-weeks (month or
year of exposure.
Uses of incidence rate:
It is useful for taking action:
1. to control disease.
2. For research into etiology & pathogenesis ,
distribution of disease , and efficacy of therapeutic
and preventive measures.
Prevalence:
“ It refers specially to all the cases (old & new)
existing in a given point in time or over a
period of time in a given population.”
It has two types:
1. Point prevalence.
2. Period Prevalence.
Types of prevalence-
• Prevalence at any given
point of time.
• 4% TB cases on 1st April
Point
prevalence
• Prevalence at a
given period of
time.
• Period will be 1year.
Period
prevalence
Point Prevalence = No. of all current cases of a
specified disease existing × 100
at a given point in time.
Estimated population at
the same point in time.
Of 10,000 female residents in town A on 1st
January 2006, 1,000 have hypertension.
Calculate the point prevalence of
hypertension among women in town A on this
date…..?????
Period Prevalence = No. of existing cases of
a specified disease during
a given period of time. × 100
Estimated mid interval
population at risk.
Prevalence depends upon two factors Given as:
P= I×D
Prevalence= Incidence × Duration
Or
Incidence = P/D
Duration = P/I
Relationship Between Incidence and
Prevalence.
• Cancer of the pancreas
– Incidence low
– Duration short
– Prevalence low
• Adult onset diabetes
– Incidence low
– Duration long
– Prevalence high
• Roseola infantum
– Incidence high
– Duration short
– Prevalence low
• Essential hypertension
– Incidence high
– Duration long
– Prevalence high
1. Circle the most appropriate explanation on
“Prevalence rate”:
a. the number of patients who have the disease at a
particular time, divided by the population at risk of
having the disease at that time.
b. the number of new cases of a diseased in a
population over a period of time.
c. not useful for developing HIV/AIDS control
program.
d. useful for developing Avian flu control program.
2- Differentiate b/w incidence & prevalence
rate.???
3- If no. of doctors is 1000 and population size
is 9500 , calculate the doctor to population
ratio.
4- What are the basic tools of measurement in
epidemiology???
Measurements in Epidemiology: Rates, Ratios, Proportions

More Related Content

What's hot

applications of epidemiology
applications of epidemiologyapplications of epidemiology
applications of epidemiologySagar Dalal
 
Measurements of morbidity and mortality
Measurements of morbidity and mortalityMeasurements of morbidity and mortality
Measurements of morbidity and mortalityJayaramachandran S
 
Lec4 morbidity(revised07)
Lec4 morbidity(revised07)Lec4 morbidity(revised07)
Lec4 morbidity(revised07)Abeer Esmail
 
Validity of a screening test
Validity of a screening testValidity of a screening test
Validity of a screening testdrkulrajat
 
Basic measurements in epidemiology
Basic measurements in epidemiologyBasic measurements in epidemiology
Basic measurements in epidemiologyRizwan S A
 
Association and causation
Association and causationAssociation and causation
Association and causationdrravimr
 
Epidemiology of communicable diseases
Epidemiology of communicable diseasesEpidemiology of communicable diseases
Epidemiology of communicable diseasesDalia El-Shafei
 
Concepts of disease causation
Concepts of disease causationConcepts of disease causation
Concepts of disease causationBhoj Raj Singh
 
outbreak investigation - types of epidemics and investigating them
outbreak investigation - types of epidemics and investigating themoutbreak investigation - types of epidemics and investigating them
outbreak investigation - types of epidemics and investigating themTimiresh Das
 
Attributable risk and population attributable risk
Attributable risk and population attributable riskAttributable risk and population attributable risk
Attributable risk and population attributable riskAbino David
 
Mortality rates & standardization
Mortality rates &  standardizationMortality rates &  standardization
Mortality rates & standardizationVaishnavi Madhavan
 
Standardization of rates by Dr. Basil Tumaini
Standardization of rates by Dr. Basil TumainiStandardization of rates by Dr. Basil Tumaini
Standardization of rates by Dr. Basil TumainiBasil Tumaini
 
Epidemiology Introduction
Epidemiology Introduction Epidemiology Introduction
Epidemiology Introduction KULDEEP VYAS
 
MY PPT - NATIONAL FAMILY HEALTH SURVEY- 5 AND COMPERATIVES.pptx
MY PPT - NATIONAL FAMILY HEALTH SURVEY- 5 AND COMPERATIVES.pptxMY PPT - NATIONAL FAMILY HEALTH SURVEY- 5 AND COMPERATIVES.pptx
MY PPT - NATIONAL FAMILY HEALTH SURVEY- 5 AND COMPERATIVES.pptxAmruthaNambiar8
 
Introduction to epidemiology and it's measurements
Introduction to epidemiology and it's measurementsIntroduction to epidemiology and it's measurements
Introduction to epidemiology and it's measurementswrigveda
 

What's hot (20)

applications of epidemiology
applications of epidemiologyapplications of epidemiology
applications of epidemiology
 
Measurements of morbidity and mortality
Measurements of morbidity and mortalityMeasurements of morbidity and mortality
Measurements of morbidity and mortality
 
Lec4 morbidity(revised07)
Lec4 morbidity(revised07)Lec4 morbidity(revised07)
Lec4 morbidity(revised07)
 
Validity of a screening test
Validity of a screening testValidity of a screening test
Validity of a screening test
 
Basic measurements in epidemiology
Basic measurements in epidemiologyBasic measurements in epidemiology
Basic measurements in epidemiology
 
Association and causation
Association and causationAssociation and causation
Association and causation
 
Direct standardisation ppt
Direct standardisation pptDirect standardisation ppt
Direct standardisation ppt
 
Epidemiology notes
Epidemiology notesEpidemiology notes
Epidemiology notes
 
Public health surveillance
Public health surveillancePublic health surveillance
Public health surveillance
 
Epidemiology of communicable diseases
Epidemiology of communicable diseasesEpidemiology of communicable diseases
Epidemiology of communicable diseases
 
Concepts of disease causation
Concepts of disease causationConcepts of disease causation
Concepts of disease causation
 
Demography & health
Demography & healthDemography & health
Demography & health
 
outbreak investigation - types of epidemics and investigating them
outbreak investigation - types of epidemics and investigating themoutbreak investigation - types of epidemics and investigating them
outbreak investigation - types of epidemics and investigating them
 
Attributable risk and population attributable risk
Attributable risk and population attributable riskAttributable risk and population attributable risk
Attributable risk and population attributable risk
 
Mortality rates & standardization
Mortality rates &  standardizationMortality rates &  standardization
Mortality rates & standardization
 
Association and causation
Association and causationAssociation and causation
Association and causation
 
Standardization of rates by Dr. Basil Tumaini
Standardization of rates by Dr. Basil TumainiStandardization of rates by Dr. Basil Tumaini
Standardization of rates by Dr. Basil Tumaini
 
Epidemiology Introduction
Epidemiology Introduction Epidemiology Introduction
Epidemiology Introduction
 
MY PPT - NATIONAL FAMILY HEALTH SURVEY- 5 AND COMPERATIVES.pptx
MY PPT - NATIONAL FAMILY HEALTH SURVEY- 5 AND COMPERATIVES.pptxMY PPT - NATIONAL FAMILY HEALTH SURVEY- 5 AND COMPERATIVES.pptx
MY PPT - NATIONAL FAMILY HEALTH SURVEY- 5 AND COMPERATIVES.pptx
 
Introduction to epidemiology and it's measurements
Introduction to epidemiology and it's measurementsIntroduction to epidemiology and it's measurements
Introduction to epidemiology and it's measurements
 

Similar to Measurements in Epidemiology: Rates, Ratios, Proportions

Measurements of morbidity & mortality Jaya.pptx
Measurements of morbidity & mortality Jaya.pptxMeasurements of morbidity & mortality Jaya.pptx
Measurements of morbidity & mortality Jaya.pptxjayalakshmi707175
 
Epidemiology for nursing student
Epidemiology for nursing studentEpidemiology for nursing student
Epidemiology for nursing studentPatel Dharmendra
 
mudule 3 Measure of health and Health Related Events.pdf
mudule 3 Measure of health and Health Related Events.pdfmudule 3 Measure of health and Health Related Events.pdf
mudule 3 Measure of health and Health Related Events.pdfteddiyfentaw
 
BASIC MEASUREMENTS IN EPIDEMIOLOGY presentation
BASIC MEASUREMENTS IN EPIDEMIOLOGY presentationBASIC MEASUREMENTS IN EPIDEMIOLOGY presentation
BASIC MEASUREMENTS IN EPIDEMIOLOGY presentationPaul523674
 
5 mortality and morbidity indicators
5 mortality and morbidity indicators5 mortality and morbidity indicators
5 mortality and morbidity indicatorsAnup Kharde
 
Measuring the occurrences of disease dhanlal
Measuring the occurrences of disease dhanlalMeasuring the occurrences of disease dhanlal
Measuring the occurrences of disease dhanlalDhan Pandey
 
UNIT 3 MEASURES OF FREQUENCY.pdf
UNIT 3 MEASURES OF FREQUENCY.pdfUNIT 3 MEASURES OF FREQUENCY.pdf
UNIT 3 MEASURES OF FREQUENCY.pdfJoyceSChipili
 
Morbidity & mortality
Morbidity & mortalityMorbidity & mortality
Morbidity & mortalityHalyna Lugova
 
Measurement of epidemiology.pptx
Measurement of epidemiology.pptxMeasurement of epidemiology.pptx
Measurement of epidemiology.pptxradha maharjan
 
4Estimating Disease Frequency occurrence-2024.ppt
4Estimating Disease Frequency occurrence-2024.ppt4Estimating Disease Frequency occurrence-2024.ppt
4Estimating Disease Frequency occurrence-2024.pptOwomugishaMartin
 
MEASURES OF DISEASE FREQUENCY. ASSOSCIATION AND IMPACT
MEASURES OF DISEASE FREQUENCY. ASSOSCIATION AND IMPACTMEASURES OF DISEASE FREQUENCY. ASSOSCIATION AND IMPACT
MEASURES OF DISEASE FREQUENCY. ASSOSCIATION AND IMPACTAneesa K Ayoob
 
2. Measurements of Morbidity and Mortality.pptx
2. Measurements of Morbidity and Mortality.pptx2. Measurements of Morbidity and Mortality.pptx
2. Measurements of Morbidity and Mortality.pptxFerhanKadir
 
basicmeasurementsinepidemiology-201020073202.pdf
basicmeasurementsinepidemiology-201020073202.pdfbasicmeasurementsinepidemiology-201020073202.pdf
basicmeasurementsinepidemiology-201020073202.pdfNOKHAIZHAMMAD2021BSM
 
Disease occurrence measurment lec-4.pptx
Disease occurrence measurment lec-4.pptxDisease occurrence measurment lec-4.pptx
Disease occurrence measurment lec-4.pptxSaeedAbdiali
 
EPI_-_EPIDEMIOLOGIC_MEASURES in public health .pptx
EPI_-_EPIDEMIOLOGIC_MEASURES  in public health .pptxEPI_-_EPIDEMIOLOGIC_MEASURES  in public health .pptx
EPI_-_EPIDEMIOLOGIC_MEASURES in public health .pptxTofikMohammadMuse
 
PRINCIPLE OF EPIDEMIOLOGY.pptx
PRINCIPLE OF  EPIDEMIOLOGY.pptxPRINCIPLE OF  EPIDEMIOLOGY.pptx
PRINCIPLE OF EPIDEMIOLOGY.pptxAyshaAlrawi1
 
3. Measures of morbidity(1).pdf
3. Measures of morbidity(1).pdf3. Measures of morbidity(1).pdf
3. Measures of morbidity(1).pdfSondosAli13
 
3 Measurment new.pptx
3 Measurment new.pptx3 Measurment new.pptx
3 Measurment new.pptxGashawudesta
 
Data and epidemiology 2.pptx
Data and epidemiology 2.pptxData and epidemiology 2.pptx
Data and epidemiology 2.pptxAbdallahAlasal1
 

Similar to Measurements in Epidemiology: Rates, Ratios, Proportions (20)

Measurements of morbidity & mortality Jaya.pptx
Measurements of morbidity & mortality Jaya.pptxMeasurements of morbidity & mortality Jaya.pptx
Measurements of morbidity & mortality Jaya.pptx
 
Epidemiology for nursing student
Epidemiology for nursing studentEpidemiology for nursing student
Epidemiology for nursing student
 
mudule 3 Measure of health and Health Related Events.pdf
mudule 3 Measure of health and Health Related Events.pdfmudule 3 Measure of health and Health Related Events.pdf
mudule 3 Measure of health and Health Related Events.pdf
 
BASIC MEASUREMENTS IN EPIDEMIOLOGY presentation
BASIC MEASUREMENTS IN EPIDEMIOLOGY presentationBASIC MEASUREMENTS IN EPIDEMIOLOGY presentation
BASIC MEASUREMENTS IN EPIDEMIOLOGY presentation
 
5 mortality and morbidity indicators
5 mortality and morbidity indicators5 mortality and morbidity indicators
5 mortality and morbidity indicators
 
Measuring the occurrences of disease dhanlal
Measuring the occurrences of disease dhanlalMeasuring the occurrences of disease dhanlal
Measuring the occurrences of disease dhanlal
 
UNIT 3 MEASURES OF FREQUENCY.pdf
UNIT 3 MEASURES OF FREQUENCY.pdfUNIT 3 MEASURES OF FREQUENCY.pdf
UNIT 3 MEASURES OF FREQUENCY.pdf
 
Morbidity & mortality
Morbidity & mortalityMorbidity & mortality
Morbidity & mortality
 
Measurement of epidemiology.pptx
Measurement of epidemiology.pptxMeasurement of epidemiology.pptx
Measurement of epidemiology.pptx
 
4Estimating Disease Frequency occurrence-2024.ppt
4Estimating Disease Frequency occurrence-2024.ppt4Estimating Disease Frequency occurrence-2024.ppt
4Estimating Disease Frequency occurrence-2024.ppt
 
MEASURES OF DISEASE FREQUENCY. ASSOSCIATION AND IMPACT
MEASURES OF DISEASE FREQUENCY. ASSOSCIATION AND IMPACTMEASURES OF DISEASE FREQUENCY. ASSOSCIATION AND IMPACT
MEASURES OF DISEASE FREQUENCY. ASSOSCIATION AND IMPACT
 
2. Measurements of Morbidity and Mortality.pptx
2. Measurements of Morbidity and Mortality.pptx2. Measurements of Morbidity and Mortality.pptx
2. Measurements of Morbidity and Mortality.pptx
 
Basic Measures.pptx
Basic Measures.pptxBasic Measures.pptx
Basic Measures.pptx
 
basicmeasurementsinepidemiology-201020073202.pdf
basicmeasurementsinepidemiology-201020073202.pdfbasicmeasurementsinepidemiology-201020073202.pdf
basicmeasurementsinepidemiology-201020073202.pdf
 
Disease occurrence measurment lec-4.pptx
Disease occurrence measurment lec-4.pptxDisease occurrence measurment lec-4.pptx
Disease occurrence measurment lec-4.pptx
 
EPI_-_EPIDEMIOLOGIC_MEASURES in public health .pptx
EPI_-_EPIDEMIOLOGIC_MEASURES  in public health .pptxEPI_-_EPIDEMIOLOGIC_MEASURES  in public health .pptx
EPI_-_EPIDEMIOLOGIC_MEASURES in public health .pptx
 
PRINCIPLE OF EPIDEMIOLOGY.pptx
PRINCIPLE OF  EPIDEMIOLOGY.pptxPRINCIPLE OF  EPIDEMIOLOGY.pptx
PRINCIPLE OF EPIDEMIOLOGY.pptx
 
3. Measures of morbidity(1).pdf
3. Measures of morbidity(1).pdf3. Measures of morbidity(1).pdf
3. Measures of morbidity(1).pdf
 
3 Measurment new.pptx
3 Measurment new.pptx3 Measurment new.pptx
3 Measurment new.pptx
 
Data and epidemiology 2.pptx
Data and epidemiology 2.pptxData and epidemiology 2.pptx
Data and epidemiology 2.pptx
 

Recently uploaded

Science lesson Moon for 4th quarter lesson
Science lesson Moon for 4th quarter lessonScience lesson Moon for 4th quarter lesson
Science lesson Moon for 4th quarter lessonJericReyAuditor
 
Introduction to AI in Higher Education_draft.pptx
Introduction to AI in Higher Education_draft.pptxIntroduction to AI in Higher Education_draft.pptx
Introduction to AI in Higher Education_draft.pptxpboyjonauth
 
Organic Name Reactions for the students and aspirants of Chemistry12th.pptx
Organic Name Reactions  for the students and aspirants of Chemistry12th.pptxOrganic Name Reactions  for the students and aspirants of Chemistry12th.pptx
Organic Name Reactions for the students and aspirants of Chemistry12th.pptxVS Mahajan Coaching Centre
 
call girls in Kamla Market (DELHI) 🔝 >༒9953330565🔝 genuine Escort Service 🔝✔️✔️
call girls in Kamla Market (DELHI) 🔝 >༒9953330565🔝 genuine Escort Service 🔝✔️✔️call girls in Kamla Market (DELHI) 🔝 >༒9953330565🔝 genuine Escort Service 🔝✔️✔️
call girls in Kamla Market (DELHI) 🔝 >༒9953330565🔝 genuine Escort Service 🔝✔️✔️9953056974 Low Rate Call Girls In Saket, Delhi NCR
 
Painted Grey Ware.pptx, PGW Culture of India
Painted Grey Ware.pptx, PGW Culture of IndiaPainted Grey Ware.pptx, PGW Culture of India
Painted Grey Ware.pptx, PGW Culture of IndiaVirag Sontakke
 
History Class XII Ch. 3 Kinship, Caste and Class (1).pptx
History Class XII Ch. 3 Kinship, Caste and Class (1).pptxHistory Class XII Ch. 3 Kinship, Caste and Class (1).pptx
History Class XII Ch. 3 Kinship, Caste and Class (1).pptxsocialsciencegdgrohi
 
Introduction to ArtificiaI Intelligence in Higher Education
Introduction to ArtificiaI Intelligence in Higher EducationIntroduction to ArtificiaI Intelligence in Higher Education
Introduction to ArtificiaI Intelligence in Higher Educationpboyjonauth
 
Computed Fields and api Depends in the Odoo 17
Computed Fields and api Depends in the Odoo 17Computed Fields and api Depends in the Odoo 17
Computed Fields and api Depends in the Odoo 17Celine George
 
SOCIAL AND HISTORICAL CONTEXT - LFTVD.pptx
SOCIAL AND HISTORICAL CONTEXT - LFTVD.pptxSOCIAL AND HISTORICAL CONTEXT - LFTVD.pptx
SOCIAL AND HISTORICAL CONTEXT - LFTVD.pptxiammrhaywood
 
Final demo Grade 9 for demo Plan dessert.pptx
Final demo Grade 9 for demo Plan dessert.pptxFinal demo Grade 9 for demo Plan dessert.pptx
Final demo Grade 9 for demo Plan dessert.pptxAvyJaneVismanos
 
Software Engineering Methodologies (overview)
Software Engineering Methodologies (overview)Software Engineering Methodologies (overview)
Software Engineering Methodologies (overview)eniolaolutunde
 
भारत-रोम व्यापार.pptx, Indo-Roman Trade,
भारत-रोम व्यापार.pptx, Indo-Roman Trade,भारत-रोम व्यापार.pptx, Indo-Roman Trade,
भारत-रोम व्यापार.pptx, Indo-Roman Trade,Virag Sontakke
 
Presiding Officer Training module 2024 lok sabha elections
Presiding Officer Training module 2024 lok sabha electionsPresiding Officer Training module 2024 lok sabha elections
Presiding Officer Training module 2024 lok sabha electionsanshu789521
 
How to Configure Email Server in Odoo 17
How to Configure Email Server in Odoo 17How to Configure Email Server in Odoo 17
How to Configure Email Server in Odoo 17Celine George
 
Science 7 - LAND and SEA BREEZE and its Characteristics
Science 7 - LAND and SEA BREEZE and its CharacteristicsScience 7 - LAND and SEA BREEZE and its Characteristics
Science 7 - LAND and SEA BREEZE and its CharacteristicsKarinaGenton
 
POINT- BIOCHEMISTRY SEM 2 ENZYMES UNIT 5.pptx
POINT- BIOCHEMISTRY SEM 2 ENZYMES UNIT 5.pptxPOINT- BIOCHEMISTRY SEM 2 ENZYMES UNIT 5.pptx
POINT- BIOCHEMISTRY SEM 2 ENZYMES UNIT 5.pptxSayali Powar
 
Class 11 Legal Studies Ch-1 Concept of State .pdf
Class 11 Legal Studies Ch-1 Concept of State .pdfClass 11 Legal Studies Ch-1 Concept of State .pdf
Class 11 Legal Studies Ch-1 Concept of State .pdfakmcokerachita
 
Solving Puzzles Benefits Everyone (English).pptx
Solving Puzzles Benefits Everyone (English).pptxSolving Puzzles Benefits Everyone (English).pptx
Solving Puzzles Benefits Everyone (English).pptxOH TEIK BIN
 

Recently uploaded (20)

Science lesson Moon for 4th quarter lesson
Science lesson Moon for 4th quarter lessonScience lesson Moon for 4th quarter lesson
Science lesson Moon for 4th quarter lesson
 
Introduction to AI in Higher Education_draft.pptx
Introduction to AI in Higher Education_draft.pptxIntroduction to AI in Higher Education_draft.pptx
Introduction to AI in Higher Education_draft.pptx
 
Organic Name Reactions for the students and aspirants of Chemistry12th.pptx
Organic Name Reactions  for the students and aspirants of Chemistry12th.pptxOrganic Name Reactions  for the students and aspirants of Chemistry12th.pptx
Organic Name Reactions for the students and aspirants of Chemistry12th.pptx
 
call girls in Kamla Market (DELHI) 🔝 >༒9953330565🔝 genuine Escort Service 🔝✔️✔️
call girls in Kamla Market (DELHI) 🔝 >༒9953330565🔝 genuine Escort Service 🔝✔️✔️call girls in Kamla Market (DELHI) 🔝 >༒9953330565🔝 genuine Escort Service 🔝✔️✔️
call girls in Kamla Market (DELHI) 🔝 >༒9953330565🔝 genuine Escort Service 🔝✔️✔️
 
Model Call Girl in Tilak Nagar Delhi reach out to us at 🔝9953056974🔝
Model Call Girl in Tilak Nagar Delhi reach out to us at 🔝9953056974🔝Model Call Girl in Tilak Nagar Delhi reach out to us at 🔝9953056974🔝
Model Call Girl in Tilak Nagar Delhi reach out to us at 🔝9953056974🔝
 
Staff of Color (SOC) Retention Efforts DDSD
Staff of Color (SOC) Retention Efforts DDSDStaff of Color (SOC) Retention Efforts DDSD
Staff of Color (SOC) Retention Efforts DDSD
 
Painted Grey Ware.pptx, PGW Culture of India
Painted Grey Ware.pptx, PGW Culture of IndiaPainted Grey Ware.pptx, PGW Culture of India
Painted Grey Ware.pptx, PGW Culture of India
 
History Class XII Ch. 3 Kinship, Caste and Class (1).pptx
History Class XII Ch. 3 Kinship, Caste and Class (1).pptxHistory Class XII Ch. 3 Kinship, Caste and Class (1).pptx
History Class XII Ch. 3 Kinship, Caste and Class (1).pptx
 
Introduction to ArtificiaI Intelligence in Higher Education
Introduction to ArtificiaI Intelligence in Higher EducationIntroduction to ArtificiaI Intelligence in Higher Education
Introduction to ArtificiaI Intelligence in Higher Education
 
Computed Fields and api Depends in the Odoo 17
Computed Fields and api Depends in the Odoo 17Computed Fields and api Depends in the Odoo 17
Computed Fields and api Depends in the Odoo 17
 
SOCIAL AND HISTORICAL CONTEXT - LFTVD.pptx
SOCIAL AND HISTORICAL CONTEXT - LFTVD.pptxSOCIAL AND HISTORICAL CONTEXT - LFTVD.pptx
SOCIAL AND HISTORICAL CONTEXT - LFTVD.pptx
 
Final demo Grade 9 for demo Plan dessert.pptx
Final demo Grade 9 for demo Plan dessert.pptxFinal demo Grade 9 for demo Plan dessert.pptx
Final demo Grade 9 for demo Plan dessert.pptx
 
Software Engineering Methodologies (overview)
Software Engineering Methodologies (overview)Software Engineering Methodologies (overview)
Software Engineering Methodologies (overview)
 
भारत-रोम व्यापार.pptx, Indo-Roman Trade,
भारत-रोम व्यापार.pptx, Indo-Roman Trade,भारत-रोम व्यापार.pptx, Indo-Roman Trade,
भारत-रोम व्यापार.pptx, Indo-Roman Trade,
 
Presiding Officer Training module 2024 lok sabha elections
Presiding Officer Training module 2024 lok sabha electionsPresiding Officer Training module 2024 lok sabha elections
Presiding Officer Training module 2024 lok sabha elections
 
How to Configure Email Server in Odoo 17
How to Configure Email Server in Odoo 17How to Configure Email Server in Odoo 17
How to Configure Email Server in Odoo 17
 
Science 7 - LAND and SEA BREEZE and its Characteristics
Science 7 - LAND and SEA BREEZE and its CharacteristicsScience 7 - LAND and SEA BREEZE and its Characteristics
Science 7 - LAND and SEA BREEZE and its Characteristics
 
POINT- BIOCHEMISTRY SEM 2 ENZYMES UNIT 5.pptx
POINT- BIOCHEMISTRY SEM 2 ENZYMES UNIT 5.pptxPOINT- BIOCHEMISTRY SEM 2 ENZYMES UNIT 5.pptx
POINT- BIOCHEMISTRY SEM 2 ENZYMES UNIT 5.pptx
 
Class 11 Legal Studies Ch-1 Concept of State .pdf
Class 11 Legal Studies Ch-1 Concept of State .pdfClass 11 Legal Studies Ch-1 Concept of State .pdf
Class 11 Legal Studies Ch-1 Concept of State .pdf
 
Solving Puzzles Benefits Everyone (English).pptx
Solving Puzzles Benefits Everyone (English).pptxSolving Puzzles Benefits Everyone (English).pptx
Solving Puzzles Benefits Everyone (English).pptx
 

Measurements in Epidemiology: Rates, Ratios, Proportions

  • 2. Objectives 1) Discuss the Tools of measurements in epidemiology ( Rate , Ratio , Proportion) 2) Explain the morbidity indicators (Prevalence & incidence rate) 3) Understand the concept of mortality & morbidity, smile
  • 3. Epidemiology: “The study of frequency , distribution and determinants of health related states or events in a specified population & the application of this study to control the health problems.”
  • 4. Components of epidemiology:- Disease frequency. Distribution. Determinants.
  • 5. • Mortality. • Morbidity. • Disability. • Presence & absence or distribution of.. • Medical needs. • Utilization of health services. • Demographic variables. Scope of measurement:-
  • 7. Rate: “it measures the frequency or occurrence of some particular event (development of disease or the occurrence of death) in a population during a given time period.”
  • 8. Death rate = No. of deaths in an area during a year × 1000 Mid year population of the same year.
  • 9. Types of rates: 1. Crude Rate. 2. Specific Rate. 3. Standardized rate.
  • 10. Crude Rate: “These are the actual observed rates such as the birth & death rates.” AS: Crude death rate : Total no. of deaths in an area during a year ×1000 Estimated mid year Population of the same area during a year.
  • 11. If: Total number of deaths is : 1000 Mid- year population at that time = 3500. Calculate the crude death rate = ???
  • 12. Specific Rates: “These are actual observed rates due to specific causes (e.g tuberculosis) , or that is occurring in specific group (e.g age sex groups) , or during specific time periods (e,g annual , monthly or weekly rates).
  • 13. Cause specific death rate = No. of deaths from specific cause in an area during a year × 1000 Estimated mid year population of the same area during the same year.
  • 14. Total No. of deaths from in an age 20-40 = 1500 Mid year population at risk = 5,550 . Calculate the specific death rate….??
  • 15. Other Examples: 1) Cause specific death rate . 2) Age specific death rate. 3) Sex specific death rate. 4) Infant mortality rate. 5) Maternal mortality rate.
  • 16. Standardized Rates: “These are obtained by direct or indirect methods or adjustments e.g age or sex standard rates.
  • 17. Ratios: “It expresses a relation in size between two random quantities , in this numerator is not a component of the denominator” As: x : y or x y Other examples include : Doctor population ratio , mother child ratio
  • 18. Example Given as: Ratio = No. of children with malnutrition at a certain time. No. of normal children at certain time
  • 19. If A city of No of Persons = 40,000 No. clinics = 500 Calculate the ratio of clinic per person.…..???
  • 20. Proportion: “A measure which indicates the relation in magnitude of a part of the whole , numerator is always included in denominator , expressed in percentage” Example: The No. of children with scabies at a certain time. × 100 total No. of children in village at that time.
  • 21. If : No. of persons with hypertension is = A = 1,400 No of persons without hypertension= B = 9,650 And total study population =A+B= 11050. Calculate the proportion of people with hypertension ????/
  • 22. Morbidity Indicators 1. Incidence Rate 2. Prevalence Rate
  • 23. INCIDENCE RATE: “The number of NEW cases occurring in a defined population During a specified period of time called as incidence rate” Given as: × 1000
  • 24. Incidence Rate Refers: a. Only to new cases. b. During a given period (usually one year) c. In a specified population or population at risk. d. It can also refers to the new spells of disease in a given time period of time per 1000 population.
  • 25. Incidence rate = No. of spells of sickness (spells of sickness) starting in a defined population. × 1000 Mean No. of people exposed to risk in that period.
  • 26. If there had been 50 new cases of an illness in a population of 30,000 in a year . Calculate the incidence rate?
  • 27. Special Incidence Rates: 1. Attack rate. 2. Secondary attack rate.
  • 28. Attack Rate: “An incidence rate used only when the population is exposed to risk for a limited period of time such as in epidemic” Given as: Attack rate = No. of NEW cases of a specified disease during specific interval × 100 Total population at risk during the same interval.
  • 29. Outbreak of cholera in country X in 1999 , No. of new cases = 490 Population at risk = 18,600 Calculate the attack rate ?????????
  • 30. Secondary Attack rate: “The number of exposed persons developing the disease within the range of incubation period , following exposure to the primary case” Given as: SAR = No. of contacts developing tuberculosis × 100 Number of persons-weeks (month or year of exposure.
  • 31. Uses of incidence rate: It is useful for taking action: 1. to control disease. 2. For research into etiology & pathogenesis , distribution of disease , and efficacy of therapeutic and preventive measures.
  • 32. Prevalence: “ It refers specially to all the cases (old & new) existing in a given point in time or over a period of time in a given population.” It has two types: 1. Point prevalence. 2. Period Prevalence.
  • 33. Types of prevalence- • Prevalence at any given point of time. • 4% TB cases on 1st April Point prevalence • Prevalence at a given period of time. • Period will be 1year. Period prevalence
  • 34. Point Prevalence = No. of all current cases of a specified disease existing × 100 at a given point in time. Estimated population at the same point in time.
  • 35. Of 10,000 female residents in town A on 1st January 2006, 1,000 have hypertension. Calculate the point prevalence of hypertension among women in town A on this date…..?????
  • 36. Period Prevalence = No. of existing cases of a specified disease during a given period of time. × 100 Estimated mid interval population at risk.
  • 37.
  • 38. Prevalence depends upon two factors Given as: P= I×D Prevalence= Incidence × Duration Or Incidence = P/D Duration = P/I
  • 39.
  • 40.
  • 41. Relationship Between Incidence and Prevalence. • Cancer of the pancreas – Incidence low – Duration short – Prevalence low • Adult onset diabetes – Incidence low – Duration long – Prevalence high • Roseola infantum – Incidence high – Duration short – Prevalence low • Essential hypertension – Incidence high – Duration long – Prevalence high
  • 42.
  • 43.
  • 44. 1. Circle the most appropriate explanation on “Prevalence rate”: a. the number of patients who have the disease at a particular time, divided by the population at risk of having the disease at that time. b. the number of new cases of a diseased in a population over a period of time. c. not useful for developing HIV/AIDS control program. d. useful for developing Avian flu control program.
  • 45. 2- Differentiate b/w incidence & prevalence rate.??? 3- If no. of doctors is 1000 and population size is 9500 , calculate the doctor to population ratio. 4- What are the basic tools of measurement in epidemiology???