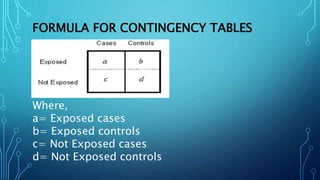
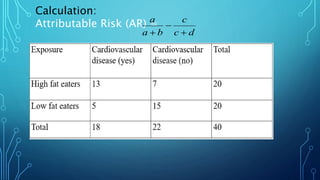
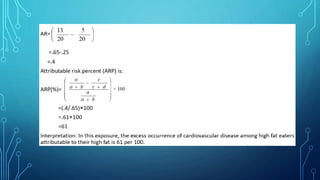
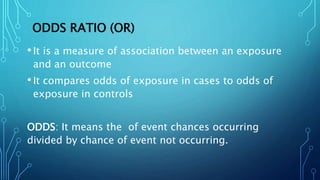
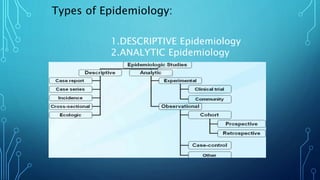
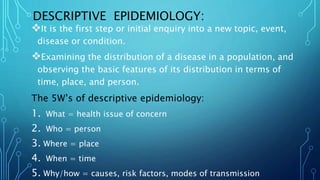
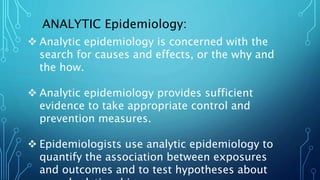
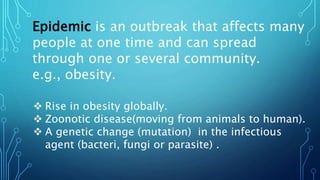
The document discusses key concepts in epidemiology including descriptive and analytic epidemiology. Descriptive epidemiology examines the basic features of disease distribution in terms of time, place and person, while analytic epidemiology aims to identify causes and effects through quantitative analysis. The document also defines other epidemiological terms such as prevalence, incidence, risk, rate, ratio and their uses and calculations. Concepts like endemic, epidemic, pandemic are also explained along with examples.


![Prevalence :
Prevalence is the number of new cases that have
occurred in a given time period over the number
of total people. It measures of disease burden.
Prevalence (a proportion): [(Cases of disease /
Total people) *100]](https://image.slidesharecdn.com/epidemiologyriskrateratiooddratio-200921163723/85/Epidemiology-risk-rate-ratio-odd-ratio-14-320.jpg)


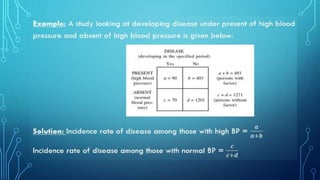
![Example
R = number of hospitals / (population
size)
„ R may be multiplied by k = 10,000
„ Units = hospitals per 10,000 people
„ Suppose
− R = 4 hospitals/20,000 people
= 0.0002 hospitals per person
− R*k = 0.0002 * 10,000
= 2 hospitals per 10,000 people
− Units = hospitals per 10,000
people]](https://image.slidesharecdn.com/epidemiologyriskrateratiooddratio-200921163723/85/Epidemiology-risk-rate-ratio-odd-ratio-20-320.jpg)