Download as PDF, PPTX
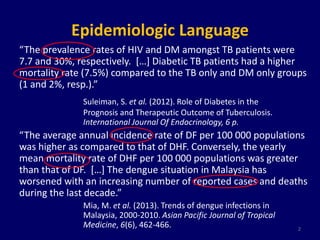
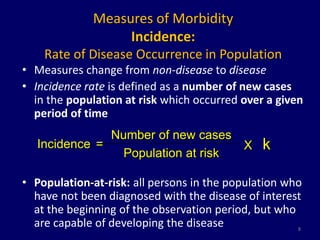
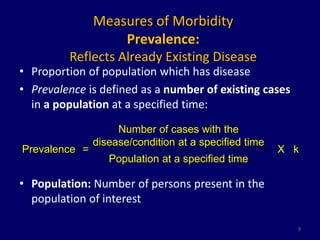
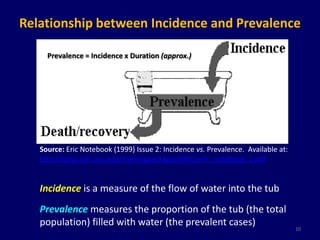
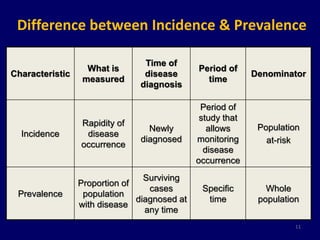

The document discusses the epidemiology of morbidity and mortality, highlighting key statistics such as the prevalence of HIV and diabetes among tuberculosis patients. It reviews the differences between incidence and prevalence, explores various health measures, and underscores the importance of accurate data in assessing disease impact. Additionally, the document examines mortality data, its significance in public health, and the interpretation of different health indicators.


![PERI-PROSTHETIC FRACTURE NAIL-PLATE CONSTRUCT [NPC].pptx](https://cdn.slidesharecdn.com/ss_thumbnails/drarunkumardrmohamedashrafperiprostheticfrasturenail-plateconstructnpc-260209164459-7e9d15a1-thumbnail.jpg?width=640&height=640&fit=bounds)


